Transcription
International Journal of Quantitative and Qualitative Research MethodsVol.9, No.1, pp.42-61, 2021ISSN 2056-3620(Print)ISSN 2056-3639(Online)STATISTICAL MEDIATION ANALYSIS USING THE SOBEL TEST ANDHAYES SPSS PROCESS MACROSoleman Abu-BaderSchool of Social Work, Howard Universitysabu-bader@howard.eduTiffanie Victoria JonesSchool of Social Work, Grambling State Universityjonestif@gram.eduABSTRACT: This paper aims to focus on the emerging practical application ofmediational analysis in social science research practice. Objectives: The paperintroduces simple mediation analysis to social science researchers discusses twostatistical methods used to examine the effect of mediating variables on therelationship between the independent and dependent variables. These are the Sobeltest and bootstrapping using Hayes Process Macro. The paper (1) defines anddiscusses the purpose of mediation, (2) discusses conditions for mediation, (3)presents research questions examined by mediation, (4) outlines assumptions ofmediation analysis, (5) presents computer programs used in mediation analysis, and(6) presents a detailed practical example illustrating how to conduct mediatinganalysis, read the results output, and write the results. Implications: The paperconcludes with a discussion on the implications of mediation research for socialscience research and practice.KEYWORDS: mediation, Sobel test, bootstrap, process macroINTRODUCTIONExamination of causal relationships provides understanding of the degree to whichvariation in the independent variable (X) results in change in a dependent variable(Y). Practically, it offers insight as to whether an intervention or treatment wassuccessful or showed a hypothesized effect. However, few causal explanations existbetween two variables alone, as X causes Y, or the X-Y relationship may bereciprocal. Consequently, researchers may seek to examine the degree to which othervariables contribute to the simple bivariate relationship between the independent anddependent variables, X and Y, respectively. These variables, sometimes calledextraneous variables, intervening variables, covariates, or process variables, offer amore complex and deeper understanding of the relationship between X and Y.Wegener and Fabrigar (2000) describe three types of intervening variables for causalhypotheses: (1) direct causal effect, (2) mediated causal effect, and (3) moderatedcausal effect. Mediators and moderators are often confused and used interchangeably42
International Journal of Quantitative and Qualitative Research MethodsVol.9, No.1, pp.42-61, 2021ISSN 2056-3620(Print)ISSN 2056-3639(Online)(Baron and Kenny 1986; Wu and Zumbo 2008). However, as Baron and Kenny(1986) report, they are distinct conceptually, strategically, and statistically. Whilemoderators strengthen the relationship between independent and dependent variables,mediators intervene between the independent and dependent variables. Mediators,labeled as “M”, create an indirect relationship by linking the two variables, X and Y,which helps to explain the process of the relationship. These variables essentiallyrefine a causal relationship by explaining why and how a cause leads to an outcome(Baron and Kenny 1986; Frazier et al. 2004; Wu and Zumbo 2008).This paper focuses on the emerging practical application of mediational analysis insocial science research practice. First, the paper discusses mediating variables andtheir use, research questions examined by mediation analysis, and then presents twouseful statistical methods for analyzing mediating relationships: Sobel test (Sobel1982) and Hayes SPSS Process Macro (Hayes 2013). The paper also discusses theunderlying assumptions for using these analyses. Lastly, a practical example isprovided, which illustrates how to compute the analyses and how to interpret theoutput.LITERATURE/THEORETICAL UNDERPINNINGThe origins of mediation analysis date as far back as 1920 with Sewall Wright’smethod of analysis by path coefficients in which he proposed indirect and directcausal relationships for the genetically-derived color variations in guinea pigs (Wright1920). He described mediation as product of coefficients. Eight years later, R.S.Woodworth presented the Stimulus Organism Response (SOR) theory, which positsthat different mediating mechanisms functioning within an organism intervenebetween the stimulus and the response (Woodworth 1928). As illustrated by theseseminal works, mediating variables intervene between or mediate the relationshipbetween the independent and dependent variables.The value of mediating variables cannot be overstated. As noted, mediating variablesare foundational for understanding mechanisms of effects. Additionally, mediatingprocesses underpin many fields, including theory testing for intervention science,applied research related to prevention and treatment, and development ofpsychological theories, particularly behavioral psychology (MacKinnon, Fairchild,and Fritz 2007). This third application may be most relevant when discussing full orpartial mediation. Specifically, the observation of partial mediation offers clearimplications for empirically testing other indirect effects that are operating (Rucker etal. 2011). This naturally lends itself to further theoretical development. Furthermore,while mediators have proven useful for theory development in the field ofpsychology, as we later discuss, we submit for consideration that these uniquevariables have strong application in other social science fields, such as social workand sociology.43
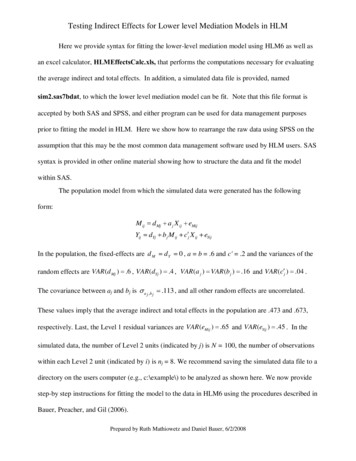
International Journal of Quantitative and Qualitative Research MethodsVol.9, No.1, pp.42-61, 2021ISSN 2056-3620(Print)ISSN 2056-3639(Online)MediationPurpose of MediatorsMediation is an extension of simple linear regression in that it adds one or morevariables to the regression equation. Mediating variables describe the way in which anintervention yields its outcome. Simply defined, mediating variables are “mechanismthrough which X [independent variable] influences Y [dependent variable]” (Hayes2013:7). In mediation analysis, researchers assume that the independent variable (X)affects the mediator (M), which in turn, affects the dependent variable (Y). In otherwords, the relationship between the independent and dependent variable is assumed tobe indirect. Figure 1 is a simple mediation model illustrating the relationship betweenX, M, and Y.Figure 1: Simple Mediation ModelEffect of X on YThe relationship between the independent (X) and dependent (Y) variables may bedirect or indirect. Direct effect occurs when the relationship between X and Y cannotbe influenced by a third (or fourth) variable. Indirect effect occurs when therelationship between X and Y is influenced by one or more variables, that is, mediatedby other variables.In figure 1, the paths “a”, “b”, and “c” represent the regression coefficients, thecorrelation between X and M, M and Y, and X and Y, respectively. The coefficient“c” conveys the direct effect of X on Y, whereas the coefficients “a” and “b” conveythe indirect effect of X on Y. The total effect of X on Y in figure 1 is equal to “c a*b” (Baron and Kenny 1986). Based on this figure, if either “a” or “b” is zero, thenthe relationship between X and Y is said to be direct and the total effect is equal to “c”(Total effect c a*b c 0 c). The ratio of the indirect effect (a*b) and totaleffect (a*b c) represents the proportion of the effect that is contributed to themediator (formula 1) (Hayes 2013).Formula 1: Ratio of Indirect Effect to Total Effect44
International Journal of Quantitative and Qualitative Research MethodsVol.9, No.1, pp.42-61, 2021ISSN 2056-3620(Print)ISSN 2056-3639(Online)Conditions for MediationAccording to Baron and Kenny (1986), a variable can function as a mediator in thecausal sequence if regression analyses reveal statistically significant relationships atthe first three levels under the following conditions:1.The independent variable is a statistically significant predictor of thedependent variable (X predicts Y).2.The independent variable is a statistically significant predictor of the mediator(X predicts M). Here, the mediator serves as a dependent variable for the independentvariable.3.The mediator is a statistically significant predictor of the dependent variablewhile controlling for the effect of X (M predicts Y). Here, the mediator serves as anindependent variable for the dependent variable. These three steps should show adirect effect. If any of these relationships is not statistically significant, then mediationcannot be assumed and is determined unlikely or impossible. Once a statisticalsignificance has been established, we can proceed to the fourth step.4.The observed effect of the mediator on the relationship between X and Y isexamined as either full or partial mediation model.A full mediation model occurs when X no longer statistically significantly affects Y,after controlling for M; that is, the correlation between X and Y is reduced and is nolonger significant. Conversely, if the effect of X on Y is still statistically significantbut reduced, partial mediation model is supported. In general, the smaller thecoefficient “c” becomes, the greater is the effect of the mediator.The causal step approach designed and popularized by Baron and Kenny (1986) hasreceived some criticism for its first step, that X must cause Y for a mediational effectto exist. MacKinnon et al. (2007) suggested that a mediational effect could possiblyexist despite there being no effect of X on Y. Similarly, Rucker et al. (2011)developed a simulation model to demonstrate that significant indirect effects could befound without a direct effect between X and Y. To develop a model that could includemultiple mediators, Saunders and Blume (2018) contrasted a single step approach byhandling mediators as covariates. This treatment of mediators starkly contrastsMacKinnon’s handling of mediators, as MacKinnon (2018) notes that covariates,while related to X and Y, are not in the causal sequence between X and Y. Asaforementioned, mediators are unique variables in that their role is to delineate acause between X and Y, making the mediator the crux of the causal relationshipbetween X and Y. Despite some criticism, and though Baron and Kenny’s (1986)four-step approach for testing mediation remains the cornerstone approach, otherapproaches are often used as a supplement to their technique or as a replacement.These include the empirical M-test (Holbert and Stephenson 2003), bootstrapping(Stine 1989), and the Sobel test (Sobel 1982). Of particular interest for this paper arethe latter two techniques.45
International Journal of Quantitative and Qualitative Research MethodsVol.9, No.1, pp.42-61, 2021ISSN 2056-3620(Print)ISSN 2056-3639(Online)Research QuestionsSuppose a researcher was interested in examining the effect of a mediator variable onthe relationship between the independent and dependent variables. The researchermay state the research questions as follow: Is there a statistically significant relationship between the independent (X) anddependent (Y) variables, and can this relationship be mediated by a third variable(M)? To what extent is the dependent variable (Y) related to the independentvariable (X) and is this relationship mediated by a third variable (M)?For examples, a health care settings administrator may want to examine if “there is astatistically significant relationship between hours of frontline work (X) in a hospitalsetting and fear levels (y) and whether this relationship is mediated by perception ofcommunity support (M)”. Or a behavioral organizational researcher may want toexamine “to what extent job satisfaction (Y) among social services employees isrelated to their satisfaction with their supervisions (X) and if this relationship ismediated by promotion opportunities (M).” Also, a mental health provider may wantto examine if “there is a statistically significant relationship between immigrants’physical health (X) and their levels of depression (Y) and if this relationship ismediated by their levels of emotional balance (M).”Types of Data and AssumptionsBecause mediation analysis relies on a linear regression analysis, mediating variablesfollow same set of assumptions required by regression analysis. These assumptionsinclude the following (Author 2016): Levels of Measurement: The independentvariable (X) can be either a dummy variable (coded as 0 and 1) or a continuousvariable that is measured at the interval level of measurement or higher. Themediating (M) and the dependent (Y) variables should be continuous data andmeasured at the interval level of measurement or higher.Normality: The distributions of X, M, and Y should be normal. To evaluate normality,inspect Pearson’s and Fisher’s skewness coefficients, normality tests (KolmogorovSmirnov and Shapiro-Wilks), and both histogram and Q-Q plots for X, M, and Y.Linearity: The relationship between X, M, and Y must be linear relationship. Toevaluate linearity, inspect the results of the Pearson’s correlation and the scatterplotsfor X and M, M and Y, and X and Y.Homoscedasticity: For each level of the independent variable, the mediating anddependent variables should be normally distributed. To evaluate this assumption,inspect the scatter plot for the residuals (errors) against the predicted values. This plotis available through the SPSS regression menu.Normality of errors: Errors, also called residuals, must be normally distributed. Toevaluate this assumption, inspect the histogram and normality plots for the residuals.These plots are available through the SPSS regression menu.46
International Journal of Quantitative and Qualitative Research MethodsVol.9, No.1, pp.42-61, 2021ISSN 2056-3620(Print)ISSN 2056-3639(Online)Statistical Computer ProgramsAs aforementioned, several statistical methods have been used to examine the effectof a third (fourth, etc.) variable on the relationship between the independent anddependent variables. These include multiple regression analysis (Author 2016),structural equation models (Byrne 2001; Kline 1998), Sobel test (Sobel 1983), andHayes SPSS Process Macro (Hayes 2013). The last two methods are discussed here.Sobel TestThis is a simple test statistic proposed by Sobel (1982). The Sobel test is utilized toexamine the hypothesis in which the relationship between the independent (X) anddependent (Y) variables is mediated / affected by a third variable (Y); that is, X and Yhave an indirect relationship. In other words, Sobel test examines whether theinclusion of a mediator (M) in the regression analysis considerably reduces the effectof the independent variable (X) on the dependent variable (Y) (Preacher 2020). Thehypothesis is tested that there is no statistically significant difference between the totaleffect and the direct effect after accounting for the mediator; if a significant teststatistic results, then total or partial mediation can be supported (Allen 2017). TheSobel test is simple to utilize. It requires three steps:1.Run a simple linear regression analysis for the effect of the independentvariable (X) on the mediator (M). This step computes both unstandardized regressioncoefficient (a) and the standard error of “a” (Sa).2.Run a multiple linear regression analysis for the effect of the independent (X)and mediating (M) variables on the dependent variable (Y). This step computes bothunstandardized regression coefficient (b) and the standard error of b /quantpsy.org/sobel/sobel.htm) to calculate the test statistic, standard error, andthe level of significance (p value).You may also use formula 2 to compute the Sobel test statistic value, which is basedon the Z score. This formula was proposed by Sobel (1982), which is the ratio of theproduct of “a” and “b” to the standard error.Formula 2: Z value for Sobel TestIf formula 2 is utilized to compute the Sobel test statistic, use a “Z Scores” table todetermine if the computed Z value falls outside the critical values (Author 2020). Forexample, the computed Z score will be statistically significant if it falls outside 1.96given a two-tailed alpha of .05 and outside 2.58 given a two-tailed alpha of .01.The Sobel test, however, has been criticized by various researchers in that it is basedon the standard normal distribution (z scores), which requires a large sample size toconduct mediation analysis (Kenny et al. 1998; MacKinnon et al. 2002; Sobel 1982).47
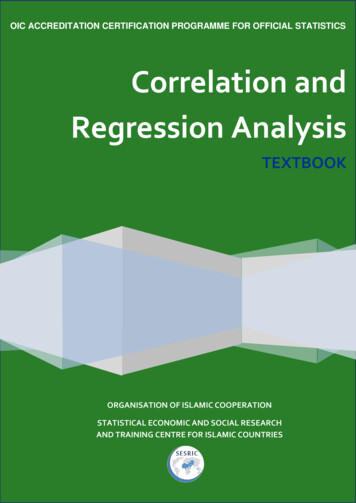
International Journal of Quantitative and Qualitative Research MethodsVol.9, No.1, pp.42-61, 2021ISSN 2056-3620(Print)ISSN 2056-3639(Online)To overcome the problem of normality, some researchers (Hayes 2013; Preacher andHayes 2004) recommend the use of a bootstrap method to examine mediation effect.Originated by B. Efron in 1979, bootstrapping methods are computer techniques thatallow for resampling of a large number of small samples (e.g., 1000, 5000 samples,etc.) with replacement from the original sample to provide an estimate of the standarderror and generate a confidence interval (Efron 1979; Hayes 2009). Bootstrappingrequires fewer assumptions, yields the highest power, and diminishes the risk of type1 error (Hayes 2009; 2013).HAYES SPSS PROCESS MACROProcess Macro is a bootstrapping statistical computer tool written by Andrew Hayesas an extension for both SPSS and SAS software (Hayes 2013). The program is usedto examine the effect of one or more mediating or moderating variables on therelationship between the independent and dependent variables. The program computesthe direct, indirect, and total effects of X on Y as well as unstandardized andstandardized regression coefficients, standard errors, and other statistics including tand p values and R2. Furthermore, unlike Sobel test, which assumes a continuousoutcome (Y), Process Macro can be used with both continuous outcome (linearregression analysis) and dichotomous outcome (logistic regression analysis). Users processmacro.org/download.html).Practical ExampleThis example is based on a self-administered survey data collected from 155immigrant Muslims aged fifty and above (Author 2020). Among others, participantscompleted standardized measures on their physical health (PH), emotional balance(EB), and depressive symptoms (CESD). The SPSS data file used for this Research QuestionTo what extent are participants’ depressive symptoms (Y) related to their physicalhealth (X), and is this relationship mediated by participants’ emotional balance (M)?Or, does participants’ emotional balance affect the relationship between their physicalhealth and depressive symptoms? Figure 2 illustrates this research question.Figure 2: Simple Mediation Model - Physical Health and Depression by EmotionalBalance48
International Journal of Quantitative and Qualitative Research MethodsVol.9, No.1, pp.42-61, 2021ISSN 2056-3620(Print)ISSN 2056-3639(Online)HypothesesHo: Emotional balance does not significantly mediate the relationship betweenphysical health and depressive symptoms.Ha: Emotional balance significantly mediates the relationship between physical healthand depressive symptoms.Steps in Mediating AnalysisStep 1: Before proceeding with any regression and mediation analysis, it is essentialto evaluate the data for normality of all variables under study and their residuals,linearity, and homoscedasticity. Because this process requires a number of SPSScalculations, tables and figures, and it is not the subject of this paper, it will not bediscussed here although the variables discussed here have met these assumptions(Author 2016).Step 2: Now, we should establish that there is a ground for mediation by confirmingthe following conditions (Baron and Kenny 1986):The independent variable (physical health - PH) predicts the dependent variable(depressive symptoms - CESD); that is, “c” is statistically significant. Theindependent variable (PH) predicts the mediator (EB); that is, “a” is statisticallysignificant. The mediator (EB) predicts the dependent variable (CESD) whilecontrolling for the effect of the independent variable (PH); that is, “b” is statisticallysignificant. To examine these three conditions, use SPSS, or any statistical program,and run three regression analyses as follow: (1) regress CESD on PH, (2) regress EBon PH, and (3) regress CESD on PH and EB (Author 2016).Tables 1-3 display the SPSS regression output. These tables display theunstandardized and standardized regression coefficients, standard errors, the t and pvalues, and the 95% confidence interval for each analysis. Table 1 shows that theindependent variable (PH) is a significant predictor of the dependent variable (CESD)(t -3.47, p .01). In other words, “c” (unstandardized coefficient -.630) is astatistically significant.Table 1: Regression Analysis of Physical Health on DepressionTable 2 shows that the independent variable (PH) is also a significant predictor of themediating variable (EB) (t 6.14, p .001). That is, “a” (unstandardized coefficient .485) is a statistically significant.49
International Journal of Quantitative and Qualitative Research MethodsVol.9, No.1, pp.42-61, 2021ISSN 2056-3620(Print)ISSN 2056-3639(Online)Table 2: Regression Analysis of Physical Health on Emotional BalanceTable 3 shows that while controlling for the independent variable (PH), the mediatingvariable (EB) is a significant predictor of the dependent variable variable (CESD) (t -4.96, p .001). That is, “b” (unstandardized coefficient -.874) is a statisticallysignificant.Table 3: Regression Analysis of Physical Health and Emotional Balance onDepressionStep 3: Next, after confirming the three conditions for mediation are established,examine if the mediating variable (emotional balance) is a statistically significantusing the Sobel test (using the Z formula) or Hayes Process Macro. For this article, wewill illustrate these two methods.Sobel TestTo utilize the Sobel test, follow these steps:Determine both “a” and “b” unstandardized regression coefficients and their standarderrors (Sa and Sb, respectively). These values are found in both tables 2 and 3,respectively, and are summarized in figure 3.Figure 3: Unstandardized Regression Coefficients and Standard Errors50
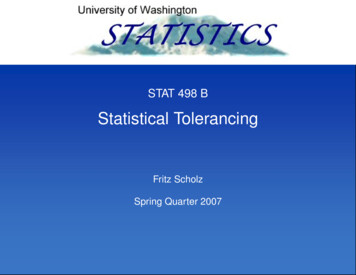
International Journal of Quantitative and Qualitative Research MethodsVol.9, No.1, pp.42-61, 2021ISSN 2056-3620(Print)ISSN 2056-3639(Online)Open the computer calculator program, found at http://quantpsy.org/sobel/sobel.htm,and insert the values for “a”, “b”, “Sa”, and “Sb” in the “Input” boxes and click on“Calculate” as shown in Screen 1.Screen 1: Computer Calculator for MediationScreen 1 displays the results of the Sobel test as well as two additional tests: Aroianand Goodman tests. The latter two tests use slightly modified formulas of the Sobeltest to compute the Z score (MacKinnon, Warsi, and Dwyer 1995). You may alsocompute the Sobel test statistic using formula 2 as follows:Because the computed z score (-3.85) falls outside the z critical values of 2.58, it indicates a statistically significant result at alpha .01.Writing the Results of the Sobel TestSobel test was utilized to examine if emotional balance mediated the relationshipbetween physical health and depressive symptoms. First, results of simple linearregression show that physical health was a statistically significant predictor ofdepressive symptoms (b -.63, beta -.28, t -3.47, p .01). Next, when themediator, emotional balance, was entered in the regression analysis, physical healthwas no longer a significant predictor of depressive symptoms (b -.31, beta -.13, t -1.62, p .05). On the other hand, the mediator, emotional balance, emerged as a51
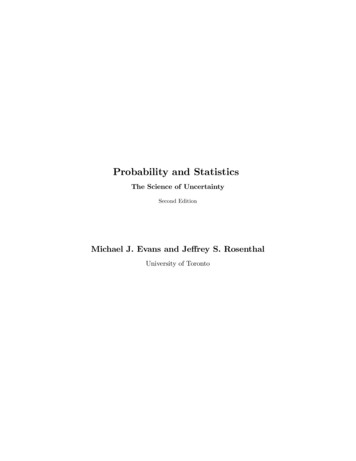
International Journal of Quantitative and Qualitative Research MethodsVol.9, No.1, pp.42-61, 2021ISSN 2056-3620(Print)ISSN 2056-3639(Online)significant predictor of depressive symptoms (b -.87, beta -.41, t -4.96, p .001;95% CI1 “-1.22” to “-.53”).To further investigate the mediator, the Sobel test was utilized to examine ifemotional balance significantly mediated the relationship between physical health anddepressive symptoms. The results confirmed that emotional balance significantlymediates the relationship between physical health and depressive symptoms (Z 3.86, p .001).Hayes SPSS Process Macro TestNext, we will utilize the SPSS Process Macro to examine the null hypothesis. UnlikeSobel test, Process Macro provides various coefficients and test statistics that explainthe indirect, direct, and total effects as well total and partial effect sizes.To utilize the SPSS Process Macro, follow these steps (make sure to download essmacro.org/download.html):In the SPSS main menu, click on Analyze, scroll down to Regression, and click onProcess v3.5 by Andrew F. Hayes.From the variables list, move the dependent variable (CESD) in the Y variable’s box,the independent variable (PH) in the X variable’s box, and the mediator (EB) in theMediator(s) M’s box.Click on the Model number dropdown arrow and select 4 (this is the model for asingle mediator analysis. See Hayes, 2013 for other models) (see screen 2).Click on Options and check the boxes of “Show total effect model”, “Effect size”, and“Standardized coefficients” (screen 3).Click on “Continue” and then “Ok”.1If “zero” falls within the 95% confidence interval, then don’t reject the nullhypothesis; mediation cannot not be assumed.52
International Journal of Quantitative and Qualitative Research MethodsVol.9, No.1, pp.42-61, 2021ISSN 2056-3620(Print)ISSN 2056-3639(Online)Screen 2: SPSS Process Macro Main Dialog BoxScreen 3: SPSS Process Macro Options Dialog BoxReading the SPSS Process Macro OutputAs stated earlier, Hayes SPSS Process Macro produces various coefficients and teststatistics. First, the program produces two regression analyses, one for X on M (table4) and another for X and M on Y (table 5). These are similar to tables 2 and 3,respectively. Unlike tables 2 and 3, tables 4 and 5 also report the multiple correlationcoefficient (R), R square, ANOVA test statistic, and the standardized coefficients foreach analysis (these are also produced by the SPSS main regression analysis; seeAuthor, 2016 for details).53
International Journal of Quantitative and Qualitative Research MethodsVol.9, No.1, pp.42-61, 2021ISSN 2056-3620(Print)ISSN 2056-3639(Online)Table 4: Regression Analysis of Physical Health on Emotional BalanceTable 5: Regression Analysis of Physical Health and Emotional Balance onDepressionTable 6 conveys the results of the mediation analysis. The table reports the direct,indirect, and the total effects of the independent variable on the dependent variable, aswell as the 95% confidence interval using the Bootstrapping method.Table 6: Bootstrap Estimates of Direct, Indirect, and Total Effects of Physical Healthon DepressionDirect EffectThis examines if the relationship between the independent and dependent variables isdirect and not mediated by a third variable. The results in table 6 show that the directeffect was -.31 with a t value of -.162 and a p value of .11 (p .05). Thus, we fail toreject the null hypothesis in which the relationship between physical health and54
International Journal of Quantitative and Qualitative Research MethodsVol.9, No.1, pp.42-61, 2021ISSN 2056-3620(Print)ISSN 2056-3639(Online)depressive symptoms is not direct. Notice that “zero” falls within the 95% confidenceinterval (-.68 to .07). In other words, the “c” coefficient is not statistically significant(p .05).Indirect EffectThis part of the results examines the null hypothesis that the indirect relationshipbetween the independent (X) and the dependent (Y) variables is equal to zero. Thetable shows that the indirect effect is equal to “-.43” with a 95% bootstrap confidenceinterval of -.62 (lower limit) to -.25 (upper limit). Because “zero” does not fall withinthe 95% confidence interval, we will reject the null hypothesis. In other words, weconclude that emotional balance mediates the relationship between physical healthand depressive symptoms; that is, “a*b” is a statistically significant at alpha .05 (p .05).Total EffectThis is the total effect produced by the entire model, indirect and direct effect. It is thesum of indirect effect (a*b) and direct (c) effects. Table 6 shows that the total effectwas -.73 with a “t” value of -4.04 and a p value of “.00”, thus indicating a statisticallysignificant effect (p .05).Writing the Results of Hayes Process MacroA bootstrapping method was performed using SPSS Process Macro to examine ifemotional balance mediated the relationship between physical health and depressivesymptoms. First, the results of the regression analysis show that the physical health(independent variable) was a significant predictor of emotional balance (b .49, t 6.12, p .001). Next, while controlling for emotional balance (mediator), the resultsof the second regression analysis show that physical health was not a significantpredictor of depressive symptoms (dependent variable (b -.31, t -1.62, p .05).The results of the indirect effect based on 5000 bootstrap samples show a significantindirect negative relationship between physical health and depressive symptomsmediated by emotional balance (a*b -.43, Bootstrap CI95 -.62 and -.25). Themediator, emotional balance, accounted for approximately 59% of the total effect ondepressive symptoms [PM (-.43) / (-.73)]. On the other hand, there was nostatistically significant direct effect between physical health and depressive symptoms(b -,31, t -1.62, p .05). Table 7 displays the results of the mediation analysis.55
International Journal of Quantitative and Qualita
HAYES SPSS PROCESS MACRO Soleman Abu-Bader School of Social Work, Howard University sabu-bader@howard.edu Tiffanie Victoria Jones School of Social Work, Grambling State University jonestif@gram.edu ABSTRACT: This paper aims to focus on the emerging practical application of