Transcription
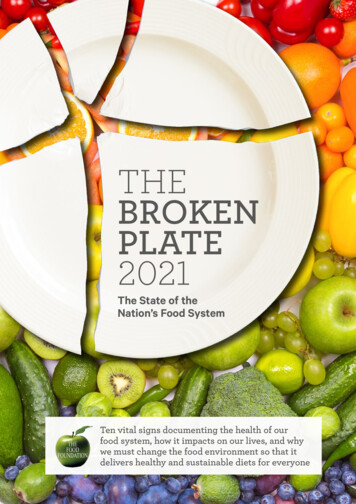
THEBROKENPLATE2021The State of theNation’s Food SystemTen vital signs documenting the health of ourfood system, how it impacts on our lives, and whywe must change the food environment so that itdelivers healthy and sustainable diets for everyone
CONTRIBUTORSA massive thank you to all of our contributors, without whom Broken Plate would not be possibleFOREWORD‘We’re all in this together’ was a frequently cited mantra in the early days of the Covid-19 pandemic. Except, as it turnedout, we weren’t. Covid-19 not only shone a spotlight on a number of pre-existing inequalities in the UK but served to further exacerbate many of them.People living in the most deprived communities were around four times as likely to die from Covid-19 over the courseof the pandemic as those living in the least deprived areas (Resolution Foundation, 2021). Risk of dying among thosediagnosed with Covid-19 was also higher in those in Black, Asian and Minority Ethnic groups than in White ethnic groups(Public Health England, 2020a). Black, Asian and Minority Ethnic groups were also twice as likely to have experienced foodinsecurity compared to White households during the pandemic (Food Foundation, 2021). In January 2021, adults identifying as being limited a lot by health problems or a disability were five times more likely to be food insecure than thosewithout, and 10% of households with children reported food insecurity (Food Foundation, 2021). People on low incomeswere three times as likely to have been furloughed as high earners and four times as likely to have lost their jobs in the firstphase of the crisis (Bell, 2020).THANK YOUHuge thanks to Nye Cominetti, Elena Salazar, Dr Thomas Burgoine, Matthew Keeble, Debbie Bremner, Sonia Pombo, Holly Gabriel,Dr Kawther Hashem, Caroline Hancock, Dr Kate Ellis, Dr Jean Adams and Dr Bernadette Moore for their support and expert analysis.With special thanks to Dr Carmelia Alae-Carew and Dr Tim Lobstein for their input, analysis andadvice as part of this year’s report.WITH THANKS TOThe Nuffield Foundation, for their support in making this work possible.The Nuffield Foundation is an independent charitable trust with a mission to advance social well-being. It funds research thatinforms social policy, primarily in Education, Welfare, and Justice. It also funds student programmes that provide opportunities foryoung people to develop skills in quantitative and scientific methods. The Nuffield Foundation is the founder and co-funder of theNuffield Council on Bioethics, the Ada Lovelace Institute and the Nuffield Family Justice Observatory. The Foundation has fundedthis project, but the views expressed are those of the authors and not necessarily the Foundation. Visit www.nuffieldfoundation.orgwhiteFOOD FOUNDATION AUTHORSRebecca Tobi, Shona Goudie, Isabel HughesAs policymakers and businesses look ahead to the post-pandemic recovery, tackling dietary inequalities, which are oftenclosely linked to other health and economic inequities, has been recognised as a public policy imperative. The NuffieldFoundation is an independent charitable trust whose purpose is to advance social well-being in the UK. We were one ofthe original funders that established the Food Foundation in 2015 and are pleased to be funding its ‘Changing the Story onDietary Inequality’ programme over the next three years. This programme aims to reshape the public narrative on dietaryinequality and be the catalyst for purposeful action by policymakers and businesses.The Broken Plate is the Food Foundation’s flagship report and will form a central pillar of its work on dietary inequality. Thisreport highlights how the food environment is skewed towards less healthy options, with healthier foods much less accessible and affordable for those on lower incomes. This in turn leads to disparities between the health of adults and childrenin lower income households and their wealthier peers. Those living with obesity and nutrition-related chronic diseasessuch as type 2 diabetes and hypertensive diseases were at greater risk of severe outcomes as a result of Covid-19, highlighting the significant public health impact of poor diets in the UK (Public Health England, 2020a). Through this report,and its broader programme of work, the Food Foundation builds the evidence and connects this data to people’s lives, bygiving a voice to those experiencing dietary inequality as an everyday reality.The government’s most recent obesity strategy published in July 2020 included proposals to remove price promotionson foods high in salt, sugar and fat, and restrict advertising online. With the publication of part two of the National FoodStrategy expected shortly, this is the first time in 75 years that a ‘farm to fork’ review of England’s food system has beenundertaken. The Broken Plate puts forward the case for why there must be fundamental policy changes in our approachto the food environment if we are serious about improving the nation’s health and addressing the wider questions of socialwell-being that follow from it.The Nuffield Foundation commends the Food Foundation for the rigour of its research and its impact on public policy andthe public debate.TIM GARDAMChief Executive of the Nuffield Foundation.REPORT DEISGNwhitecreativecompany.co.ukONS CROWN COPYRIGHT INFORMATION This work contains statistical data from ONS which is Crown Copyright. The use of the ONS statistical data in this work does not imply the endorsement of the ONS in relation to theinterpretation or analysis of the statistical data. This work uses research datasets which may not exactly reproduce National Statistics aggregates.THE BROKEN PLATE 2021 Food Foundation3
IntroductionEach year our Broken Platereport assesses whetherprogress has been madeagainst ten metrics, whichwere selected to provide aholistic picture of the foodsystem, encompassing the foodenvironment, drivers of foodchoice, and the impact of thefood system on our health andthe environment.We have organised thesemetrics into four focus areas,highlighting the changes thatare needed if we are to supporteveryone in being able to eat ahealthy diet. Traffic light scoreshave been assigned to eachmetric, measuring any progressmade over the past yearbetween Broken Plate 2020and this year’s report.New in this year’s report, weinclude summaries of the policyinterventions which aim todrive progress. The last threemetrics assess the healthoutcomes which stem from ourcurrent food environment asa whole, rather than looking atthe drivers of poor diets, andwe have therefore not includedpolicy summaries in thesesections.This year, we have also includedthe voices of our Children’sRight 2 Food Young FoodAmbassadors and Peas Please Veg Advocates from Englandspeaking about the issuesexplored within this report. Bothgroups of citizens support theFood Foundation in our missionto deliver a sustainable foodsystem that creates health andwell-being for all by sharing theirown thoughts and experiences.We are extremely grateful fortheir support.4Food Foundation THE BROKEN PLATE 2021AT A GLANCE METRIC 1: ADVERTISING Advertising spend on fruit and vegetables remains verylow, with just 2.5% of total food and soft drink advertising spend going towards fruit andvegetables.THEME METRIC 2: THE AFFORDABILITY OF A HEALTHY DIET The poorest fifth of UKhouseholds would need to spend 40% of their disposable income on food to meetEatwell Guide costs. This compares to just 7% for the richest fifth.Make healthieroptions moreappealingWhat’s changed since 2020’s report? THEMEIMPROVEMENTNO CHANGEDETERIORATED Makehealthieroptions moreaffordable METRIC 3: FOOD PRICES More healthy foods are nearly three times as expensiveas less healthy foods calorie for calorie. METRIC 4: WAGES 25% of workers in the food sector earn the minimum wage orbelow compared to 11% of workers across the UK.THEME “Location, incomecan affect yourchance of life And it's justsuch a shamethat we have tolive in a countrywhere this ishappening.”YOUNG FOODAMBASSADORMakehealthier andsustainableoptions moreavailable METRIC 5: PLACES TO BUY FOOD 1 in 4 places to buy food are fast food outlets. Theproportion of fast food outlets is higher in the most deprived local authorities compared tothe least deprived. METRIC 6: PRODUCTS WITH TOO MUCH SUGAR 96% of yogurts and 92% of cerealsmarketed towards children contain high or medium levels of sugar. METRIC 7: PRODUCTS WITH TOO LITTLE VEG 22% of ready meals are vegetarian or plantbased, with a welcome drop in price for vegetarian and plant-based meals since last year’s survey.THEMEAct nowand addressinequalities sothat everyonehas the chanceof a longerhealthier life METRIC 8: CHILDHOOD OBESITY Children in the most deprived fifth of households arealmost twice as likely to have obesity as those in the least deprived fifth of households byage 4–6. METRIC 9: CHILD GROWTH Children in the UK at age 4-5 are on average shorterthan children in other comparable high income countries. In England, children living indeprived communities are shorter than children living in wealthier communities by thetime they reach age 10-11. METRIC 10: DIABETES There are almost 10,000 diabetes-related amputations carriedout on average per year, an increase of 24% in the past five years.“We need to change the subsidiesround, don’t we? We need to makethe healthy food the easy optionand the cheaper option.”TRAJECTORYWhat does the futurehold for the health ofchildren born in 2021?By the time they’re 65 years old, over half of the children born in 2021will experience diet-related disease which may affect their quality oflife. Whether children are born into richer or poorer households greatlyimpacts on their risk of obesity as well as limiting life expectancy.VEG ADVOCATETHE BROKEN PLATE 2021 Food Foundation5
THEME:Make healthier optionsmore appealing METRIC 1: ADVERTISINGAdvertising and marketing mean that before we even decide what to eat, we’re influenced by massmedia. People are constantly confronted with advertising for less healthy foods on social media,online and on TV (ASA, 2018). Evidence shows this has a direct (and indirect) impact on how muchwe eat (Critchlow et al., 2020). Moreover, children and adults from lower socio-economic groups are50% more likely to be exposed to ads for HFSS (high fat, salt and/or sugar) foods than those fromhigher socio-economic groups (Yau et al., 2021). Campaigns like Veg Power and ITV’s Eat Them toDefeat Them have shown that advertising healthier foods can have a positive effect on sales. Weneed to make it easier for people to make healthier choices by addressing the current imbalance inadvertising spend between healthy and less healthy foods.“What advertisers will do as well is blame individuals forthe choices we are making as do the government in a lot oftheir campaigns. It’s like this is your choice, you’re makingthe bad choice and you’re choosing these things, butactually that’s not what happens, it’s not the individuals, it’sthe subliminal messaging and it’s the food environment.”VEG ADVOCATE6Food Foundation THE BROKEN PLATE 2021THE BROKEN PLATE 2021 Food Foundation7
METRIC01THEMEAdvertising: We need more advertising of healthy foodsand to restrict advertising of foods high in fat, salt and sugarMAKE HEALTHIEROPTIONS MORE APPEALINGADVERTISINGAdvertising spend on fruit and vegetables remains very low, withjust 2.5% of total food and soft drink ad spend going towards fruitand vegetables.WHAT DID WE DO?We analysed data on advertisingspend in the UK for food and softdrinks (Nielsen Ad Intel, 2020),covering advertising in cinema,direct mail, door drops, outdoor,press, radio and TV. We calculatedthe percentage of advertising spendon four different categories of foodand drink – fruit and vegetables,confectionary, sweet and savourysnacks, and soft drinks – comparingad spend for the three yearsbetween 2017 and 2020 where wehave data.WHAT’S HAPPENING?Advertising spend on foods high in salt, fat and sugar continues to be much higherthan spend on fruit and vegetables. Despite a small but promising uplift in spend onfruit and veg advertising as a proportion of total food and soft drink advertising spendbetween 2017 and 2019, in 2020 this dropped back down to 2017 levels. Overall, thereare no strong trends – spending on each of the four categories as a proportion of totaladvertising spend has remained much the same over time, with only marginal changesin either direction between 2017 and 2020.Although proportionally there have not been any major shifts in spend for our fourcategories, Covid-19 does appear to have impacted on advertising spend for someindividual products. Ad spend on home baking and cake mixes increased by 107%between 2019 and 2020, while – perhaps unsurprisingly – spend on popcorn droppedby 82% and spend on party snacks by 60%.Covid-19 also significantly impacted on total UK ad spend. Advertising revenue intraditional media dropped by an estimated 20% in 2020 (Emarketer, 2020a), in partdriven by the closure of cinemas and less Out of Home advertising. Although digitaladvertising (which is not included here) has risen during the pandemic (Emarketer,2020b), it is unlikely that the ratio of spend on healthier foods compared to less healthyfoods is any different online. Young people aged under 18 in Britain are exposed to anestimated 15 billion online ads for foods high in sugar, salt and fat every year (nearly500 adverts per second) (Bite Back 2030, 2021).“Young people during lockdown –we just lived online lives. So whileI’m doing online school I’m alsoseeing ads for Just Eat, Deliveroo,McDonalds, KFC next to me .so100% it’s only gotten worse overlockdown.” YOUNG FOOD AMBASSADORThe proportion of ad spend on our four categories over timeIS POLICY SUPPORTING PROGRESS?In recent years several new policies have been proposed orimplemented which aim to reduce advertising for unhealthyfood. This is positive, but as most policies in this space arequite recent, we have yet to see their impact.Source: Nielsen Ad Intel, 2017;2019;20208Food Foundation THE BROKEN PLATE 2021WiththankstoIn 2007 the government limited advertising of junk foodon children’s TV channels and during TV programmes‘directed to or of particular appeal to’ children. Since thenthe government has consulted on a 9pm watershed onbroadcast TV (in 2019) and a total online ban for junk foodadvertisements (in 2020). In the 2021 Queen’s Speech thegovernment confirmed that they would be proceedingwith both these policies, though formal responses to thetwo consultations have not yet been published. Some localareas have also taken action. In 2018 the Mayor of Londonannounced that junk food advertising would be bannedon the entire Transport for London (TfL) network fromFebruary 2019, and in early 2021 Bristol Council announcedthat they would be restricting advertising for junk food oncouncil-owned spaces and on billboards.THE BROKEN PLATE 2021 Food Foundation9
THEME:Make healthier optionsmore affordable METRIC 2: THE AFFORDABILITY OF A HEALTHY DIETWhen we decide what to buy, we’re influenced by what we can afford. Many people in the UK haveinsufficient incomes due to low or precarious wages, as well as high outgoing costs of housingand other essentials. This means that very little money is left over after bills are paid, with the foodbudget often the easiest one to cut. Skipping meals or opting for the cheapest, most filling options –which are often the least healthy – has to suffice. METRIC 3: FOOD PRICESWhat we decide to buy is often influenced by price. Shoppers routinely say price is the mostimportant factor driving their food choices (IGD, 2015). We need to ensure that people aren’tincentivised to buy less healthy food because it is more affordable. We need to rebalance therelative cost of healthy and less healthy foods. METRIC 4: WAGES“ People can make thechoice, but dependingon your income you’renot going to be able tomake those (healthier)choices, so it’s trappingeveryone into makingthe same food choices ”YOUNG FOOD AMBASSADOR10Food Foundation THE BROKEN PLATE 2021Perhaps ironically, the people who work in the food industry are typically on very low wages. Onein seven people had jobs in the food industry before Covid-19 (GOV.UK, 2020), but this sector hasone of the highest rates of low paid jobs, in addition to having been heavily impacted by restrictionsduring the pandemic. Given how important the food industry is for the UK’s economy, the peopleworking in it deserve adequate pay.“And I think even if we have cheaper food compared to the rest ofthe world, it’s not really comparable, in a way because you have tothink about what people can actually afford here.” VEG ADVOCATETHE BROKEN PLATE 2021 Food Foundation11
METRIC02THEMEAffordability of a healthy diet:Ensure that a healthy diet is an affordable dietMAKE HEALTHIER OPTIONSMORE AFFORDABLEAFFORDABILITY OFA HEALTHY DIET The poorest fifth of UK households would need to spend 40% of theirdisposable income on food to meet Eatwell Guide costs. This comparesto just 7% for the richest fifth.Percentage of disposable income* used up ifthe cost of the Eatwell Guide was spent by allhouseholds, by income quintileWHAT DID WE DO?We used data on household income(Households Below Average Income) fromthe Family Resources Survey for 2018/19 tolook at the affordability of the Eatwell Guide,comparing the data to preceding years. This isthe government’s official guidance on a healthydiet and includes those foods consideredessential for a balanced and nutritious diet.The estimated cost of the Eatwell Guide ( 5.99per day) is based on optimisation modellingpreviously commissioned by Public HealthEngland in 2016, with optimisation undertakenin order to minimise deviation from currentdietary patterns (Scarborough et al., 2016).WHAT’S HAPPENING?A stark difference is still apparent between the share of disposableincome that the lowest income groups must spend on a healthy dietcompared to wealthier households. This year we calculate that thepoorest fifth of households would have to spend 40% of their disposableincome to meet the government’s recommended diet, compared to39% in last year’s analysis. Simultaneously, the wealthiest fifth saw theproportion of disposable income which they would have to spend fallfrom 8% according to last year’s analysis to 7% this year – a statisticallysignificant drop. As we have looked at data up until 2019 for this year’sreport, it remains to be seen what impact the pandemic will have –something we will be exploring in next year’s report.We then adjusted this cost based on householdcomposition, as well as economies of scalethat might affect the overall cost of food.The proportion of disposable income (afterhousing costs were removed) that would beused up by the recommended diet was thencalculated, in line with previous methodology(Scott, Sutherland and Taylor, 2018). Datawere analysed by income quintiles, whichprovide a more balanced view than incomedeciles. This is because the lowest income“And I dunno about the rest of you but I’ve got a family and y’knowI don’t have a high income but I moan constantly how much of mysalary goes on food and y’know it’s a massive proportion PersonallyI feel that half of the money I earn goes onto food.” VEG ADVOCATEdecile is made up of a diverse group of people,including some with little or no income as wellas some in less precarious financial situationswho may be between jobs or living on savings.Unfortunately, it is not possible to furthersegregate this group by socio-economic status.People who are homeless, sleeping rough orin institutional settings are not included in theFamily Resources Survey. IS POLICY SUPPORTING PROGRESS?Several existing government schemes seek to makehealthy food more accessible to those living on a lowincome. These include the Healthy Start scheme (BestStart Foods in Scotland), the School Fruit and VegetableScheme (England only), Free School Meals, and theHoliday Activities and Food programme (England only).Despite these measures, the data presented here showthat a healthy diet remains out of reach of many. A majorchallenge is that the cost of a healthy and sustainablediet is not currently accounted for by the governmentwhen setting benefits levels and minimum wage levels.*after housing costs. Source: Secondary analysis of the Family Resources Survey, 2017/18 and 2018/1912Food Foundation THE BROKEN PLATE 2021THE BROKEN PLATE 2021 Food Foundation13
METRIC03THEMEFood prices: Make healthierfoods more affordableMAKE HEALTHIER OPTIONSMORE AFFORDABLEFOOD PRICESMore healthy foods are nearly three times as expensive as less healthyfoods calorie for calorieAverage price of foods per 1,000 calories using the Food Standards Agency’s nutrient profiling score categoryAverage price of foods per 1,000 calories by Eatwell Guide food groupWHAT DID WE DO?The Centre for Diet and ActivityResearch (CEDAR) unit at theUniversity of Cambridge built onfood price research first conductedin 2014 (Jones et al., 2014) andmatched price data for the 79 foodand drink items that have beencontinuously tracked by the Officefor National Statistics’ ConsumerPrice Index (CPI) between 20102021 to food and nutrient data fromPublic Health England’s NationalDiet and Nutrition Survey. Each itemwas then assigned to a food groupand categorised as either ‘morehealthy’ or ‘less healthy’ using thenutrient profiling model developedby the Food Standards Agency(FSA). We also assigned each foodin the CPI basket to one of the fiveEatwell Guide food groups to betterunderstand the relative cost of thedifferent food categories. Usingprice per kilocalorie is a helpful wayto understand the relative pricesof foods which make up diets andmeals, rather than comparingindividual products within specificfood categories.The CPI data for Q2 of 2020 (Aprilto June) included a very highnumber of missing values due tofood products being temporarilyout of stock during the first waveof pandemic, and as a result pricesin the CPI index do not reflect thereality at the time. To deal withthis missing data, basket prices forQ2 across all years analysed wereremoved from this year’s analysis,as doing so did not materially affectannual prices of previous years.WHAT’S HAPPENING?Food price is a major determinant of food choice, with price rises disproportionatelyaffecting lower income groups. The price of more healthy foods continues to remainmuch higher than less healthy foods, with little change in the cost of different foodgroups between 2019 and 2021. The FSA’s nutrient profiling model reveals strikingdifferences, with more healthy foods almost three times more expensive than lesshealthy foods for the equivalent number of calories. The mean cost of more healthyfoods in 2020 per 1,000 kilocalories was 7.00, compared to 2.41 for less heathy foods.Breaking the data down into the government’s five Eatwell Guide food categories tellsa similar story. While the mean price of fruit and vegetables per 1,000 kilocalories was 8.21 in 2020 (rising to 8.60 during the first quarter of 2021), the average price per1,000 kilocalories of food and drinks high in sugar and/or fat was just 3.42 – 40% ofthe cost of more healthy products.Although these data show that the price of fruit and vegetables and other food groupsfell during 2020, the CPI data do not reflect local differences in price. Perhaps moresignificantly, the CPI does not capture all price reductions from promotions. Datafrom the Institute of Fiscal Studies found the share of food transactions on promotiondropped by around 15% between March and May 2020 leading to grocery pricesincreasing by 3%, which is not reflected in the CPI prices (O’Connell and Jaravel, 2020).IS POLICY SUPPORTING PROGRESS?The government has introduced several new policies in recent yearswhich may help to start rebalancing the cost of more healthy vs. lesshealthy foods, though more ambitious action is likely to be needed infuture. In 2018 the government introduced a levy on sugary drinks (24pper litre of drink containing more than 8g of sugar per 100ml, and 18p perlitre of drink containing between 5–8g of sugar per 100ml). In 2020 thegovernment also confirmed that it will be regulating to restrict promotionsof foods high in fat, salt and sugar (HFSS) by volume online and in store –prohibiting HFSS products to be offered as part of ‘buy-one-get-one-free’and ‘3 for 2’ offers, or similar. In 2021 the value of vouchers issued throughthe Healthy Start scheme was increased from 3.10 to 4.25, enablinglow income pregnant women and care-givers of children under 4 to moreeasily afford healthier foods such as fruit, vegetables and pulses.“When I tried to go get a salad, it cost three pounds, which I don’t have, but Ican go McDonald’s and get a burger for a pound which fills me up very well.”Source: CEDAR analysis using Consumer Price Index (CPI) average retail price food indices, 2010–2021 (ONS). Please note all averages are unweighted means.14Food Foundation THE BROKEN PLATE 2021WiththankstoYOUNG FOOD AMBASSADORTHE BROKEN PLATE 2021 Food Foundation15
METRIC04THEMEWages: Pay people working inthe food sector a fair wageMAKE HEALTHIER OPTIONSMORE AFFORDABLEWAGESIn 2020, 25% of workers in the food sector earned the minimum wageor below compared to 11% of workers across the UK.Low paid paid less than 2/3of overall median hourly payMinimum wage or less paid less than age-relevantminimum wage plus 1%Real Living Wage theLondon or Rest of UK rateswere applied, depending onthe location of the worker.Proportion of employees in the UK paid below the real Real Living Wage by industryPlease note: We have used the following codes to extract trend data from the ASHE database: Industry groups (SIC 2007 codes):Agriculture and fishing: 1 excl 1.7; Food retail: 47.2 excl 47.26, 47.11 and 47.81; Food wholesale: 46.3 excl 46.35 and 46.17; Catering(bars and kitchens): 56. Occupation groups (SOC 2010 codes): Kitchen staff: 5434, 5435, 9272 Waiters & waitresses: 9273.A different process had to be used this year in obtaining the data which means there may have been slight differences in someof the cleaning and filtering processes used. Additionally, the ONS regularly revise and update their datasets, which meansthat there are some slight discrepancies between the percentages reported in this year's Broken Plate and last year's report.Source: Resolution Foundation analysis of ONS, Annual Survey of Hours and Earnings, 2012-2020.16Food Foundation THE BROKEN PLATE 2021With thanks toWHAT DID WE DO?Using 2020 data from the AnnualSurvey of Hours and Earnings(ASHE) dataset (ONS, 2020), thelargest survey of employees in theUK, the Resolution Foundationanalysed the pay of people in theUK’s food sector. We looked atthe general picture for the sectoroverall, as well as pay for differentindustries, including agricultureand fishing, waiting staff, food retail,kitchen staff, catering,food manufacturingand food wholesale.This year we followedthe ONS’s approachwith these data, whichis that the numbersinclude furloughedworkers. This means itis quite hard to interpretthe 2020 data; pay datais affected by somefurloughed workers nothaving pay topped up,but also by a greaterproportion of low paidworkers losing theirjobs and thereforedropping out of thedataset. It is therefore difficult toconfidently identify trends as we donot yet know which of those factorsis dominating. As a result, whilehave compared the datafrom 2020 to 2019’s data, we havealso included 2012 data to providesome context in terms of longerterm trends.WHAT’S HAPPENING?With Covid-19 having led to prolonged restrictions for the hospitality industrythroughout 2020, it is perhaps not surprising to see the Out of Home sector’s ‘annushorribilis’ reflected in the data. While the proportion of workers paid the minimum wageor below increased across the UK economy in 2020, the increase was steeper amongfood sector workers. There was an 8 percentage point increase in the proportion offood sector workers paid at or below the minimum wage between 2019 and 2020compared to a 4 percentage point increase for workers across the UK.Research undertaken by the Food Foundation also found that levels of foodinsecurity among workers in the food sector were much higher than the populationaverage during the pandemic, with 14% of food sector workers having experiencedfood insecurity in the six months to January 2020, compared to 9% of the generalpopulation (FoodFoundation, 2021).Although the percentageof those paid belowthe Real Living Wage(a voluntary wage ratethat takes into accountthe cost of living andinflation) remainedbroadly stable in2020, there are largedifferences at an industrylevel. 84% of waitingstaff were paid belowthe Real Living Wage in2020, a figure which hasnot moved much since2012, compared to justunder a quarter (24%)of workers in food wholesale. More companies ought to be encouraged to pay the RealLiving Wage, particularly those industries not so adversely affected by the pandemic– such as food retail. Certainly, data on the proportion of workers defined as low paid(paid less than 2/3 of the median hourly wage) demonstrates the differing impact ofCovid-19 on food workers. While there was a fall in the proportion of low paid workersin food retail in 2020 – continuing the positive downward of the past eight years - andmanufacturing and wholesale remained broadly stable, the same does not appear to betrue for waiting and kitchen staff and those in catering where the numbers defined aslow paid appear to have increased between 2019 and 2020.IS POLICY SUPPORTING PROGRESS?The government’s National Living Wage (for workersover the age of 23) is currently set at 8.91 per hourand the National Minimum Wage (for workers age21 and over) at 8.36 per hour. There is no higherweighting for London. Despite a recent increase,this remains well below the Real Living Wage asc
The Broken Plate is the Food Foundation's flagship report and will form a central pillar of its work on dietary inequality. This . giving a voice to those experiencing dietary inequality as an everyday reality. The government's most recent obesity strategy published in July 2020 included proposals to remove price promotions on foods high .


