Transcription
In Vitro Cell.Dev.Biol.—Animal (2013) 49:785–797DOI 10.1007/s11626-013-9666-5Significant role of μ-calpain (CANP1)in proliferation/survival of bovine skeletalmuscle satellite cellsHoa Van Ba & Hwang InhoReceived: 1 March 2013 / Accepted: 8 July 2013 / Published online: 13 August 2013 / Editor: T. Okamoto# Society for In Vitro Biology 2013. This article is published with open access at Springerlink.comAbstract Calpains are a family of Ca2 -dependent intracellular cysteine proteases, including the ubiquitously expressedμ-calpain (CANP1) and m-calpain (CANP2). The CANP1has been found to play a central role in postmortem proteolysis and meat tenderization. However, the physiological rolesof CANP1 in cattle skeletal satellite cells remain unclear. Inthis study, three small interference RNA sequences (siRNAs)targeting CANP1 gene were designed and ligated into pSilencerplasmid vector to construct shRNA expression constructs. Suppression of CANP1 in satellite cells was evaluated using theseshRNA expressing constructs. Our results revealed that allthree siRNAs could downregulate the expression of CANP1.Suppression of CANP1 significantly reduced cell viability incell proliferation when compared with control cells. We founda crosstalk between CANP1 and caspase systems, particularlysuppression of CANP1 resulted in an increase in the expressionsof apoptotic caspases such as caspase-3, caspase-6, caspase-7,caspase-8, and caspase-9, as well as heat-shock protein (HSP)systems. Additionally, suppression of CANP1 led to theupregulation of other apoptosis and DNA damage-regulatinggenes whilst at the same time downregulating proliferation,migration, and differentiation-regulating genes. The results ofour findings report for the first time that suppression ofCANP1 resulted in the activation of caspase and HSP systemswhich might in turn regulate apoptosis through the caspasedependent cell death pathway. This clearly demonstrates thekey roles of CANP1 in regulation of cell proliferation andsurvival.Electronic supplementary material The online version of this article(doi:10.1007/s11626-013-9666-5) contains supplementary material,which is available to authorized users.H. Van Ba : H. Inho (*)Department of Animal Science and Biotechnology, ChonbukNational University, Jeonju 561-756, Republic of Koreae-mail: hoasaudau 85@yahoo.comKeywords μ-Calpain . Caspases . Heat-shock protein .Knockdown . Satellite cellIntroductionCalpains are a family of Ca2 -dependent intracellular cysteineproteases, including the ubiquitously expressed μ-calpain(CANP1) and m-calpain (CANP2). Both CANP1 and CANP2are heterodimers, consisting of a distinct large 80-kDa catalyticsubunit, encoded by the genes CANP1 and CANP2. Severalstudies on meat muscle tissue have shown that the calpainproteolytic system plays a central role in postmortem proteolysis and tenderization (Huff-Lonergan and Lonergan 2005;Gandolfi et al. 2011). High calpain activity leads to the improvement of meat tenderness (Kent et al. 2004; Kemp et al.2010). However, some studies (using either in vitro or in vivomodels) demonstrated that, among the ubiquitous calpains,CANP1 has the most significant role in postmortem proteolysis and meat tenderization, whereas CANP2 and calpain-3 donot autolyze in postmortem muscle and are therefore notinvolved in postmortem tenderization (Koohmaraie et al.1987; Geesink et al. 2006; Kemp et al. 2010).The physiological function of calpains in living organismssuch as cell lines and animals is still not fully understood, anda lot of controversies exist. Calpain activity is regulated by avariety of factors, including Ca2 , phospholipids, endogenouscalpain-specific inhibitor peptide, and calpastatin (Sorimachiet al. 1997; Goll et al. 2003). It has been reported that calpainsare apparently involved in a multitude of physiological andpathological events. Previous studies using synthetic inhibitors have implicated the role of calpains in various pathological processes (Huang and Wang 2001) and physiologicalprocesses (depending on cell lines and species) such as cellspreading, cell migration and attachment, motility, myoblastfusion, and apoptosis (Huttenlocher et al. 1997; Potter et al.1998; Goll et al. 2003; Dedieu et al. 2004; Honda et al. 2008).
786VAN BA AND INHOSince conventional inhibitors used for the studies of the functions of these enzymes lack specificity, the individual physiological function and biochemical mechanism of these threeisoforms, especially CANP1, are not clear. In contrast, in recentyears, RNA interference (RNAi) mediated by small interferingRNA (siRNA) has been widely used in gene function studies(Xia et al. 2002; Jain et al. 2010). The RNAi method usuallyutilizes short hairpin RNA (shRNA) expressed from plasmidvector. The shRNA expressing construct is integrated into thegenome, becomes a sustainable source of siRNA, and producessustained RNAi effects. Thus, the RNAi strategy, which caninhibit each calpain isoforms specifically, would be a powerfultool to clarify physiological functions. Although a number ofstudies found that CANP1 has a central role in muscle proteolysis and meat tenderization processes, and it also plays somephysiological roles in some cell lines as mentioned above.However, the exact role of CANP1 in cellular processes ofbovine skeletal satellite cells remained unknown till now. Sincecattle are important animals with significant economic value.Understanding the role of particular genes which regulate thegrowth and myogenesis process are extremely important tocontrol the muscle tissue growth in particular. Herein, we usedsiRNAs to generate a specific knockdown of CANP1 at thecellular level. We generated CANP1 knockdown of the satellitecells isolated from Korean native cattle, using pSilencer plasmid vector-mediated siRNAs and provided clear evidence thatCANP1 is mainly involved in proliferation and survival ofbovine skeletal satellite cells.Materials and MethodsCell preparation and culture. The satellite cells were isolatedfrom 24-mo-old Korean native cattle (Hanwoo) following themethod of Dodson et al. (1987). The entire work involving theuse of animals was approved by an Institutional Animal Careand Use Committee. Briefly, the semitendinosus muscle(500 g) was excised from Korean native cattle immediatelyafter slaughter at a commercial abattoir (located in Jeonjuprovince, South Korea). The connective tissue and most ofthe fat were trimmed off and discarded. The muscle was cutinto small fragments (about 3 mm3). After enzymatic digestion with 1% pronase solution (Sigma, St. Louis, MO) at 37 Cfor 60 min, single cells were separated from the fragments byrepeated centrifugation at 1,000 g for 10 min at room temperature. The primary muscle cells were cultured in Dulbecco’smodified Eagle’s medium (DMEM) (Gibco, Grand Island,New York) supplemented with 15% fetal bovine serum(Gibco), 100 IU/ml penicillin, and 100 μg/ml streptomycin(Sigma) in a humidified incubator at 37 C with 5% CO2. Toisolate satellite cells from the primary muscle cells, the cellswere applied to a magnetic cell sorting system (AutoMACS,Milteny Biotech, Bergisch Gladbach, Germany); when the cellsreached 80% confluence, they were collected and re-suspendedin 1 phosphate-buffered saline (PBS, Gibco) supplementedwith 0.5% bovine serum albumin and 2 mM EDTA. Aftercentrifugation (1,500 g for 5 min), the cell pellet was resuspended in 1 PBS (100 μl) containing 10 μg anti-Mcadherin antibodies (DB BioScience, San Diego, CA) and thenincubated with 20 μl of anti-mouse IgG1 micro beads at 4 C for30 min. Finally, cell suspension (107 cells in 2 ml PBS) wasloaded into a magnetic cell sorting system to isolate satellitecells. After sorting, the positive cells were counted using ahemacytometer, and the percentage of satellite cells was determined. Furthermore, to confirm whether the isolated cells arereally myogenic satellite cells, the positive cells were alsocultured in myogenic differentiation medium (DMEM containing 2% horse serum) for 7 d to check the myotube formation.The cells were stained with hematoxylin solution (Sigma) andfinally stained with eosin solution (Muto Pure Chemicals Co,Tokyo Japan).Designing of siRNA and construction of plasmid vector. ThreesiRNA sequences against CANP1 were designed as per thesiRNA designing program (http://www.ambion.com/techlib/misc/siRNA design.html). The siRNAs were converted toshRNAs by using the siRNA target finder program for thepSilencer vector on the web page (http://www.ambion.com/techlib/misc/psilencer converter.html). The three target sequences for constructing pSilencer plasmid vector againstCANP1 were named as CANP1-siRNA1 top: (5′-GAT CCGCTG GAACACCACCCTGTATTTCAA GAGAATACAGGGTGGTGTTCCAGTTTTTTGGAAA-3′) andCANP1-siRNA1 bottom: TACAGGGTGGTGTTCCAGGG-3′); CANP1-siRNA2 top: (5′-GATCCGCTTCAAGTCCCTCTTCAGATTCAA GAGATCTGAAGAGGGACTTGAAGTTTTTTGGAAA-3′) andCANP1-siRNA2 bottom: CTGAAGAGGGACTTGAAGCG-3′); CANP1-siRNA3 top: (5′G AT C C G C A A G G A A G G T G A C T T T G T G T T C A AGAGACACAAAGTCACCTTCCTTGTTTTTTGGAAA-3′), and CANP1-siRNA3 bottom: ACAAAGTCACCTT CCTTGCG-3′). These oligo sequences wereannealed, and the resulting annealed shRNAs were ligatedinto pSilencer hygro vectors by T4 DNA ligase between theBamH I and Hind III restriction sites according to the manufacturer’s instructions. The ligated product (shRNA expression constructs) was transformed into Escherichia coli GCTMcompetent cells (Sigma) following the manufacturer’s protocol. After amplification, the ligated product was isolated usinga GenElute Plasmid Miniprep Kit (Sigma) and then wasdigested by endonuclease BamH I and Hind III restrictionenzymes. The digested product (shRNA and plasmid vectors)
ROLE OF Μ-CALPAIN IN CELL PROLIFERATION/SURVIVALwas visualized by agarose gel electrophoresis and then usedfor the transfection.Transfection of shRNA expression constructs. The isolatedsatellite cells were grown in DMEM in a humidified incubatorat 37 C with 5% CO2. Cells were transfected with eithershRNA expression constructs or pSilencer hygro vector negative control (control) using Lipofectamine 2000TM reagent(Invitrogen, Carslbad, CA) according to the manufacturer’sinstructions. Following the transfection, the cells were incubated for 24 h and then were used to investigate the transfection efficiency, confocal scanning laser microscope (CSLM),and microarray analysis.Cell viability assay. Cell viability was determined by usingCCK-8 colorimetric assay. Briefly, cells were seeded into 96well plates with 100 μl growth medium without antibiotics atdensity of 2 104 cells/well. One day after, the cells weretransfected with either 100 ng of shRNA expression constructsor pSilencer hygro vector negative control as described abovein the present study. Twenty-four hours after transfection, 10 μlof CCK-8 solution was added to each well and incubated for4 h at 37 C in a humidified incubator. The light absorption wasmeasured at 450 nm with a microplate reader (Bio-Rad, Hercules, CA). The cell viability was expressed as a percent ofcontrol culture value.Confocal scanning laser microscope. (CSLM) The cells weretransfected with either CANP1-siRNA expression constructs orpSilencer hygro vector negative control as described above inthe present study. The transfected cells were then stained withcontents of live/dead cytotoxicity kit following the previouslyestablished method (Amna et al. 2013). Finally, the stained cellswere observed under the fluorescence microscope.Real-time polymerase chain reaction. To assay the efficiencyof CANP1 suppression by siRNA transfections and the possibility the siRNAs-induced cell death is regulated by particulargenes, the analyses of CANP1, caspase-3 (CASP3), caspase-7(CASP7), caspase-9 (CASP9), heat-shock protein 27 (HSP27),heat-shock protein 70 (HSP70), and heat-shock protein 90(HSP90) mRNA expression in the shRNA expressionconstructs-transfected cells and control cells were carried outusing real-time polymerase chain reaction (RT-PCR)(CFX96TM Real-Time PCR Detection Systems, Bio-Rad).Twenty-four hours after transfection, total RNA was extractedfrom the satellite cells using a RNA isolation kit, TRIzol(Sigma-Aldrich). cDNA was synthesized from the total RNAusing the reverse transcriptase first-strand cDNA synthesis kitaccording to the manufacturer’s protocols. Primers specific forthe Bos taurus CANP1, CASP3, CASP7, CASP9, HSP27,HSP70, HSP90, and a housekeeping gene glyceraldehyde 3phosphate dehydrogenase (GAPDH) used in this research were787as follows: CANP1 (forward 5′-CCCTCAATGACACCCTCC-3′ and reverse 5′-TCCACCCACTCACCAAACT3′); CASP3 (forward 5′-GTTCATCCAGGCTCTTTG-3′ andreverse 5′-TCTATTGCTACCTTTCG-3′); CASP7 (forward 5′GAATGGGTGTCCGCAACG-3′ and reverse 5′-TTGGCACAAGAGCAGTCGTT-3′); CASP9 (forward 5′-CGCCACCATCTTCTCCCTG-3′ and reverse 5′-CCAACGTCTC C TT C TC C T CC - 3 ′ ); HSP27 (for w ard 5 ′ -ACCATTCCCGTCACCTTCC-3′ and reverse 5′-TCTTTACTTGTTTCCGGCTGTT-3′); HSP70 (forward 5′-CGTGATGACCGCCCTGAT-3′ and reverse 5′-CGGCTGGTTGTCCGAGTA-3′); HSP90 (forward 5′-TTGGCTATCCCATCACTC-3′ and reverse 5′-TTCTATCTCGGGCTTGTC3′); and a housekeeping gene GAPDH (forward 5′-CACCCTCAAGATTGTCAGC-3′ and reverse 5′-TAAGTCCCTCCACGATGC-3′). PCR was performed using 20 μl reaction volumes, containing 10 μl SsoFast TM EvaGreen Supermix (Bio-Rad), 0.5 μl each (10 pmol/μl) of forwardand reverse primers, 1 μl of cDNA (100 ng/μl), and 8 μl ofnuclease-free water. The PCR thermal cycle reaction consistedof initial annealing at 57 C for 2 min, denature at 95 C for3 min, followed by 40 cycles of denaturation and annealing at95 C/10 s and 60 C/10 s, respectively. The relative expressionof transcripts present for the measured genes in the satellitecells was normalized to GAPDH transcripts. Relative ratioswere calculated using the method as discribed by Pfaffl (2001).Preparation of cell lysates and Western blot. After 24 h oftransfection, the transfected cells were harvested, and proteincontent was extracted using CelLyticTMM kit (Sigma)according to the manufacturer’s instructions. The proteinconcentration was determined using Bio-Rad protein assaykit (Bio-Rad). Whole protein (50 μg) of each sample wasseparated on 12.5% acrylamide with 4% acrylamide stackinggels. The proteins from gels were transferred to Hybond-PPVDF membrane (GE Healthcare, Amersham, UK) for60 min at 200 mA. Membranes were blocked in 20 ml ofblocking solution (20 mM Tris–HCl, 137 mM NaCl, 5 mMKCl, and 0.05% Tween 20) for 60 min and then incubated for60 min at room temperature with either CANP1 (1:1,000),CASP9 (1:1,000), HSP27 (1:1,000), HSP90 (1:1,000), oractin (1:1,000) primary antibodies in blocking solution. Subsequently, the bound primary antibodies were then labeledwith alkaline phosphate-conjugated rabbit anti-mouse IgGsecondary antibody in blocking solution for 60 min at roomtemperature. The bound protein-antibodies were visualizedby incubating the membrane with alkaline phosphate–conjugate substrate (Bio-Rad).Microarray analysis. The total RNA was extracted from thetransfected cells for microarray analysis. The synthesis of targetcRNA probes and hybridization were performed using Agilent’sLowInput QuickAmp Labeling Kit (Agilent Technology, Santa
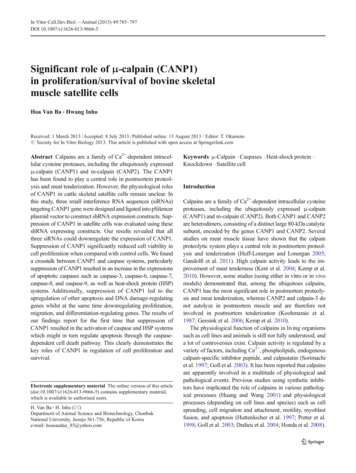
788VAN BA AND INHOClara, CA) according to the manufacturer’s instructions. Thefragmented cRNA was then re-suspended with 2 hybridizationbuffer and directly pipetted onto assembled bovine (V2) geneexpression 4 44K microarray (Agilent Technologies). The hybridization images were analyzed by Agilent DNA microarrayScanner (Agilent Technology), and the data quantification wasperformed using Agilent Feature Extraction software 10.7(Agilent Technology). All data normalization and selection(fold-changed) were performed using GeneSpringGX 7.3.1(Agilent Technology). Reliable genes were filtered by flag,following the Agilent manual. The average of normalized ratiowas calculated by dividing the average of control normalizedsignal intensity by the average of test normalized signal intensity. Functional categorization of gene families over-representedwas performed using the program from the NIAID web atistic analysis. The experiments were performed in triplicates. ANOVA test was applied to test the significance ofdifference in the cell proliferation, mRNA, and protein expression levels between the cells transfected by three different shRNA expression constructs with pSilencer hygro vector negative control (control). All mean values were compared using the Duncan’s multiple-range test at the 5% levelof significance (SAS Institute, Cary, NC, 2007).Figure 1. Agarose gel electrophoresis (1.8%) of colony plasmid DNAand CANP1-siRNAs digested with BamH I and Hind III. M: 100 bp DNAmolecular weight marker; 4,885 bp of plasmid vector; 65 bp of CANP1siRNA1, CANP1-siRNA2, and CANP1-siRNA3 oligonucleotides.ResultsIdentification of satellite cells, cell viability, and CSLMassay. After sorting, the positive cells were counted, and thepercentage of satellite cells was determined to be 12.5%. Thepercentage of fused cells (multinucleated myoplasts) was25 1.5% at day 5 and increased to 30 2.3% at day 7 ofincubation. The positive cells cultured in growth mediumand finally cells from fourth passage were used for the cellviability and CSLM assay. Three separate shRNA expressionconstructs including CANP1-siRNA1, CANP1-siRNA2, andCANP1-siRNA3 were screened for their ability to silenceCANP1gene expression in satellite cells. Following optimizing the transfection conditions for cell number, volume oftransfection agent used, and the appropriate concentration ofeach shRNA expression constructs, the CCK-8 assay wasused to assay the effect of CANP1 knockdown on cell viability in cell proliferation. Figure 3A shows the CCK-8 data ofthree different shRNA expression constructs at 24 h posttransfection. The obtained data clearly showed that all threeCANP1-siRNAs significantly reduced the cell viability. Thecell viability after 24 h transfection was reduced by 42.50%,48.69%, and 63.20% in CANP1-siRNA1, CANP1-siRNA2,and CANP1-siRNA3, respectively, compared with the controlcells. The present results indicate that the effect of CANP1knockdown on the viable cells in cell proliferation varieddepending on each CANP1-siRNA sequences. Additionally,Confirmation of shRNA constructs for RNAi study. The shRNAconsists of a sense strand, a short loop sequence, an antisensestrand, and following four continuous thymines RNA polymerase III terminator. All of the three annealed shRNA template inserts were ligated between the BamH I and Hind IIIsites of the pSilencer plasmid vector. Sixteen hours after thetransformation of the constructs into the E. coli GCTM competent cells, transformed cells produced distinct colonies onLB-agar plate containing ampicillin (50 μg/ml) as selectivemedia. The expected CANP1-siRNAs and plasmid vectordigested with BamH I and Hind III was visualized in 1.8%agarose gel electrophoresis (Fig. 1).Transfection efficiency. In order to get effective siRNA sequences, three shRNA expression constructs were constructed.In this study, we optimized the transfection conditions, and theCANP1 mRNA as well as protein expression levels wereassayed by RT-PCR and Western blot, respectively. Transfection with a plasmid encoding CANP1-siRNAs resulted insignificant downregulation of mRNA and protein levels insatellite cells (Fig. 2). In particular, the relative mRNA expression levels of CANP1 gene in the cells transfected by CANP1siRNA1, CANP1-siRNA2, and CANP1-siRNA3 constructswere reduced by 16.49%, 72.64%, and 85.54%, respectively,when compared with the control cells (Fig. 2A). Also, theprotein level in CANP1-siRNA transfection was significantlylower than that observed in control cells (Fig. 2B and C).
ROLE OF Μ-CALPAIN IN CELL PROLIFERATION/SURVIVAL789Figure 2. Knocking down ofCANP1 in satellite cellsanalyzed at mRNA level andprotein level. The mRNA andprotein expression were assayedby RT-PCR and Western blotrespectively following 24 htransfection. (A) RT-PCR withspecific primers confirmed thatCANP1 was silenced at themRNA level. Value expressed asmean standard error of mean(SEM), calculated from threeindependent experiments. Geneexpression was normalized toGAPDH expression and denotedas a gene/GAPDH ratio.*p 0.05; (B) Showed Westernblot graph; (C) showed relativedensitometric values of Westernblots. Western blot with antiactin antibody was used asloading control.no floating cells were observed in the control (Fig. 3B),whereas a large number of floating cells were seen after theCANP1-siNRAs transfection (Fig. 3C). Furthermore, the morphological changes and cell death by CANP1 knockdown wasstudied using confocal microscopy. The CSLM provides information about cell behavior in a wet environment. In thepresent study, because the CANP1-siRNA3 reduced the cellviability the most, we therefore selected the CANP1-siRNA3transfected cells for the CSLM analysis. One can observe thatno dead cells were found in the cells transfected with pSilencerhygro vector negative control (control) (Fig. 3D). However,dead cells were observed after 24 h CANP1-siRNA3 transfection (Fig. 3E). From the obtained CLSM images, it is clear thatknockdown of CANP1 by specific CANP1-siRNAs causedcell death. The CLSM results are in good agreement with cellviability results by CCK-8 assay (Fig. 3A).Gene expression profile. In order to understand the probablemechanism of cell death (apoptosis) caused by CANP1 suppression, we further studied the expressions of representativerelated genes as well as the genome of the transfected cells. Inparticular, we explored the mRNA expression of several representative apoptotic caspases and HSPs including CASP3,CASP7, CASP9 and HSP27, HSP70, and HSP90 by usingRT-PCR technique. Our results pointed out that the CASP3gene expression increased 1.49-, 1.67-, and 1.71-fold in theCAPN1-siRNA1, CAPN1-siRNA2, and CAPN1-siRNA3-transfected cells, respectively (Fig. 4A) when compared withcontrol. The CASP7 gene expression increased 1.19-, 1.45-, and1.58-fold in the CAPN1-siRNA1, CAPN1-siRNA2, andCAPN1-siRNA3-transfected cells, respectively (Fig. 4A). TheCASP9 gene expression also increased 1.62-, 1.87-, and 2.39fold in the CAPN1-siRNA1, CAPN1-siRNA2, and CAPN1siRNA3-transfected cells, respectively (Fig. 4A). Similarly, theHSP27 gene expression increased 3.75-, 1.90-, and 3.22-foldrelative to control cells in the CAPN1-siRNA1, CAPN1siRNA2, and CAPN1-siRNA3-transfected cells, respectively(Fig. 4B). The HSP70 gene expression increased 1.13-, 1.52-,and 3.27-fold relative to control cells in the CAPN1-siRNA1,CAPN1-siRNA2, and CAPN1-siRNA3-transfected cells, respectively (Fig. 4B). The HSP90 gene expression also increased4.14-, 2.25-, and 3.05-fold relative to control cells in the CAPN1siRNA1, CAPN1-siRNA2, and CAPN1-siRNA3-transfectedcells, respectively (Fig. 4B). Furthermore, we explored the protein expression levels of the representative CASP9, HSP27, andHSP90 genes by Western blot. The results showed that theCASP9, HSP27, and HSP90 protein levels in CAPN1-siRNAstransfected cells significantly increased (Fig. 5).Even though RT-PCR with specific primers confirmedthat CANP1 was silenced at the mRNA level, and CASP3,CASP7, CASP9, HSP27, HSP70, and HSP70 genes wereupregulated in RT-PCR analysis, we were interested todouble-check the expression level of these genes as well asthe genome by using microarray analysis. The microarray
790VAN BA AND INHOFigure 3. Effect of CANP1suppression on satellite cellviability in cell proliferation. (A)The proliferation of cellsfollowing transfections asindicated was assayed by theCCK-8 assay. Data represent themean standard error of mean(SEM) of triplicates, *p 0.05.Representative images oftransfected cells which weretaken by electronic microscopeat 40 magnification, (B)represents the control cells; (C)represents the CANP1-siRNA3transfected cells; (D) representsthe confocal scanning lasermicroscope (CSLM) image ofcontrol cells; (E) represents theCSLM image of CANP1siRNA3-transfected cells. Thecells were stained by DiOC18(3)/PI. Dead cells are labeled byPI and have red nuclei. Live cellsare labeled by DiOC18 (3) andhave green nuclei.technique provides information about genetic regulatory pattern changes of large numbers of genes induced by variousstimuli. As indicated by the present results, the CANP1siRNA3 reduced the cell viability the most. It also showed thehighest silencing capacity; therefore, we chose the CANP1siRNA3-transfected cells for the microarray analysis. Similarly,the results of microarray analysis showed that CAPN1 expression was reduced significantly whereas CASP3, CASP7,CASP9, HSP27, HSP70, and HSP90 mRNA expressionswere increased significantly (Fig. 6). The results of microarrayanalysis were consistent with the results obtained in the RTPCR (Fig. 6).In addition to the aforementioned genes, we also analyzedexpression profiling of genomes of the cells following thetransfections. Interestingly, we observed that 12,809 geneswere upregulated, whereas 14,418 genes were downregulated.On the other hand, we compared the gene expression profilesin CAPN1-siRNA3-transfected cells and control cells. In theFigure 4. CASP3, CASP7, CASP9, HSP27, HSP70, and HSP90mRNA expression levels in satellite cells. The mRNA expressions ofthese genes were assayed by quantitative real-time PCR following 24 htransfection with shRNA expression constructs or control. (A) Showedthe quantitative RT-PCR results of caspase-3, caspase-7, and caspase-9;(B) Showed the quantitative RT-PCR results of HSP27, HSP70, andHSP90. Values expressed as mean standard error of mean (SEM),calculated from three independent experiments. Gene expression wasnormalized to GAPDH expression and denoted as a gene/GAPDH ratio,*p 0.05.
ROLE OF Μ-CALPAIN IN CELL PROLIFERATION/SURVIVAL791Figure 5. Knocking down of CANP1 in satellite cells analyzed atprotein level of representative genes. Cells were transfected withCANP1-siRNA1, CANP1-siRNA2, and CANP1-siRNA3 expressionconstructs or control for 24 h. (A) showed Western blot graph ofCASP9; (B) showed relative densitometric values of CASP9 Westernblot. (C) Showed Western blot graph of HSP27; (D) showed relativedensitometric values of HSP29 Western blot. (E) Showed Western blotgraph of HSP90; (F) showed relative densitometric values of HSP90Western blot. Western blot with anti-actin antibody was used as loadingcontrol.Figure 6. Microarray analysis of CANP1, CASP3, CASP7, CASP9,HSP27, HSP70, and HSP90 gene expressions in satellite cells whichwere transfected with the representative CANP1-siRNA3 for 24 h. Theexpression level of transfected cells was calculated based on the respective control values.scatter plot shown in Fig. 7, the position of each gene on theplot is determined by its expression level in both CAPN1siRNA3-transfected cells (x-axis) and control cells (y-axis).Genes with identical or similar expression are depicted by ablack line whereas the gene clusters around the red line depictsthe 2-fold upregulation. The green solid line demonstratesthe 2-fold downregulation. The red spots at the top of red lineindicate 3-fold upregulation whereas the blue spots at thebottom of green line illustrate 3-fold downregulation, respectively. We identified 437 genes (1.25% of 34,726 genes examined) whose expression level in CAPN1-siRNA3-transfectedcells was 2-fold higher than those of control cells, and150 genes (0.43% of 34,726 genes examined) expression levelwas 2-fold lower than those in control cells.By comparing CAPN1-siRNA3-transfected cells with controlcells, we identified 50 genes that were downregulated at least 3fold after transfected by CAPN1-siRNA3. The downregulatedgenes were grouped according to the biologically functionalcategories, including regulation of cell proliferation (18 genes),muscle cell differentiation (9 genes), positive regulation of
792VAN BA AND INHOapoptosis or cell death program (49 genes), and response toDNA damage stimuli (2 genes) (Table 2).DiscussionFigure 7. Expression profiling of genes in CANP1-siRNA3-transfectedcells and control cells. The gene expression profiles of transfected cells orcontrol were assessed using microarray analysis. Genes present on thebovine gene expression microarray were plotted using a scatter plot. Theposition of each gene on the plot is determined by its expression levels incontrol (x-axis) and CANP1-siRNA-transfected cells (y-axis).multicellular organismal process (11 genes), and cell migration(12 genes) (Table 1). On the other hand, we identified 64 genesthat were significantly upregulated by at least 3-fold following24 h CAPN1-siRNA3 transfection. The upregulated genes werealso grouped according to the biologically functional categories, including defense stress/response (13 genes), regulation ofIn this study, the primary satellite cells were derived directlyfrom semitendinosus muscle of 24-mo-old Korean nativecattle. The in vitro properties exhibited by primary culturesof satellite cells more closely reflect their in vivo propertiesthan those exhibited by transformed cell lines (Allen 1987).Numerous studies have been carried out in which animalswere chosen as key experimental units to develop speciesspecific satellite cell cultures (Greenlee et al. 1995; Burtonet al. 2000). However, all of these satellite cell researchersworry about contaminating cells such as fibroblasts, which getco-isolated with satellite cells during cell isolation regimens.These contaminating cells potentially could overrun the cultures and provide biased measures of cell activity in vitro(Rhoads et al. 2009). However, in the present study, to decreasethe presence of non-myogenic cells in primary cultures, the cellsuspensions were loaded onto a magnetic cell sorting syste
a GenElute Plasmid Miniprep Kit (Sigma) and then was digested by endonuclease BamH I and Hind III restriction enzymes.The digestedproduct (shRNA and plasmid vectors) 786 VAN BA AND INHO. was visualized by agarose gel electrophoresis and then used for the transfection.