Transcription
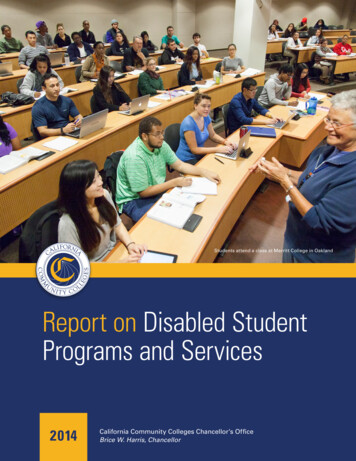
Students attend a class at Merritt College in OaklandReport on Disabled StudentPrograms and Services2014California Community Colleges Chancellor’s OfficeDisabled Student Programs and Services 2014California Community Colleges Chancellor’s OfficeBrice W. Harris, Chancellori
Disabled Student Programs and Services 2014California Community Colleges Chancellor’s Officeiii
WEBSITES:California Community nt Success er.cccco.eduAssociate Degree for Transferadegreewithaguarantee.comPriority Registrationstepforward.cccco.eduWorkforce & Economic Developmentdoingwhatmatters.cccco.eduFinancial Aidicanaffordcollege.comSOCIAL MEDIA:California Community Colleges’ Facebook Pagefacebook.com/CACommCollegesCalifornia Community Colleges’ I Can Afford College Pagefacebook.com/icanaffordcollegeCalifornia Community Colleges’ Twitter Feedtwitter.com/CalCommCollegesWorkforce and Economic Development Twitter Feedtwitter.com/WorkforceVanI Can Afford College Twitter Feedtwitter.com/ICanAfrdCollegeCalifornia Community Colleges’ You Tube Pageyoutube.com/CACommunityCollegesCalifornia Community Colleges’ Instagram Pageinstagram.com/CaliforniaCommunityCollegesI Can Afford College Instagram Pageinstagram.com/icanaffordcollege
Report on Disabled Student Programs and ServicesExecutiveSummaryTABLE OFCONTENTSExecutive Summary.1Methodology.2Key Findings.2Outcome Data.3Conclusion.13Acknowledgments.14The California Community Colleges served more than 2.2 millionstudents in 2011-12 and just shy of 2.1 million students in 2012-13. Itis the largest system of higher education in the nation. All collegesand districts use state funding allocated for Disabled StudentPrograms and Services (DSPS) to assist in providing support servicesand educational accommodations to students with disabilities sothey can have full and equitable access to the community collegeexperience. In addition, most colleges include specialized instructionas part of their DSPS program. Examples of services the collegesprovide to students with disabilities include test proctoring, learningdisability assessment, specialized counseling, interpreter orcaptioning services for hearing-impaired or deaf students, mobilityassistance, notetaker services, reader services, speech services,transcription services, on-campus transportation, specializedtutoring, access to adaptive equipment, job development/placement,registration assistance, special parking and specialized instruction.DSPS served 97,728 students during the 2011-12 academic year and96,735 students during the 2012-13 academic year, continuing atrend down from a high of 124,039 students in 2010-11. The programallocation was slightly more than 69.2 million during each of theseyears, the same funding amount as the two years prior. However,prior to the last four years of flat funding, DSPS sustained a 40percent cut from its highest funding total of 115 million in 200809, resulting in the need to serve students with far fewer resources.Four years of reduced funding led to decreases in staff, coursesand learning disability assessments, and increases in wait time foraccommodations.This report reflects the 2011-12 and 2012-13 academic years andis written in response to Education Code section 67312(b), whichrequires the California Community Colleges Board of Governorsto report every two years to the governor and the education policycommittees of the Legislature, on its system for evaluating “statefunded programs and services for disabled students on eachcampus at least every five years.” Due to budgetary constraints,the Chancellor’s Office suspended its annual coordinated studentservices programmatic site review process, beginning with the2009-10 academic year. The information gathered during these sitevisits comprised a significant portion of the content of past reports.As a result, the Chancellor’s Office is unable to report on three of thefour elements required in statute: staff and student perceptions ofprogram effectiveness, data on the implementation of the program,and physical accessibility requirements of section 794 of title 29 ofthe Federal Rehabilitation Act of 1973. ThisDisabled Student Programs and Services 2014California Community Colleges Chancellor’s Office1
report will focus solely on the analysis of the outcome datareported to the Chancellor’s Office Management Information Systems division by the 112 community collegesas required by Education Code section 67312(a)(4). Thereport does include a campus-by-campus review of theenrollment, retention, transition and graduation rates ofcommunity college students receiving services throughDSPS. This data was collected from all 112 colleges and ispresented in the report in systemwide aggregated summaries. To supplement these summaries, individual campusdata is posted via a web link for interested parties yEducation Code section 67312(b) requires this report toinclude information on student outcome data. The datawas compiled from Chancellor’s Office ManagementInformation Systems annual data reports submitted byall 112 community colleges. Please note that data froma five-year cohort study from the Chancellor’s OfficeManagement Information Systems division was used in thereporting areas of degree and certificate attainment, andtransfer. Additionally, as required by statute, campus-bycampus outcome data can be found on the Chancellor’sOffice website by going to this rvices/DSPS/ResourcesReportsDataForms.aspxKey FindingsThe data compiled for this report show that students withdisabilities served by DSPS are underrepresented in thecollege population, and in comparison to their non-DSPSpeers, they: Take and complete both credit and noncredit courses atgreater rates. Show greater persistence and essentially the sameretention level in most classes. Are more successful at attaining both degrees andcertificates from California community colleges. Are more transfer prepared (a student who hascompleted 60 California State University or Universityof California transferrable units with a 2.00 GPA). However, despite these positive indicators, incomparison to their non-DSPS peers, they also: Participate at higher rates in basic skills classes. Participate at much lower rates in noncredit short-termvocational and workforce preparation classes. Demonstrate much less persistence and retention inbasic skills (10 percent) and workforce preparation(3 percent) classes. Were substantially less likely to be transfer directed(completing transfer-level math and English). Were far less likely to actually transfer to a four-yearinstitution.2Disabled Student Programs and Services 2014California Community Colleges Chancellor’s Office
Outcome dataEnrollment, Retention, Transition andGraduationTOTAL ENROLLMENTFY 2011-12FY 2012-13# of Students% of Population# of Students% of Population97,7284.0%96,7354.4%Non-DSPS Students2,205,47296.0%2,082,37395.6%All Students2,303,200100.00%2,179,108100.00%DSPS StudentsBetween 2011-2012 and 2012-13, the number of studentsin general declined while the number of students withdisabilities increased from 4 to 4.4 percent. However, theyremain underrepresented in the California CommunityColleges student population when compared to UnitedStates census data taken from the 2011 Disability StatusReport, which estimates California’s disability rate for ages21 to 64 to be approximately 8.2 percent. Some Californiacommunity college students with disabilities may notrequest services from DSPS, but this alone is not likely toaccount for the underrepresentation. Both outreach andin-reach efforts have decreased as colleges struggle to servethe current population of identified DSPS students with flatfunding. The total number of DSPS students decreased by 1percent over these two academic years, which may be dueto a reduction in the number of class offerings.ENROLLMENT IN CREDIT CLASSESFY 2011-12FY 2012-13# of Students% of Population# of Students% of Population87,5754.7%86,6865%Non-DSPS Students1,765,97495.3%1,661,15995%All Students1,853,549100.00%1,747,845100.00%DSPS StudentsStudents served by DSPS are represented at slightly higherrates in credit enrollment compared to their representationin the entire student population. While these studentscomprised 4 percent in 2011-12 and 4.4 percent in 2012-13 ofthe total student population in the California CommunityColleges, DSPS students increased from 4.7 to 5 percentof students enrolled in credit classes during these schoolyears.Disabled Student Programs and Services 2014California Community Colleges Chancellor’s Office3
CREDIT FULL-TIME EQUIVALENT STUDENTSFY 2011-12FY 2012-13# of Students% of Population# of Students% of Population60,1135.6%58,6175.8%Non-DSPS Students1,007,03094.4%951,14494.2%All Students1,067,143100.00%1,009,761100.00%DSPS StudentsIn addition, students served by DSPS represented asubstantially higher proportion of credit full-timeequivalent students than their representation in thestudent population. While they represented 4 and 4.4percent of the California Community Colleges studentpopulation in 2011-12 and 2012-13 respectively, theyrepresented 5.6 and 5.8 percent of the credit full-timeequivalent students during those years. This may beaccounted for by the acceptance of financial aid, loans,scholarships and other benefits, which often support partor all of their living expenses and require them to enrollfull time in credit courses. Additionally, some studentswith disabilities are also Department of Rehabilitationconsumers participating in vocational rehabilitation. Thisprogram requires participants to take a full course loadof credit classes unless they cannot do so for a disabilityrelated reason.OVERALL ENROLLMENT IN NONCREDIT CLASSESFY 2011-12FY 2012-13# of Students% of Population# of Students% of Population27,4277.3%26,4297.6%Non-DSPS Students350,25292.7%320,33292.4%All Students377,679100.00%346,761100.00%DSPS StudentsDSPS students were even more overrepresented innoncredit classes than in credit classes compared totheir overall representation in the California CommunityColleges. While they represented 4 and 4.4 percent of theCalifornia Community Colleges student population in 201112 and 2012-13, they represented 7.3 percent of the studentsenrolled in noncredit classes in 2011-12 and increased to7.6 percent in 2012-13. This may be because some studentswith developmental disabilities or acquired brain injuries,as well as senior citizens with age-related disabilities, may4Disabled Student Programs and Services 2014California Community Colleges Chancellor’s Officefind that noncredit courses better meet their educationalneeds. Other DSPS students, including those returningto college after acquiring a disability, such as disabledveterans, may need to review basic skills material and usenoncredit education as a way to enter or re-enter the highereducational system. Also, DSPS students’ enrollment innoncredit classes may be correlated with the large numberof veterans returning to California between 2011 through2013 after serving in Iraq and Afghanistan.
ENROLLMENT IN NONCREDIT BY CATEGORIES OF CLASSES BASIC SKILLSFY 2011-12FY 2012-13# of Students% of Population# of Students% of PopulationDSPS Students18,9877.9%18,8118.4%Non-DSPS Students220,91092.1%205,45991.6%All Students239,897100.00%224,270100.00%SPECIAL CLASSES FOR PERSONS WITH SUBSTANTIAL DISABILITIESFY 2011-12FY 2012-13# of Students% of Population# of Students% of PopulationDSPS Students7,88073.5%7,26270.9%Non-DSPS Students2,84126.5%2,98629.1%All Students10,721100.00%10,248100.00%SHORT TERM VOCATIONALFY 2011-12FY 2012-13# of Students% of Population# of Students% of PopulationDSPS Students1,2642.3%1,1112.3%Non-DSPS Students53,27197.7%47,49297.7%All Students54,535100.00%48,603100.00%Disabled Student Programs and Services 2014California Community Colleges Chancellor’s Office5
WORKFORCE PREPARATIONFY 2011-12FY 2012-13# of Students% of Population# of Students% of Population732.8%683.4%Non-DSPS Students2,51997.2%1,93096.6%All Students2,592100.00%1,998100.00%DSPS StudentsEven given that DSPS students are represented at higherpercentages in noncredit courses at 7.3 and 7.6 percent in2011-12 and 2012-13 respectively than their representationin the general population at 4.0 and 4.4 percent, there arestill disparities in their representation in noncredit basicskills classes, special classes for persons with substantialdisabilities, short term vocational and workforcepreparation classes.DSPS students are overrepresented in noncredit basic skillsclasses at 7.9 percent in 2011-12 and 8.4 percent in 2012-13.This disparity highlights the need to work with the K-12system at teaching elementary and basic skills to specialeducation students as part of the common core standardseffort to better prepare them for post-secondary education.Noncredit special classes for persons with substantialdisabilities are designed to address the needs of DSPSstudents so it is no surprise that they comprise 73.5 and70.9 percent of the students in these classes in 2011-12and 2012-13 respectively. It is surprising, however, thatthere were so many non DSPS students in these classesat 26.5 and 29.1 percent. As a percent of noncredit courseattendance, these courses accounted for 2.8 percent of thetotal noncredit enrollment in 2011-12 and 3 percent in 201213. These low percentages are consistent with the policyemphasis on providing DSPS students education withaccommodations as needed in general education classeswhenever possible.DSPS was only represented at 2.3 percent of noncreditshort-term vocational education during both of these years,and only at 2.8 and 3.4 percent in workforce preparationclasses. This underrepresentation should be addressedto improve the low employment status of people withdisabilities.NONCREDIT FULL-TIME EQUIVALENT STUDENTSFY 2011-12FY 2012-13# of Students% of Population# of Students% of PopulationDSPS Students4,30610.4%3,96210.7%Non-DSPS Students37,03189.6%33,18389.3%All Students41,337100.00%371,45100.00%As a result of their more frequent enrollment in noncreditclasses, DSPS students were a significantly higherpercentage than non-disabled students of noncredit fulltime equivalent students between 2011 and 2013. Whilethey represented 4 and 4.4 percent of the overall studentpopulation, they increased from 10.4 to 10.7 percent of the6Disabled Student Programs and Services 2014California Community Colleges Chancellor’s Officenoncredit full-time equivalent students during this period.The large amount of noncredit full-time equivalent DSPSstudents may be due to most colleges in the CaliforniaCommunity Colleges offering courses for persons withsubstantial disabilities, also known as “special” classes,designed to meet the needs of specific disability groups.
Retention and PersistenceENROLLED FALL 2011 TO SPRING 2012# Enrolled Fall 2011# Retained Spring 2012% Retained82,06267,23781.9%Non-DSPS Students1,570,2851,097,86069.9%All Students1,652,3471,165,09770.5%# Enrolled Fall 2012# Retained Spring 2013% Retained81,38467,32182.7%Non-DSPS Students1,497,1851,055,28370.5%All Students1,578,5691,122,60471.1%DSPS StudentsENROLLED FALL 2012 TO SPRING 2013DSPS StudentsStudents served by DSPS in 2011-12 and 2012-13 were 12and 12.2 percent respectively more likely to retain theirenrollment from fall to spring than other students. Thisdata shows that, given appropriate support services andspecialized counseling, students with disabilities excelat remaining enrolled and persisting in their studies incommunity college throughout the academic year.ENROLLED FALL 2011 TO FALL 2012# Enrolled Fall 2011# Persisted Fall 2012% Persisted82,06251,69063%Non-DSPS Students1,570,285801,70851%All Students1,652,347853,39851.6%DSPS StudentsDisabled Student Programs and Services 2014California Community Colleges Chancellor’s Office7
ENROLLED FALL 2012 TO FALL 2013# Enrolled Fall 2012# Persisted Fall 2013% Persisted81,38450,08961.5%Non-DSPS Students1,497,185736,02349.2%All Students1,578,569786,11249.8%DSPS StudentsDSPS students also persisted from fall to fall at higherrates than non-disabled students. From Fall 2011 to Fall2012 the difference was 12 percent, and from Fall 2012 toFall 2013 the difference was 12.3 percent. As the CaliforniaCommunity Colleges seeks to improve the persistence ofall students it should consider the mix of services that helpsDSPS students persist at such a higher rate than non-DSPSstudents and consider using universal design for learning.in order to provide services effective with DSPS students tothe general California Community Colleges population.COMPLETED VS. ATTEMPTED COURSES# Courses Attempted 2011-12# Courses Completed 2011-12% Completed451,829386,80485.6%Non-DSPS Students8,235,6747,143,26986.7%All Students8,687,5037,530,07386.7%# Courses Attempted 2012-13# Courses Completed2012-13% Completed436,876370,86984.9%Non-DSPS Students7,761,4346,649,01285.7%All Students8,198,3107,019,88185.6%DSPS StudentsDSPS StudentsStudents with disabilities completed the courses theyenrolled in at lower rates than their non-DSPS peers,but the difference decreased from about 1.1 percentin 2011-12 to 0.8 percent in 2012-13. It appears theCalifornia Community Colleges are making progress in8Disabled Student Programs and Services 2014California Community Colleges Chancellor’s Officeaccommodating the chronic and cyclical nature of somedisabilities, which can pose barriers to completing thecourses in which students with disabilities enroll that nonDSPS students do not experience.
RETENTION FOR DEGREE APPLICABLE COURSES: Completed vs. Attempted Degree Applicable Enrollments# Courses Attempted 2011-12# Courses Completed 2011-12% Completed392,578262,32266.8%Non-DSPS Students7,621,4655,223,35668.5%All Students8,014,0435,485,67868.4%# Courses Attempted 2012-13# Courses Completed 2012-13% Completed382,832263,23568.7%Non-DSPS Students7,202,5005,029,79769.8%All Students7,585,3325,293,03269.8%DSPS StudentsDSPS StudentsBoth DSPS students and non-disabled students improvedtheir degree applicable course completion rates between2011-12 and 2012-13, and DSPS students lessened the gapat which they completed the degree applicable coursesfrom 1.7 percent to 1.1 percent lower than did non-DSPSstudents.RETENTION IN BASIC SKILLS COURSES: Attempted vs. Completed Basic Skills Class Enrollments# Courses Attempted 2011-12# Courses Completed 2011-12% Completed51,65221,39941%Non-DSPS Students452,563235,76752%All Students504,215257,16651%# Courses Attempted 2012-13# Courses Completed 2012-13% Completed48,13020,83443%Non-DSPS Students419,045223,31153%All Students467,175244,14552%DSPS StudentsDSPS StudentsThe percentage of basic skills classes completed by bothDSPS students and non-DSPS students increased overthese two years and the gap between these two groups ofstudents narrowed from 11 percent to 10 percent between2011-12 and 2012-13. Special classes designed to teach studyskills to students with disabilities, taken in tandem withbasic skills classes, are increasing in number to address thisneed. Universal design for learning, a method of teachingthat uses techniques originally designed to address theneeds of learning disabled, is being used in basic skillsclasses to increase the success rate of both DSPS and nonDSPS students. Still, there is a significant gap betweenDSPS students and non-DSPS students in completion ofbasic skills classes, which prepare students for college levelcoursework.Disabled Student Programs and Services 2014California Community Colleges Chancellor’s Office9
RETENTION IN WORKFORCE DEVELOPMENT COURSES:Attempted vs. Completed Workforce Development Class Enrollments# Courses Attempted 2011-12# Courses Completed 2011-12% Completed77,16453,84069.8%Non-DSPS Students1,492,3831,085,20972.7%All Students1,569,5471,139,04972.6%# Courses Attempted 2012-13# Courses Completed 2012-13% Completed73,98453,16671.9%Non-DSPS Students1,405,3981,039,97074.0%All Students1,479,3821,093,13673.9%DSPS StudentsDSPS StudentsWhile DSPS students were less successful at completingworkforce development classes than non-DSPS students,the gap narrowed from 3 to 2 percent between 2011-12and 2012-13. The current efforts to improve workforcepreparation through career technical education and theinterdepartmental state government efforts to improvethe employment status of the disabled may have resultedin the increased retention of DSPS students in workforcedevelopment courses.DEGREE AND CERTIFICATE ATTAINMENT: Degree EarnedFY 2011-12FY 2012-13Students5-Year Cohort% CompletedStudents5-Year Cohort% CompletedDSPS Students2,04717,31311.8%2,21618,71311.8%Non-DSPS Students35,429414,6958.5%40,598461,6618.8%All Students37,476432,0088.7%42,814480,3748.9%DEGREE AND CERTIFICATE ATTAINMENT: Credit Certificate AttainedFY 2011-12FY 2012-13Students5-Year Cohort% CompletedStudents5-Year Cohort% CompletedDSPS Students1,26717,3137.3%1,44418,7137.7%Non-DSPS Students16,240414,6953.9%19,289461,6614.2%All Students17,507432,0084%20,733480,3744.3%10Disabled Student Programs and Services 2014California Community Colleges Chancellor’s Office
DEGREE AND CERTIFICATE ATTAINMENT: Noncredit Certificate AttainedFY 2011-12FY 2012-13Students5-Year Cohort% CompletedStudents5-Year Cohort% CompletedDSPS Students1817,3130.1%1618,7130.08%Non-DSPS Students144414,6950.035%200461,6610.04%All Students162432,0080.037%216480,3740.04%Past reports provided information on certificateattainment. This report distinguishes between creditand noncredit certificates. DSPS students were moresuccessful in degree and credit certificate attainmentthan non-disabled students by approximately 3 to 3.5percent in 2011-12 and 2012-13 respectively. In noncreditcertificate attainment DSPS students are twice assuccessful, although these are statistically negligible dueto the small number of noncredit certificates awarded.Nevertheless, these encouraging outcomes speak to theeffectiveness of DSPS programs and services in assistingstudents with disabilities to attain California CommunityColleges degrees and certificates, and demonstrate thatthey possess the motivation and ability to be successful inthe college environment with appropriate supports andaccommodations.TRANSFER PREPARED: Completed 60 CSU or UC Transferable UnitsFY 2011-12FY 2012-13Students5-Year Cohort% CompletedStudents5-Year Cohort% CompletedDSPS Students2,77917,31316.1%3,06018,71316.4%Non-DSPS Students54,582414,69513.2%60,052461,66113.0%All ER PREPARED: Completed Both Transfer Level Math and EnglishFY 2011-12FY 2012-13Students5-Year Cohort% CompletedStudents5-Year Cohort% Completed2,11317,31312.2%2,31918,71312.4%Non-DSPS Students56,544414,69513.6%61,996461,66113.4%All Students58,657432,00813.6%64,315480,37413.4%DSPS StudentsDisabled Student Programs and Services 2014California Community Colleges Chancellor’s Office11
TRANSFERS TO FOUR-YEAR COLLEGESFY 2011-12FY 2012-13Students5-Year Cohort% TransferredStudents5-Year Cohort% S Students101,061414,69524.3%98,307461,66121.3%All Students103,809432,00824.0%100,868480,37421.0%DSPS StudentsCompared to their non-DSPS peers, a higher percentage ofDSPS students completed 60 California State Universityor University of California transferable units, defined astransfer prepared.result, while DSPS students are still less likely to transfer toa four-year institution than their non-DSPS peers, the gaphas narrowed from 8.4 percent in 2011-12 to 7.6 percent in2012-13.However, despite being more transfer prepared, DSPSstudents were less transfer directed than their non-DSPSpeers. In the two reporting years, DSPS students were 1.4and 1.0 percent less likely to have completed transfer levelmath and English, defined as transfer directed, than theirnondisabled peers.However, a discrepancy between populations continuesto exist and suggests a need for further research andintervention. Between 2011-12 and 2012-13, the percentageof the five-year cohort of DSPS students transferring toa four-year college decreased from 15.9 to 13.7, yet manyof today’s high-demand, high-skill occupations require abaccalaureate degree and beyond. Given the significantunemployment and under-employment of persons withdisabilities, the reasons students with disabilities areincreasingly less likely to be transfer directed and actuallytransfer, after being more transfer prepared warrantfurther research and intervention.Transfers for all students climbed a percentage point from2010-11 to 2011-12, and transfer of DSPS students improvedby 1.8 percent. Unfortunately, this positive trend reversedin 2012-13 as transfers for all students dipped 3 percent,and transfers of DSPS students dipped by 2 percent. As a12Disabled Student Programs and Services 2014California Community Colleges Chancellor’s Office
ConclusionThis review of 2011-12 and 2012-13 Chancellor’s Office datashows, in approximate numbers, that in comparison tonon-DSPS students, DSPS students: Are underrepresented compared to the percentageof adults with disabilities between ages 21-64 in thegeneral population. Take both credit and noncredit courses at greater rates. Earn both credit and noncredit college FTES at asubstantially higher and increasing percentage. Show much greater retention and persistence andessentially the same course completion rate. Are more likely to earn their degrees and certificates. Are more transfer prepared.The report also sheds light on areas that warrantfurther research and intervention where in approximatecomparison to non-DSPS students, DSPS students: Are less successful in completing workforcedevelopment programs. Are less successful in completing basic skills classes. Are less likely to be transfer directed. Are less likely to transfer to a four-year institution.In order to adequately address these under-representationsand transfer issues, additional resources may be needed.Such an investment is consistent with the Legislatureand Chancellor’s Office emphasis on student success,particularly since these data show that DSPS students cansucceed. They earn certificates and degrees at higher ratesand, in most other outcome measures, perform at least aswell, and often better than non-DSPS students.This report provides a point in time review of DSPS studentsuccess data that highlight some of the many program,policy, and fiscal challenges facing DSPS programs asthey serve increasing numbers of students with fundingthat had not changed from the 40 percent cuts of 200910. By facilitating peer support, and providing technicalassistance, training and specialized consultation andsupport through targeted grants, the Chancellor’s Officecontinues to assist colleges in making progress withmeeting the needs of their students with disabilities.Disabled Student Programs and Services 2014California Community Colleges Chancellor’s Office13
AcknowledgmentsThe California Community Colleges Chancellor’s Office would like to acknowledge andthank those individuals who have made significant contributions to this reportErik SkinnerDeputy ChancellorS T U D E N T S E RV I C E S & S PE C I A L P R O G R A M S D I V I S I O NLinda MichalowskiVice Chancellor, Student Services and Special ProgramsJeff SpanoDean, Student ServicesScott BerensonDSPS Program SpecialistScott ValverdeCommunity Colleges Program SpecialistMichelle EllenbergerStaff Services AnalystRuby NietoSpecialist, Financial Aid, AllocationsT E C H N O LO GY, R E S E A R C H , & I N F O R M AT I O N SYS T E M S D I V I S I O NTodd HoigSpecialist, Information SystemsVinod VermaSystem Software Specialist IIC O M M U N I C AT I O N S D I V I S I O NPaul FeistVice Chancellor, Communications14Disabled Student Programs and Services 2014California Community Colleges Chancellor’s Office
California Community Colleges Chancellor’s Office1102 Q Street, Sacramento, CA 95811www.cccco.edu CORML#30 and#31
California Community Colleges Chancellor's Office Brice W. Harris, Chancellor Students attend a class at Merritt College in Oakland 2014. Disabled Student Programs and Services 2014 iii . Financial Aid icanaffordcollege.com SOCIAL MEDIA: California Community Colleges' Facebook Page
