Transcription
OIC ACCREDITATION CERTIFICATION PROGRAMME FOR OFFICIAL STATISTICSCorrelation andRegression AnalysisTEXTBOOKORGANISATION OF ISLAMIC COOPERATIONSTATISTICAL ECONOMIC AND SOCIAL RESEARCHAND TRAINING CENTRE FOR ISLAMIC COUNTRIES
OIC ACCREDITATION CERTIFICATION PROGRAMME FOR OFFICIAL STATISTICSCorrelation and Regression AnalysisTEXTBOOK{{Dr. Mohamed Ahmed Zaid}}ORGANISATION OF ISLAMIC COOPERATIONSTATISTICAL ECONOMIC AND SOCIAL RESEARCHAND TRAINING CENTRE FOR ISLAMIC COUNTRIES
2015 The Statistical, Economic and Social Research and Training Centre for Islamic Countries (SESRIC)Kudüs Cad. No: 9, Diplomatik Site, 06450 Oran, Ankara – TurkeyTelephone 90 – 312 – 468 orgThe material presented in this publication is copyrighted. The authors give the permission to view, copydownload, and print the material presented that these materials are not going to be reused, on whatsoevercondition, for commercial purposes. For permission to reproduce or reprint any part ofthis publication,please send a request with complete information to the Publication Department of SESRIC.All queries on rights and licenses should be addressed to the Statistics Department, SESRIC, at theaforementioned address.DISCLAIMER: Any views or opinions presented in this document are solely those of the author(s) and donot reflect the views of SESRIC.ISBN: xxx-xxx-xxxx-xx-xCover design by Publication Department, SESRIC.For additional information, contact Statistics Department, SESRIC.i
CONTENTSAcronyms . iiiAcknowledgement . ivUNIT 1. Introduction . 11.1. Preface . 11.2. What Are correlation and regression? . 11.3. Assumptions of parametric and non parametric Statistics . 21.4. Test of Significance . 3UNIT 2. Correlation Analysis . 42.1. Definition . 42.2. Assumption of Correlation . 52.3. Bivariate Correlation . 52.4. Partial Correlation . 72.5. Correlation Coefficients: Pearson, Kendall, Spearman . 82.6. Exercises . 12UNIT 3. Regression Analysis . 133.1. Definition . 133.2. Objectives of Regression Analysis . 133.3. Assumption of Regression Analysis . 143.4. Simple Regression Model . 143.5. Multiple Regressions Model . 173.6. Exercises . 21UNIT 4. Applied Example using Statistics package .224.1. Preface . 224.2. Bivariate Correlation . 244.3. Partial Correlation . 264.4. Linear Regression Model . 264.5. Stepwise Analysis Methods . 284.6. Exercises . 30ii
ACRONYMS𝑟Pearson Coefficient of Correlation𝜏Kendall's Tau Coefficient of Correlation𝜌Spearman Coefficient of CorrelationR2Coefficient of DeterminationSignificance LevelP valueCalculated Significance value ( probability value)SPSSStatistical Package for Social Science OR Statistical Product for Solutions ServicesCAPMASCentral Agency of Public Mobilization and Statistics (Statistic office of Egypt)iii
ACKNOWLEDGEMENTPrepared jointly by the Central Agency of Public Mobilization and Statistics (CAPMAS) inCairo, Egypt and the Statistical, Economic and Social Research and Training Centre for IslamicCountries (SESRIC) under the OIC Accreditation and Certification Programme for OfficialStatisticians (OIC-CPOS) supported by Islamic Development Bank Group (IDB), this textbookon Correlation and Regression Analysis covers a variety topics of how to investigate the strength, direction and effect of a relationship between variables by collecting measurements and usingappropriate statistical analysis. Also this textbook intends to practice data of labor force surveyyear 2015, second quarter (April, May, June), in Egypt by identifying how to apply correlationand regression statistical data analysis techniques to investigate the variables affectingphenomenon of employment and unemployment.iv
UNIT 1INTRODUCTION1.1. PrefaceThe goal of statistical data analysis is to understand a complex, real-world phenomenonfrom partial and uncertain observations. It is important to make the distinction between themathematical theory underlying statistical data analysis, and the decisions made after conductingan analysis. Where there is a subjective part in the way statistical analysis yields actual humandecisions. Understanding the risk and the uncertainty behind statistical results is critical in thedecision-making process.In this textbook, we will study the relation and association between phenomena through thecorrelation and regression statistical data analysis, covering in particular how to makeappropriate decisions throughout applying statistical data analysis.In regards to technical cooperation and capacity building, this textbook intends to practicedata of labor force survey year 2015, second quarter (April, May, June), in Egypt by identifyinghow to apply correlation and regression statistical data analysis techniques to investigate thevariables affecting phenomenon of employment and unemployment.There are many terms that need introduction before we get started with the recipes. Thesenotions allow us to classify statistical techniques within multiple axes.Prediction consists of learning from data, and predicting the outcomes of a random processbased on a limited number of observations, the term "predictor" can be misleading if it isinterpreted as the ability to predict even beyond the limits of the data. Also, the term"explanatory variable" might give an impression of a causal effect in a situation in whichinferences should be limited to identifying associations. The terms "independent" and"dependent" variable are less subject to these interpretations as they do not strongly imply causeand effectObservations are independent realizations of the same random process; each observation ismade of one or several variables. Mainly variables are either numbers, or elements belonging toa finite set "finite number of values". The first step in an analysis is to understand what yourobservations and variables are.Study is univariate if you have one variable. It is Bivariate if there are two variables andmultivariate if at least two variables. Univariate methods are typically simpler. That being said,univariate methods may be used on multivariate data, using one dimension at a time. Althoughinteractions between variables cannot be explored in that case, it is often an interesting firstapproach.1.2. What Are correlation and regressionCorrelation quantifies the degree and direction to which two variables are related.Correlation does not fit a line through the data points. But simply is computing a correlationcoefficient that tells how much one variable tends to change when the other one does. When r is0.0, there is no relationship. When r is positive, there is a trend that one variable goes up as the1
other one goes up. When r is negative, there is a trend that one variable goes up as the other onegoes down.With correlation, it doesn't have to think about cause and effect. It doesn't matter which ofthe two variables is call dependent and which is call independent, if the two variables swappedthe degree of correlation coefficient will be the same.The sign ( , -) of the correlation coefficient indicates the direction of the association. Themagnitude of the correlation coefficient indicates the strength of the association, e.g. Acorrelation of r - 0.8 suggests a strong, negative association (reverse trend) between twovariables, whereas a correlation of r 0.4 suggest a weak, positive association. A correlationclose to zero suggests no linear association between two continuous variables.Linear regression finds the best line that predicts dependent variable from independentvariable. The decision of which variable calls dependent and which calls independent is animportant matter in regression, as it'll get a different best-fit line if you swap the two. The linethat best predicts independent variable from dependent variable is not the same as the line thatpredicts dependent variable from independent variable in spite of both those lines have the samevalue for R2. Linear regression quantifies goodness of fit with R2, if the same data put intocorrelation matrix the square of r degree from correlation will equal R2 degree from regression.The sign ( , -) of the regression coefficient indicates the direction of the effect of independentvariable(s) into dependent variable, where the degree of the regression coefficient indicates theeffect of the each independent variable into dependent variable.1.3. Assumptions of parametric and non parametric StatisticsParametric statistics are the most common type of inferential statistics, which are calculatedwith the purpose of generalizing the findings of a sample to the population it represents.Parametric tests make assumptions about the parameters of a population, whereas nonparametrictests do not include such assumptions or include fewer. For instance, parametric tests assumethat the sample has been randomly selected from the population it represents and that thedistribution of data in the population has a known underlying distribution. The most commondistribution assumption is that the distribution is normal. Other distributions include thebinomial distribution (logistic regression) and the Poisson distribution (Poisson regression), andnon-parametric tests are sometimes called "distribution-free" tests. Additionally, parametricstatistics require that the data are measured using an interval or ratio scale, whereasnonparametric statistics use data that are measured with a nominal or ordinal scale. There arethree types of commonly used nonparametric correlation coefficients (Spearman R, Kendall Tau,and Gamma coefficients), where parametric correlation coefficients (Pearson)It’s commonly thought that the need to choose between a parametric and nonparametric testoccurs when your data fail to meet an assumption of the parametric test. This can be the casewhen you have both a small sample size and non normal data. The decision often depends onwhether the mean or median more accurately represents the center of your data’s distribution. If the mean accurately represents the center of your distribution and your sample size islarge enough, consider a parametric test because they are more powerful.If the median better represents the center of your distribution, consider the nonparametrictest even when you have a large sample.2
In general, parametric methods make more assumptions than non-parametric methods. If thoseextra assumptions are correct, parametric methods can produce more accurate and preciseestimates. They are said to have more statistical power. However, if assumptions are incorrect,parametric methods can be very misleading for that reason they are often not considered robust.On the other hand, parametric formulae are often simpler to write down and faster to compute.In some cases, but not all, their simplicity makes up for their non-robustness, especially if care istaken to examine diagnostic statistics.1.4. Test of Significance levelIn linguistic, "significant" means important, while in Statistics "significant" means probablytrue (not due to chance). A research finding may be true without being important. Whenstatisticians say a result is "highly significant" they mean it is very probably true. They do not(necessarily) mean it is highly important.Significance levels show you how likely a pattern in your data is due to chance. The mostcommon level, used to mean something is good enough to be believed, is "0.95". This meansthat the finding has a 95% chance of being true which also means that the finding has aconfidence degree 95% of being true. No statistical package will show you "95%" or ".95" toindicate this level. Instead it will show you ".05," meaning that the finding has a five percent(.05) chance of not being true "error", which is the converse of a 95% chance of being true. Tofind the significance level, subtract the number shown from one. For example, a value of ".01"means that there is a confidence degree 99% (1-.01 .99) chance of it being true.In other words the significance level"alpha level" for a given hypothesis test is a valuefor which a P-value "calculated value" less than or equal tois considered statisticallysignificant. Typical value levels forare 0.1, 0.05, and 0.01. These value levels correspond tothe probability of observing such an extreme value by chance. For example, if the P-value is0.0082, so the probability of observing such a value by chance is less that 0.01, and the result issignificant at the 0.01 level.3
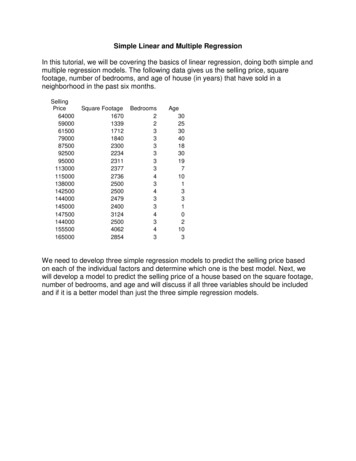
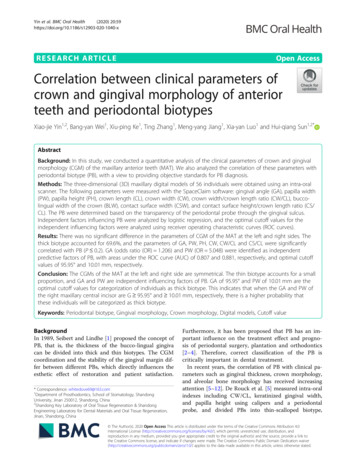
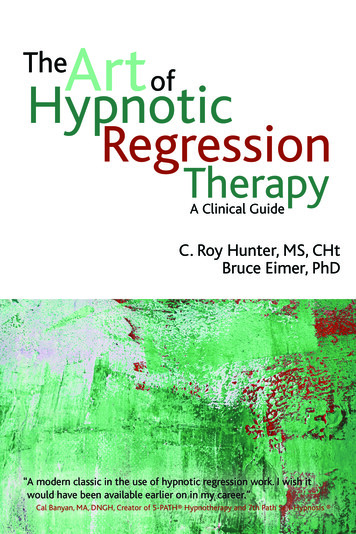
UNIT 2Correlation Analysis2.1. DefinitionCorrelation is a statistical measure that indicates the extent to which two or more variablesfluctuate together. A positive correlation indicates the extent to which those variables increase ordecrease in parallel; a negative correlation indicates the extent to which one variable increases asthe other decreases.When the fluctuation of one variable reliably predicts a similar fluctuation in anothervariable, there’s often a tendency to think that means that the change in one causes the change inthe other. However, correlation does not imply causation. There may be an unknown factor thatinfluences both variables similarly.Correlation is a statistical technique that can show whether and how strongly pairs ofvariables are related. Although this correlation is fairly obvious your data may containunsuspected correlations. You may also suspect there are correlations, but don't know which arethe strongest. An intelligent correlation analysis can lead to a greater understanding of your data. Correlation is Positive or direct when the values increase together, andCorrelation is Negative when one value decreases as the other increases, and so calledinverse or contrary correlation.abcdeIf the points plotted were all on a straight line we would have perfect correlation, but it could bepositive or negative as shown in the diagrams above,a. Strong positive correlation between x and y. The points lie close to a straight line with yincreasing as x increases.b. Weak, positive correlation between x and y. The trend shown is that y increases as xincreases but the points are not close to a straight linec. No correlation between x and y; the points are distributed randomly on the graph.d. Weak, negative correlation between x and y. The trend shown is that y decreases as xincreases but the points do not lie close to a straight linee. Strong, negative correlation. The points lie close to a straight line, with y decreasing as xincreasesCorrelation can have a value:3. 1 is a perfect positive correlation4. 0 is no correlation (the values don't seem linked at all)5. -1 is a perfect negative correlation4
The value shows how good the correlation is (not how steep the line is), and if it is positiveor negative. Usually, in statistics, there are three types of correlations: Pearson correlation,Kendall rank correlation and Spearman correlation.2.2. Assumption of CorrelationEmploying of correlation rely on some underlying assumptions. The variables are assumedto be independent, assume that they have been randomly selected from the population; the twovariables are normal distribution; association of data is homoscedastic (homogeneous),homoscedastic data have the same standard deviation in different groups where data areheteroscedastic have different standard deviations in different groups and assumes that therelationship between the two variables is linear. The correlation coefficient is not satisfactoryand difficult to interpret the associations between the variables in case if data have outliers.An inspection of a scatterplot can give an impression of whether two variables are relatedand the direction of their relationship. But it alone is not sufficient to determine whether there isan association between two variables. The relationship depicted in the scatterplot needs to bedescribed qualitatively. Descriptive statistics that express the degree of relation between twovariables are called correlation coefficients. A commonly employed correlation coefficient arePearson correlation, Kendall rank correlation and Spearman correlation.Correlation used to examine the presence of a linear relationship between two variablesproviding certain assumptions about the data are satisfied. The results of the analysis, however,need to be interpreted with care, particularly when looking for a causal relationship.2.3. Bivariate CorrelationBivariate correlation is a measure of the relationship between the two variables; it measuresthe strength and direction of their relationship, the strength can range from absolute value 1 to 0.The stronger the relationship, the closer the value is to 1. Direction of The relationship can bepositive (direct) or negative (inverse or contrary); correlation generally describes the effect thattwo or more phenomena occur together and therefore they are linked For example, the positiverelationship of .71 can represent positive correlation between the statistics degrees and thescience degrees. The student who has high degree in statistics has also high degree in scienceand vice versa.The Pearson correlation coefficient is given by the following equation:𝑟 Where𝑥̅ 𝑛𝑖 1(𝑥𝑖 𝑥̅ )(𝑦𝑖 𝑦̅) 𝑛𝑖 1(𝑥𝑖 𝑥̅ )2 𝑛𝑖 1(𝑦𝑖 𝑦̅ )2is the mean of variable𝑥values, and𝑦̅is the mean of variable𝑦values.Example – Correlation of statistics and science testsA study is conducted involving 10 students to investigate the association between statisticsand science tests. The question arises here; is there a relationship between the degrees gained bythe 10 students in statistics and science tests?5
Table (2.1) Student degree in Statistic and 112423Notes: the marks out of 30Suppose that (x) denotes for statistics degrees and (y)61216711128202191722for science degree( x , y) ;Calculating the meanxyx 173 17.3 , y 200 20n 10n10Where the mean of statistics degreesx 17.3 and the mean of science degrees y 20Table (2.2) Calculating the equation parametersStatisticsSciencexyx x(x 228y y ( y y ) 2 ( x x )( y y) ( x x ) 2 356.1 , ( y y) 2 252 ( x x )( y y ) 228,Calculating the Pearson correlation coefficient;r ( x x )( y y ) 22 (x x) ( y y)228(18.8706)(15.8745)6 228356.1 252228 0.761299.5614101826
Other solutionAlso; the Pearson correlation coefficient is given by the following equation: xy 𝑟 ( 𝑥 2 x yn2( 𝑥)22 ( 𝑦) ))( 𝑦𝑛𝑛Table (2.3) Calculating the equation 512129246968415761423322196529 x 173 , y 2001216192144256 xy 324676173200368833494252Required calculation x 2 3349 y 2 4252Calculating the Pearson correlation coefficient by substitute in the aforementioned ���𝟐𝟖𝟏𝟎𝒓 𝟎. 𝟕𝟔𝟏𝟐𝟐(𝟑𝟓𝟔. 𝟏)(𝟐𝟓𝟐) 𝟐𝟗𝟗. 𝟓𝟔𝟏𝟒(𝟏𝟕𝟑)(𝟐𝟎𝟎) (𝟑𝟑𝟒𝟗 𝒏𝟏𝟎 ) (𝟒𝟐𝟓𝟐 𝟏𝟎𝒏 )𝟑𝟔𝟖𝟖 Pearson Correlation coefficientr 0.761 exactly the same output of the first equation.The calculation shows a strong positive correlation (0.761) between the student's statisticsand science degrees. This means that as degrees of statistics increases the degrees of scienceincrease also. Generally the student who has a high degree in statistics has high degree inscience and vice versa.2.4. Partial CorrelationThe Partial Correlations procedure computes partial correlation coefficients that describe thelinear relationship between two variables while controlling for the effects of one or more7
additional variables. Correlations are measures of linear association. Two variables can beperfectly related, but if the relationship is not linear, a correlation coefficient is not anappropriate statistic for measuring their association.Partial correlation is the correlation between two variables after removing the effect of oneor more additional variables. Suppose we want to find the correlation between y and xcontrolling by W . This is called the partial correlation and its symbol is rYX .W . Thiscommand is specifically for the case of one additional variable. In this case, the partialcorrelation can be computed based on standard correlations between the three variables asfollows:rYX .W rYX .WrXY rXW rYW22(1 rXW)(1 rYW)Stands for the correlation between x and y controlling by W .As with the standard correlation coefficient, a value of 1 indicates a perfect positive linearrelationship, a value of -1 indicates a perfect negative linear relationship, and a value of 0indicates no linear relationship. For more information see unit 4 of this book.2.5. Correlation Coefficients Pearson, Kendall and SpearmanCorrelation is a Bivariate analysis that measures the strengths of association between twovariables. In statistics, the value of the correlation coefficient varies between 1 and -1. Whenthe value of the correlation coefficient lies around 1, then it is said to be a perfect degree ofassociation between the two variables. As the correlation coefficient value goes towards 0, therelationship between the two variables will be weaker. Usually, in statistics, we measure threetypes of correlations: Pearson correlation, Kendall rank correlation and Spearman correlation.Pearson 𝑟 correlation: Pearson correlation is widely used in statistics to measure thedegree of the relationship between linear related variables. For example, in the stock market, ifwe want to measure how two commodities are related to each other, Pearson correlation is usedto measure the degree of relationship between the two commodities. The following formula isused to calculate the Pearson correlation coefficient𝑟 𝑟: See Example 𝑛𝑖 1(𝑥𝑖 𝑥̅ )(𝑦𝑖 𝑦̅) 𝑛𝑖 1(𝑥𝑖 𝑥̅ )2 𝑛𝑖 1(𝑦𝑖 𝑦̅ )28
Kendall's Tau rank correlation: Kendall rank correlation is a non-parametric test thatmeasures the strength of dependence between two variables. If we consider two samples, x andy , where each sample size is n, we know that the total number of pairings with x y is n (n1)/2.The following formula is used to calculate the value of Kendall rank correlation:𝜏 Where:𝑛𝑐 𝑛𝑑12 𝑛(𝑛 1)𝜏 Kendall rank correlation coefficient𝑛𝑐 number of concordant (Ordered in the same way).𝑛𝑑 Number of discordant (Ordered differently).Kendall’s Tau Basic ConceptsDefinition 1: Let x1, , xn be a sample for random variable x and let y1, , yn be a sample forrandom variable y of the same size n. There are C(n, 2) possible ways of selecting distinct pairs(xi, yi) and (xj, yj). For any such assignment of pairs, define each pair as concordant, discordantor neither as follows: Concordant if (xi xj and yi yj) or (xi xj and yi yj)Discordant (D) if (xi xj and yi yj) or (xi xj and yi yj)Neither if xi xj or yi yj (i.e. ties are not counted).Observation: To facilitate the calculation of C – D it is best to first put all the x data elements inascending order. If x and y are perfectly positively correlated, then all the values of y would bein ascending order too, and so if there are no ties then C C (n, 2) and τ 1.Otherwise, there will be some inversions. For each i, count the number of j i for which xj xi.This sum is D. If x and y are perfectly negatively correlated, then all the values of y would be indescending order, and so if there are no ties then D C (n, 2) and τ -1.An example of calculating Kendall's Tau correlationTo calculate a Kendall's Tau correlation coefficient on same data without any ties we use thefollowing 1423961216711128202191722101826
Table (2.4) Set rank to the 6122122264210178936572103489651Arranged RankRankRank(science) (statistics)1234567891052176348910Continued Table (2.4) Calculating the Number of Concordant C and Discordant 8CCCCCCC-89CCCCCCCC-910CCCCCCCCC1234567891035Total of (D) and ( C )-10Then substitute into the main equation𝑛𝑐 𝑛𝑑𝜏 12 𝑛(𝑛 1)𝜏 𝜏 25 0.5564535 1012 10(10 1)Kendall's Tau coefficient 𝜏 0.556; this indicates a moderate positive relationship between theranks individuals obtained in the statistics and science exam. This means the higher you rankedin statistics, the higher you ranked in science also, and vice versa.Calculating Kendall's Tau manually can be very tedious without a computer and is rarely donewithout a computer. Large dataset make it almost impossible to do manually by hand. . For moreinformation see unit4 in this book10
Spearman rank correlation: Spearman rank correlation is a non-parametric test that isused to measure the degree of association between two variables. It was developed bySpearman, thus it is called the Spearman rank correlation. Spearman rank correlation test doesnot assume any assumptions about the distribution of the data and is the appropriate correlationanalysis when the variables are measured on a scale that is at least ordinal.The following formula is used to calculate the Spearman rank correlation coefficient:6 𝑑𝑖2𝜌 1 𝑛 ( 𝑛 2 1)Where:𝜌 Spearman rank correlation coefficientdi the difference between the ranks of corresponding values Xi and Yin number of value in each data set.The Spearman correlation coefficient,𝜌, can take values from 1 to -1. A 𝜌 of 1 indicatesa perfect association of ranks, a 𝜌 of zero indicates no association between ranks and aindicates a perfect negative association of ranks. The closerassociation between the ranks.𝜌𝜌 of -1to zero, the weaker theAn example of calculating Spearman's correlationTo calculate a Spearman rank-order correlation coefficient on data without any ties use thefollowing 718Science20251124231612212226Table (2.5) Calculating the Parameters of Spearman rank tistics)Rank(science) d 6572103489651300230031490049009116Where d absolute difference between ranks and d2 difference squared.Then calculate the following: 𝑑𝑖2 9 0 0 4 9 0 0 9 1 16 4811
Then substitute into the main equation as follows:6 𝑑𝑖2𝜌 1 𝑛 ( 𝑛 2 1)288𝜌 1 9906 48;𝜌 1 ;𝜌 1 0.290910(102 1)𝜌 0.71Hence, we have a 0.71; this indicates a strong positive relationship between the ranksindividuals obtained in the statistics and science exam. This means the higher you ranked instatistics, the higher you ranked in science also, and vice versa.So; the Pearson r correlation coefficient 0.761 and Spearman's correlation 0.71 for thesame data which means that correlation coefficients for both techniques are approximatelyequal. For more information see unit4 in this book2.6 ExercisesStudy is conducted involving 14 infants to investigate the association between gestationalage at birth, measured in weeks, and birth weight, measured in grams.Table (2.6) Gestational age and their Weight at birth1234567891011121314Infant No.Gestational34.73629.3 40.1 35.7 42.4 40.3 37.3 40.9 38.3 38.5 41.4 39.7 39.7ageBirth1895 2030 1440 2835 3090 3827 3260 2690 3285 2920 3430 3657 3685 3345WeightApplying the proper method; Estimate the association betw
mathematical theory underlying statistical data analysis, and the decisions made after conducting an analysis. Where there is a subjective part in the way statistical analysis yields actual human decisions. Understanding the risk and the uncertainty behind statis