Transcription
iIBM SPSS Statistics 21 Core SystemUser’s Guide
Note: Before using this information and the product it supports, read the general informationunder Notices on p. 424.This edition applies to IBM SPSS Statistics 21 and to all subsequent releases and modificationsuntil otherwise indicated in new editions.Adobe product screenshot(s) reprinted with permission from Adobe Systems Incorporated.Microsoft product screenshot(s) reprinted with permission from Microsoft Corporation.Licensed Materials - Property of IBM Copyright IBM Corporation 1989, 2012.U.S. Government Users Restricted Rights - Use, duplication or disclosure restricted by GSA ADPSchedule Contract with IBM Corp.
PrefaceIBM SPSS StatisticsIBM SPSS Statistics is a comprehensive system for analyzing data. SPSS Statistics can takedata from almost any type of file and use them to generate tabulated reports, charts and plots ofdistributions and trends, descriptive statistics, and complex statistical analyses.This manual, the IBM SPSS Statistics 21 Core System User’s Guide, documents the graphicaluser interface of SPSS Statistics. Examples using the statistical procedures found in add-onoptions are provided in the Help system, installed with the software.In addition, beneath the menus and dialog boxes, SPSS Statistics uses a command language.Some extended features of the system can be accessed only via command syntax. (Those featuresare not available in the Student Version.) Detailed command syntax reference information isavailable in two forms: integrated into the overall Help system and as a separate document in PDFform in the Command Syntax Reference, also available from the Help menu.IBM SPSS Statistics OptionsThe following options are available as add-on enhancements to the full (not Student Version)IBM SPSS Statistics Core system:Statistics Base gives you a wide range of statistical procedures for basic analyses and reports,including counts, crosstabs and descriptive statistics, OLAP Cubes and codebook reports. It alsoprovides a wide variety of dimension reduction, classification and segmentation techniques suchas factor analysis, cluster analysis, nearest neighbor analysis and discriminant function analysis.Additionally, SPSS Statistics Base offers a broad range of algorithms for comparing means andpredictive techniques such as t-test, analysis of variance, linear regression and ordinal regression.Advanced Statistics focuses on techniques often used in sophisticated experimental and biomedicalresearch. It includes procedures for general linear models (GLM), linear mixed models, variancecomponents analysis, loglinear analysis, ordinal regression, actuarial life tables, Kaplan-Meiersurvival analysis, and basic and extended Cox regression.Bootstrapping is a method for deriving robust estimates of standard errors and confidenceintervals for estimates such as the mean, median, proportion, odds ratio, correlation coefficient orregression coefficient.Categories performs optimal scaling procedures, including correspondence analysis.Complex Samples allows survey, market, health, and public opinion researchers, as well as socialscientists who use sample survey methodology, to incorporate their complex sample designsinto data analysis.Conjoint provides a realistic way to measure how individual product attributes affect consumer andcitizen preferences. With Conjoint, you can easily measure the trade-off effect of each productattribute in the context of a set of product attributes—as consumers do when making purchasingdecisions.Custom Tables creates a variety of presentation-quality tabular reports, including complexstub-and-banner tables and displays of multiple response data. Copyright IBM Corporation 1989, 2012.iii
Data Preparation provides a quick visual snapshot of your data. It provides the ability to applyvalidation rules that identify invalid data values. You can create rules that flag out-of-rangevalues, missing values, or blank values. You can also save variables that record individual ruleviolations and the total number of rule violations per case. A limited set of predefined rules thatyou can copy or modify is provided.Decision Trees creates a tree-based classification model. It classifies cases into groups or predictsvalues of a dependent (target) variable based on values of independent (predictor) variables. Theprocedure provides validation tools for exploratory and confirmatory classification analysis.Direct Marketing allows organizations to ensure their marketing programs are as effective aspossible, through techniques specifically designed for direct marketing.Exact Tests calculates exact p values for statistical tests when small or very unevenly distributedsamples could make the usual tests inaccurate. This option is available only on Windowsoperating systems.Forecasting performs comprehensive forecasting and time series analyses with multiplecurve-fitting models, smoothing models, and methods for estimating autoregressive functions.Missing Values describes patterns of missing data, estimates means and other statistics, andimputes values for missing observations.Neural Networks can be used to make business decisions by forecasting demand for a product as afunction of price and other variables, or by categorizing customers based on buying habits anddemographic characteristics. Neural networks are non-linear data modeling tools. They can beused to model complex relationships between inputs and outputs or to find patterns in data.Regression provides techniques for analyzing data that do not fit traditional linear statisticalmodels. It includes procedures for probit analysis, logistic regression, weight estimation,two-stage least-squares regression, and general nonlinear regression.Amos (analysis of moment structures) uses structural equation modeling to confirm and explainconceptual models that involve attitudes, perceptions, and other factors that drive behavior.About IBM Business AnalyticsIBM Business Analytics software delivers complete, consistent and accurate information thatdecision-makers trust to improve business performance. A comprehensive portfolio of businessintelligence, predictive analytics, financial performance and strategy management, and analyticapplications provides clear, immediate and actionable insights into current performance and theability to predict future outcomes. Combined with rich industry solutions, proven practices andprofessional services, organizations of every size can drive the highest productivity, confidentlyautomate decisions and deliver better results.As part of this portfolio, IBM SPSS Predictive Analytics software helps organizations predictfuture events and proactively act upon that insight to drive better business outcomes. Commercial,government and academic customers worldwide rely on IBM SPSS technology as a competitiveadvantage in attracting, retaining and growing customers, while reducing fraud and mitigatingrisk. By incorporating IBM SPSS software into their daily operations, organizations becomepredictive enterprises – able to direct and automate decisions to meet business goals and achieveiv
measurable competitive advantage. For further information or to reach a representative visithttp://www.ibm.com/spss.Technical supportTechnical support is available to maintenance customers. Customers may contact TechnicalSupport for assistance in using IBM Corp. products or for installation help for one of thesupported hardware environments. To reach Technical Support, see the IBM Corp. web siteat http://www.ibm.com/support. Be prepared to identify yourself, your organization, and yoursupport agreement when requesting assistance.Technical Support for StudentsIf you’re a student using a student, academic or grad pack version of any IBMSPSS software product, please see our special online Solutions for Education(http://www.ibm.com/spss/rd/students/) pages for students. If you’re a student using auniversity-supplied copy of the IBM SPSS software, please contact the IBM SPSS productcoordinator at your university.Customer ServiceIf you have any questions concerning your shipment or account, contact your local office. Pleasehave your serial number ready for identification.Training SeminarsIBM Corp. provides both public and onsite training seminars. All seminars feature hands-onworkshops. Seminars will be offered in major cities on a regular basis. For more information onthese seminars, go to g.v
Chapter1OverviewWhat’s new in version 21?Simulation. Predictive models, such as linear regression, require a set of known inputs to predict anoutcome or target value. In many real world applications, however, values of inputs are uncertain.Simulation allows you to account for uncertainty in the inputs to predictive models and evaluatethe likelihood of various outcomes in the presence of that uncertainty.One-click descriptive statistics. Select variables in the Data Editor and get summary descriptivestatistics (for example, mean, median, frequency counts). Appropriate statistics are automaticallydetermined based on measurement level. For more information, see the topic ObtainingDescriptive Statistics for Selected Variables in Chapter 5 on p. 94.Read Cognos Business Intelligence data. If you have access to an IBM Cognos BusinessIntelligence server, you can read data packages and list reports into IBM SPSS Statistics. Formore information, see the topic Reading Cognos data in Chapter 3 on p. 36.Merge data files without pre-sorting. Merge data files by values of key variables withoutpre-sorting the files based on key values. You can also merge data files based on string keys ofdifferent defined lengths in each file and merge a case data file with multiple table-lookup fileswith different keys in each table-lookup file.Compare datasets. Compare the data values and metadata attributes (dictionary information) oftwo datasets. For more information, see the topic Comparing datasets in Chapter 3 on p. 61.Password protect and encrypt data and output files. For more information, see the topic Encryptingdata files and output documents in Chapter 23 on p. 420.Pivot table editing enhancements. After creating pivot tables, you can now: Toggle the display of names, values, and labels. For more information, see thetopic Controlling display of variable and value labels in Chapter 11 on p. 233. Sort table rows. For more information, see the topic Sorting rows in Chapter 11 on p. 232. Insert rows and columns. For more information, see the topic Inserting rows and columnsin Chapter 11 on p. 232. Change the output language. For more information, see the topic Changing the outputlanguage in Chapter 11 on p. 233.Export output in Excel 2007 and higher format. For more information, see the topic Export output inChapter 10 on p. 213.Preserve table styles when exporting output to HTML. All pivot table style information (for example,font styles, background colors) and column widths can now be preserved. For more information,see the topic HTML options in Chapter 10 on p. 215. Copyright IBM Corporation 1989, 2012.1
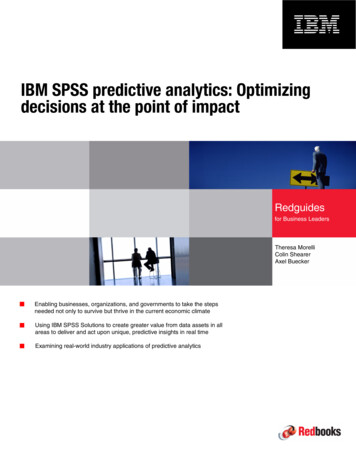
2Chapter 1Unicode default. SPSS Statistics now runs in Unicode mode by default instead of code page mode.WindowsThere are a number of different types of windows in IBM SPSS Statistics:Data Editor. The Data Editor displays the contents of the data file. You can create new data files ormodify existing data files with the Data Editor. If you have more than one data file open, there is aseparate Data Editor window for each data file.Viewer. All statistical results, tables, and charts are displayed in the Viewer. You can edit theoutput and save it for later use. A Viewer window opens automatically the first time you runa procedure that generates output.Pivot Table Editor. Output that is displayed in pivot tables can be modified in many ways withthe Pivot Table Editor. You can edit text, swap data in rows and columns, add color, createmultidimensional tables, and selectively hide and show results.Chart Editor. You can modify high-resolution charts and plots in chart windows. You can changethe colors, select different type fonts or sizes, switch the horizontal and vertical axes, rotate 3-Dscatterplots, and even change the chart type.Text Output Editor. Text output that is not displayed in pivot tables can be modified with the TextOutput Editor. You can edit the output and change font characteristics (type, style, color, size).Syntax Editor. You can paste your dialog box choices into a syntax window, where your selectionsappear in the form of command syntax. You can then edit the command syntax to use specialfeatures that are not available through dialog boxes. You can save these commands in a file foruse in subsequent sessions.Figure 1-1Data Editor and Viewer
3OverviewDesignated window versus active windowIf you have more than one open Viewer window, output is routed to the designated Viewerwindow. If you have more than one open Syntax Editor window, command syntax is pasted intothe designated Syntax Editor window. The designated windows are indicated by a plus sign in theicon in the title bar. You can change the designated windows at any time.The designated window should not be confused with the active window, which is the currentlyselected window. If you have overlapping windows, the active window appears in the foreground.If you open a window, that window automatically becomes the active window and the designatedwindow.Changing the designated windowE Make the window that you want to designate the active window (click anywhere in the window).E Click the Designate Window button on the toolbar (the plus sign icon).orE From the menus choose:Utilities Designate WindowNote: For Data Editor windows, the active Data Editor window determines the dataset that is usedin subsequent calculations or analyses. There is no “designated” Data Editor window. For moreinformation, see the topic Basic Handling of Multiple Data Sources in Chapter 6 on p. 97.Status BarThe status bar at the bottom of each IBM SPSS Statistics window provides the followinginformation:Command status. For each procedure or command that you run, a case counter indicates thenumber of cases processed so far. For statistical procedures that require iterative processing, thenumber of iterations is displayed.Filter status. If you have selected a random sample or a subset of cases for analysis, the messageFilter on indicates that some type of case filtering is currently in effect and not all cases in thedata file are included in the analysis.Weight status. The message Weight on indicates that a weight variable is being used to weightcases for analysis.Split File status. The message Split File on indicates that the data file has been split into separategroups for analysis, based on the values of one or more grouping variables.Dialog boxesMost menu selections open dialog boxes. You use dialog boxes to select variables and optionsfor analysis.
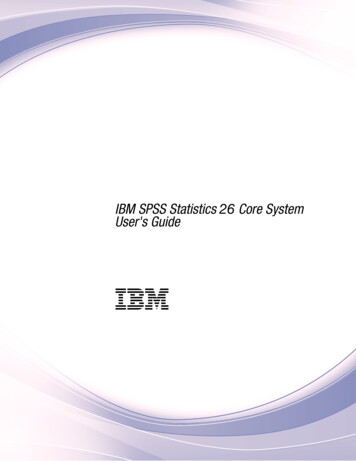
4Chapter 1Dialog boxes for statistical procedures and charts typically have two basic components:Source variable list. A list of variables in the active dataset. Only variable types that are allowedby the selected procedure are displayed in the source list. Use of short string and long stringvariables is restricted in many procedures.Target variable list(s). One or more lists indicating the variables that you have chosen for theanalysis, such as dependent and independent variable lists.Variable names and variable labels in dialog box listsYou can display either variable names or variable labels in dialog box lists, and you can control thesort order of variables in source variable lists. To control the default display attributes of variablesin source lists, choose Options on the Edit menu. For more information, see the topic Generaloptions in Chapter 17 on p. 318.You can also change the variable list display attributes within dialogs. The method for changingthe display attributes depends on the dialog: If the dialog provides sorting and display controls above the source variable list, use thosecontrols to change the display attributes. If the dialog does not contain sorting controls above the source variable list, right-click on anyvariable in the source list and select the display attributes from the context menu.You can display either variable names or variable labels (names are displayed for any variableswithout defined labels), and you can sort the source list by file order, alphabetical order, ormeasurement level. (In dialogs with sorting controls above the source variable list, the defaultselection of None sorts the list in file order.)Resizing dialog boxesYou can resize dialog boxes just like windows, by clicking and dragging the outside borders orcorners. For example, if you make the dialog box wider, the variable lists will also be wider.Figure 1-2Resized dialog box
5OverviewDialog box controlsThere are five standard controls in most dialog boxes:OK or Run. Runs the procedure. After you select your variables and choose any additionalspecifications, click OK to run the procedure and close the dialog box. Some dialogs have aRun button instead of the OK button.Paste. Generates command syntax from the dialog box selections and pastes the syntax into asyntax window. You can then customize the commands with additional features that are notavailable from dialog boxes.Reset. Deselects any variables in the selected variable list(s) and resets all specifications in thedialog box and any subdialog boxes to the default state.Cancel. Cancels any changes that were made in the dialog box settings since the last time it wasopened and closes the dialog box. Within a session, dialog box settings are persistent. A dialogbox retains your last set of specifications until you override them.Help. Provides context-sensitive Help. This control takes you to a Help window that containsinformation about the current dialog box.Selecting variablesTo select a single variable, simply select it in the source variable list and drag and drop it into thetarget variable list. You can also use arrow button to move variables from the source list to thetarget lists. If there is only one target variable list, you can double-click individual variables tomove them from the source list to the target list.You can also select multiple variables: To select multiple variables that are grouped together in the variable list, click the first variableand then Shift-click the last variable in the group. To select multiple variables that are not grouped together in the variable list, click the firstvariable, then Ctrl-click the next variable, and so on (Macintosh: Command-click).Data type, measurement level, and variable list iconsThe icons that are displayed next to variables in dialog box lists provide information about thevariable type and measurement level.NumericScale (Continuous)OrdinalNominalStringn/aDateTime
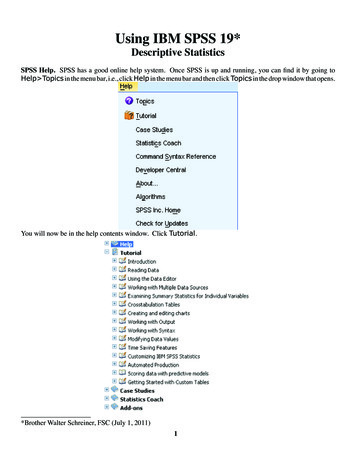
6Chapter 1 For more information on measurement level, see Variable measurement level on p. 76. For more information on numeric, string, date, and time data types, see Variable type on p. 77.Getting information about variables in dialog boxesMany dialogs provide the ability to find out more about the variables displayed in the variable lists.E Right-click a variable in the source or target variable list.E Choose Variable Information.Figure 1-3Variable informationBasic steps in data analysisAnalyzing data with IBM SPSS Statistics is easy. All you have to do is:Get your data into SPSS Statistics. You can open a previously saved SPSS Statistics data file,you can read a spreadsheet, database, or text data file, or you can enter your data directly inthe Data Editor.Select a procedure. Select a procedure from the menus to calculate statistics or to create a chart.Select the variables for the analysis. The variables in the data file are displayed in a dialog box forthe procedure.Run the procedure and look at the results. Results are displayed in the Viewer.
7OverviewStatistics CoachIf you are unfamiliar with IBM SPSS Statistics or with the available statistical procedures, theStatistics Coach can help you get started by prompting you with simple questions, nontechnicallanguage, and visual examples that help you select the basic statistical and charting features thatare best suited for your data.To use the Statistics Coach, from the menus in any SPSS Statistics window choose:Help Statistics CoachThe Statistics Coach covers only a selected subset of procedures. It is designed to provide generalassistance for many of the basic, commonly used statistical techniques.Finding out moreFor a comprehensive overview of the basics, see the online tutorial. From any IBM SPSS Statistics menu choose:Help Tutorial
Chapter2Getting HelpHelp is provided in many different forms:Help menu. The Help menu in most windows provides access to the main Help system, plustutorials and technical reference material. Topics. Provides access to the Contents, Index, and Search tabs, which you can use to findspecific Help topics. Tutorial. Illustrated, step-by-step instructions on how to use many of the basic features. Youdon’t have to view the whole tutorial from start to finish. You can choose the topics you wantto view, skip around and view topics in any order, and use the index or table of contents tofind specific topics. Case Studies. Hands-on examples of how to create various types of statistical analyses andhow to interpret the results. The sample data files used in the examples are also provided sothat you can work through the examples to see exactly how the results were produced. Youcan choose the specific procedure(s) that you want to learn about from the table of contentsor search for relevant topics in the index. Statistics Coach. A wizard-like approach to guide you through the process of finding theprocedure that you want to use. After you make a series of selections, the Statistics Coachopens the dialog box for the statistical, reporting, or charting procedure that meets yourselected criteria. Command Syntax Reference. Detailed command syntax reference information is available intwo forms: integrated into the overall Help system and as a separate document in PDF form inthe Command Syntax Reference, available from the Help menu. Statistical Algorithms. The algorithms used for most statistical procedures are available in twoforms: integrated into the overall Help system and as a separate document in PDF formavailable on the manuals CD. For links to specific algorithms in the Help system, chooseAlgorithms from the Help menu.Context-sensitive Help. In many places in the user interface, you can get context-sensitive Help. Dialog box Help buttons. Most dialog boxes have a Help button that takes you directly to aHelp topic for that dialog box. The Help topic provides general information and links torelated topics. Pivot table context menu Help. Right-click on terms in an activated pivot table in the Viewerand choose What’s This? from the context menu to display definitions of the terms. Command syntax. In a command syntax window, position the cursor anywhere within a syntaxblock for a command and press F1 on the keyboard. A complete command syntax chart forthat command will be displayed. Complete command syntax documentation is available fromthe links in the list of related topics and from the Help Contents tab. Copyright IBM Corporation 1989, 2012.8
9Getting HelpOther ResourcesTechnical Support Web site. Answers to many common problems can be found athttp://www.ibm.com/support. (The Technical Support Web site requires a login ID and password.Information on how to obtain an ID and password is provided at the URL listed above.)If you’re a student using a student, academic or grad pack version of any IBMSPSS software product, please see our special online Solutions for Education(http://www.ibm.com/spss/rd/students/) pages for students. If you’re a student using auniversity-supplied copy of the IBM SPSS software, please contact the IBM SPSS productcoordinator at your university.SPSS Community. The SPSS community has resources for all levels of users and applicationdevelopers. Download utilities, graphics examples, new statistical modules, and articles. Visit theSPSS community at etting Help on Output TermsTo see a definition for a term in pivot table output in the Viewer:E Double-click the pivot table to activate it.E Right-click on the term that you want explained.E Choose What’s This? from the context menu.A definition of the term is displayed in a pop-up window.Figure 2-1Activated pivot table glossary Help with right mouse button
Chapter3Data filesData files come in a wide variety of formats, and this software is designed to handle many ofthem, including: Spreadsheets created with Excel and Lotus Database tables from many database sources, including Oracle, SQLServer, Access, dBASE,and others Tab-delimited and other types of simple text files Data files in IBM SPSS Statistics format created on other operating systems SYSTAT data files SAS data files Stata data files IBM Cognos Business Intelligence data packages and list reportsOpening data filesIn addition to files saved in IBM SPSS Statistics format, you can open Excel, SAS, Stata,tab-delimited, and other files without converting the files to an intermediate format or enteringdata definition information. Opening a data file makes it the active dataset. If you already have one or more open datafiles, they remain open and available for subsequent use in the session. Clicking anywherein the Data Editor window for an open data file will make it the active dataset. For moreinformation, see the topic Working with Multiple Data Sources in Chapter 6 on p. 97. In distributed analysis mode using a remote server to process commands and run procedures,the available data files, folders, and drives are dependent on what is available on or from theremote server. The current server name is indicated at the top of the dialog box. You willnot have access to data files on your local computer unless you specify the drive as a shareddevice and the folders containing your data files as shared folders. For more information, seethe topic Distributed Analysis Mode in Chapter 4 on p. 67.To open data filesE From the menus choose:File Open Data.E In the Open Data dialog box, select the file that you want to open.E Click Open. Copyright IBM Corporation 1989, 2012.10
11Data filesOptionally, you can: Automatically set the width of each string variable to the longest observed value for thatvariable using Minimize string widths based on observed values. This is particularly useful whenreading code page data files in Unicode mode. For more information, see the topic Generaloptions in Chapter 17 on p. 318. Read variable names from the first row of spreadsheet files. Specify a range of cells to read from spreadsheet files. Specify a worksheet within an Excel file to read (Excel 95 or later).For information on reading data from databases, see Reading Database Files on p. 13. Forinformation on reading data from text data files, see Text Wizard on p. 27. For information onreading IBM Cognos data, see Reading Cognos data on p. 36.Data file typesSPSS Statistics. Opens data files saved in IBM SPSS Statistics format and also the DOSproduct SPSS/PC .SPSS Statistics Compressed. Opens data files saved in SPSS Statistics compressed format.SPSS/PC . Opens SPSS/PC data files. This is available only on Windows operating systems.SYSTAT. Opens SYSTAT data files.SPSS Statistics Portable. Opens data files saved in portable format. Saving a file in portable formattakes considerably longer than saving the file in SPSS Statistics format.Excel. Opens Excel files.Lotus 1-2-3. Opens data files saved in 1-2-3 format for release 3.0, 2.0, or 1A of Lotus.SYLK. Opens data files saved in SYLK (symbolic link) format, a format used by some spreadsheetapplications.dBASE. Opens dBASE-format files for either dBASE IV, dBASE III or III PLUS, or dBASE II.Each case is a record. Variable and value labels and missing-value specifications are lost whenyou save a file in this format.SAS. SAS versions 6–9 and SAS transport files. Using command syntax, you can also read valuelabels from a SAS format catalog file.Stata. Stata versions 4–8.Opening file optionsRead variable names. For spreadsheets, you can read variable names from the first row of the fileor the first row of the defined range. The values are converted as necessary to create valid variablenames, including converting spaces to underscores.Worksheet. Excel 95 or later files can contain multiple worksheets. By default, the Data Editorreads the first worksheet. To read a different worksheet, select the worksheet from the drop-downlist.
12Chapter 3Range. For spreadsheet data files, you can also read a range of cells. Use the same method forspecifying cell ranges as you would with the spreadsheet application.Reading Excel 95 or Later FilesThe following rules apply to reading Excel 95 or later files:Data type and width. Each column is a variable. The data type and width for each variable aredetermined by the data type and width in the Excel file. If the column contains more than onedata type (for example, date and numeric), the data type is set to string, and all values are readas valid string values.Blank cells. For numeric variables, blank cells are converted to the system-missing value,indicated by a period. For string variables, a blank is a valid string value, and blank cells aretreated as valid string values.Variable names. If you read the first row of the Excel file (or the first row of the specified range) asvariable names, values that don’t conform to variable naming rules are converted to valid variablenames, and the original names are used as variable labels. If you do not read variabl
SPSS Statistics can take data from almost any type of file and use them to generate tabulated reports, charts and plots of distributions and trends, descriptive statistics, and complex statistical analyses. This manual, the IBM SPSS Statistics 21 Core System User’s Guide, documents the grap