Transcription
www.exitcertified.comIBM Cognos Analytics - Author Reports withMultidimensional Data (V11.0) (B6061G)Presented To Olugbenga OlobaCourse: B6061GClass ID: 155658Dates: 2021/01/28-2021/01/29Olugbenga Olobaenrollments@tcworkshop.comTCW Adobe Connect
Demonstrations, Exercises and SolutionsIBM Cognos Analytics: AuthorReports with Multidimensional Data (v11.0)Course code B6061 ERC 3.0IBM TrainingName: Olugbenga OlobaEmail: enrollments@tcworkshop.comTCW Adobe Connect 2021/01/28
PrefaceApril, 2016NOTICESThis information was developed for products and services offered in the USA.IBM may not offer the products, services, or features discussed in this document in other countries. Consult your local IBM representative forinformation on the products and services currently available in your area. Any reference to an IBM product, program, or service is not intended tostate or imply that only that IBM product, program, or service may be used. Any functionally equivalent product, program, or service that does notinfringe any IBM intellectual property right may be used instead. However, it is the user's responsibility to evaluate and verify the operation of anynon-IBM product, program, or service. IBM may have patents or pending patent applications covering subject matter described in this document.The furnishing of this document does not grant you any license to these patents. You can send license inquiries, in writing, to:IBM Director of LicensingIBM CorporationNorth Castle Drive, MD-NC119Armonk, NY 10504-1785United States of AmericaThe following paragraph does not apply to the United Kingdom or any other country where such provisions are inconsistent with local law:INTERNATIONAL BUSINESS MACHINES CORPORATION PROVIDES THIS PUBLICATION "AS IS" WITHOUT WARRANTY OF ANY KIND,EITHER EXPRESS OR IMPLIED, INCLUDING, BUT NOT LIMITED TO, THE IMPLIED WARRANTIES OF NON-INFRINGEMENT,MERCHANTABILITY OR FITNESS FOR A PARTICULAR PURPOSE. Some states do not allow disclaimer of express or implied warranties incertain transactions, therefore, this statement may not apply to you.This information could include technical inaccuracies or typographical errors. Changes are periodically made to the information herein; thesechanges will be incorporated in new editions of the publication. IBM may make improvements and/or changes in the product(s) and/or theprogram(s) described in this publication at any time without notice.Any references in this information to non-IBM websites are provided for convenience only and do not in any manner serve as an endorsement ofthose websites. The materials at those websites are not part of the materials for this IBM product and use of those websites is at your own risk.IBM may use or distribute any of the information you supply in any way it believes appropriate without incurring any obligation to you. Informationconcerning non-IBM products was obtained from the suppliers of those products, their published announcements or other publicly availablesources. IBM has not tested those products and cannot confirm the accuracy of performance, compatibility or any other claims related to non-IBMproducts. Questions on the capabilities of non-IBM products should be addressed to the suppliers of those products.This information contains examples of data and reports used in daily business operations. To illustrate them as completely as possible, theexamples include the names of individuals, companies, brands, and products. All of these names are fictitious and any similarity to the names andaddresses used by an actual business enterprise is entirely coincidental.TRADEMARKSIBM, the IBM logo, and ibm.com are trademarks or registered trademarks of International Business Machines Corp., registered in many jurisdictionsworldwide. Other product and service names might be trademarks of IBM or other companies. A current list of IBM trademarks is available on theweb at “Copyright and trademark information” at www.ibm.com/legal/copytrade.shtml.Adobe, the Adobe logo are either registered trademarks or trademarks of Adobe Systems Incorporated in the United States, and/or other countries.Microsoft, Windows, and the Windows logo are trademarks of Microsoft Corporation in the United States, other countries, or both.Java and all Java-based trademarks and logos are trademarks or registered trademarks of Oracle and/or its affiliates. Copyright International Business Machines Corporation 2016.This document may not be reproduced in whole or in part without the prior written permission of IBM.US Government Users Restricted Rights - Use, duplication or disclosure restricted by GSA ADP Schedule Contract with IBM Corp. Copyright IBM Corp. 2007, 2016Course materials may not be reproduced in whole or in part without the prior written permission of IBM.Name: Olugbenga OlobaEmail: enrollments@tcworkshop.comTCW Adobe Connect 2021/01/28P-2
Introduction to dimensional reporting conceptsIntroduction to dimensionalreporting conceptsIBM Cognos Analytics 11.0 Copyright IBM Corporation 2016Course materials may not be reproduced in whole or in part without the written permission of IBM.Name: Olugbenga OlobaEmail: enrollments@tcworkshop.comTCW Adobe Connect 2021/01/28
Unit 1 Introduction to dimensional reporting concepts Copyright IBM Corp. 2007, 2016Course materials may not be reproduced in whole or in part without the prior written permission of IBM.Name: Olugbenga OlobaEmail: enrollments@tcworkshop.comTCW Adobe Connect 2021/01/281-2
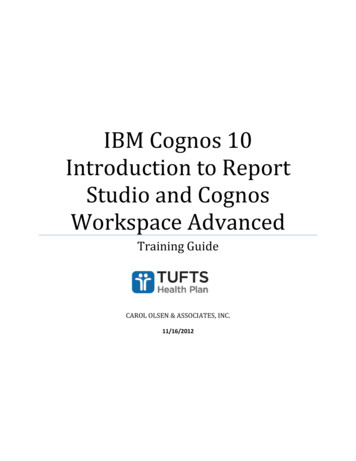
Unit 1 Introduction to dimensional reporting conceptsDemonstration and exercise start point informationThe beginning of each demonstration and exercise contains a section that identifies thespecific variables you will use for the tasks that you will perform. The format appears asfollows:Portal:User/Password:Package:Report ttonf/Education1Team content Samples Models GO data warehouse (query)ListSales and Marketing (query)Sales (query)This section specifies the user ID and password, package, and report type you will use,as well as the folder and namespace that contain the items you require to build thereport. For example, if your demonstration provided the start point information above,you would do the following steps to create the report:1.2.3.4.5.6.7.From the Start menu, click All Programs Internet Explorer to launch abrowser session.In the Address box, type the portal address http://vclassbase:9300/bi andthen press Enter.The Log On to IBM Cognos Analytics window appears in a browser tab, with aLog on dialog box prompting for a User ID and Password. You will log on withthe credentials listed in the start point information.In the User ID box type brettonf, in the Password box type Education1, andthen click Sign in.The IBM Cognos Analytics software page displays, the features of theapplication that your user has permission to use are displayed.Click Newand then click Report.You are prompted to select a package to author your reports with and also toselect a reporting object, such as a List or a Crosstab.Click the ellipsis to the right of the Package text box.Click Samples Models GO data warehouse (query), and then click Open.The New dialog box displays the package you will work with, and the reportobjects that you will begin to author your report. You can select one object fromthe list, and then click OK, or you can double-click an object to select it andlaunch the new report. The start point information in this example requires a listreport template.Click Listand then click OK. Copyright IBM Corp. 2007, 2016Course materials may not be reproduced in whole or in part without the prior written permission of IBM.Name: Olugbenga OlobaEmail: enrollments@tcworkshop.comTCW Adobe Connect 2021/01/281-17
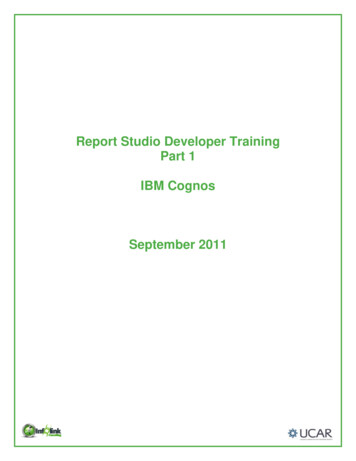
Unit 1 Introduction to dimensional reporting conceptsMost demonstrations and exercises will require a new report. If yourdemonstration or exercise requires you to use an existing report, you will beprovided with a report name and location in the start point information. Becausethis start point example lists a Report type, this is your cue that a new report isrequired.8.Click Datain the side panel on the left.This opens two tabs: Source and Data items. The Source tab includes apackage explorer for using the data in the package that you have selected,while the Data items tab contains a list of data items that are in use in yourreport.9. Expand the Sales and Marketing (query) folder.The expanded folder displays the namespaces that are available to you in thispackage. The starting point information in this example will work with the Sales(query) namespace.10. Expand the Sales (query) namespace.The results appear as follows:You will work with the metadata of query subjects, query items, and facts withinthis selected namespace unless otherwise mentioned. Follow the start pointinformation carefully, as there will be different logins, packages, report types,and namespaces used for each demonstration and exercise in this course.At the end of each unit, in the last demonstration or exercise, you will beinstructed to log off. You do not have to log off if you will be doing the next unitimmediately; you should log off as a best practice if you are finished working withIBM Cognos Analytics for the day. Copyright IBM Corp. 2007, 2016Course materials may not be reproduced in whole or in part without the prior written permission of IBM.Name: Olugbenga OlobaEmail: enrollments@tcworkshop.comTCW Adobe Connect 2021/01/281-18
Unit 1 Introduction to dimensional reporting conceptsNote: The course environment requires the following services to be started before youbegin performing demonstrations and exercises: Apache Directory Server DB2 -DB2COPY 1 - DB2 DB2DAS - DB2DAS00 IBM Cognos World Wide Web Publishing ServiceTo review the services, on the Taskbar of your environment, click the Services icon,and ensure that the above services are running. If you have closed your image andlaunched it again, it is a best practice to review the status of the services beforecontinuing with your demonstrations and exercises.If the Apache Directory Server or DB2 -DB2COPY 1 - DB2 service have stopped, youwill need to stop the IBM Cognos service, start the stopped service(s), and then startthe IBM Cognos service once the previously stopped service(s) has (have) startedsuccessfully. You can start and stop a specific service by double-clicking the service toopen the Properties dialog box, and then clicking the Stop or Start buttons.Note that it may take 15 minutes or more for the IBM Cognos service to start. Copyright IBM Corp. 2007, 2016Course materials may not be reproduced in whole or in part without the prior written permission of IBM.Name: Olugbenga OlobaEmail: enrollments@tcworkshop.comTCW Adobe Connect 2021/01/281-19
Unit 1 Introduction to dimensional reporting conceptsDemonstration 1Explore the dimensional data treeIntroduction to dimensional reporting concepts Copyright IBM Corporation 2016Demonstration 1: Explore the dimensional data tree Copyright IBM Corp. 2007, 2016Course materials may not be reproduced in whole or in part without the prior written permission of IBM.Name: Olugbenga OlobaEmail: enrollments@tcworkshop.comTCW Adobe Connect 2021/01/281-20
Unit 1 Introduction to dimensional reporting conceptsDemonstration 1:Explore the dimensional data treePurpose:You must familiarize yourself with using dimensional reporting objects tocreate reports. To do this, you will navigate a dimensionally-modeledrelational data source and identify the objects in the data tree. You willidentify the differences in the result set when using the objects in t schb/Education1Team content Samples Models GO Sales (analysis)CrosstabSales and Marketing (query)Sales (query)Task 1. Using a DMR data source, identify reporting objects inthe data tree.1.2.3.4.5.In the Internet Explorer address box, type http://vclassbase:9300/bi, and thenpress Enter.On the Log on screen, in the User ID box, type hirschb, in the Password box,type Education1, and then click Sign in.On the Welcome page, click New Report from the side panel.In the New dialog, click the ellipsis, navigate to Team content Samples Models GO Sales (analysis), and click Open.In the New dialog, click Crosstab, and then click OK.The results appear as follows: Copyright IBM Corp. 2007, 2016Course materials may not be reproduced in whole or in part without the prior written permission of IBM.Name: Olugbenga OlobaEmail: enrollments@tcworkshop.comTCW Adobe Connect 2021/01/281-21
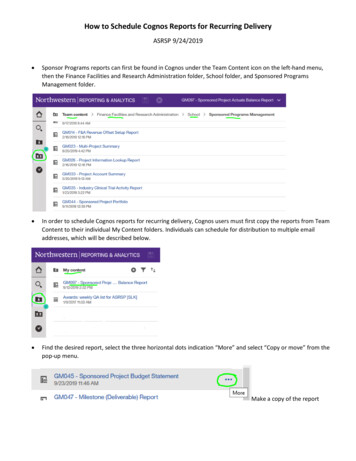
Unit 1 Introduction to dimensional reporting concepts6.Click Datafrom the side bar at the left to expose the Data pane with theSource tab selected.The Source tab shows the GO Sales (analysis) model as follows:The GO Sales model consists of a root namespace that takes its name from thepackage that was published from Framework Manager. This namespacecontains six namespaces. This structure represents the contents of the packagethat was created in Framework Manager, which in turn, represents a businessview of the metadata taken from the Framework Manager model. This model isbased on a relational source but it was modeled dimensionally.If you were to examine the data tree at this point, you would see Membersfolders. This is the default behavior for IBM Cognos Analytics for dimensionaldata sources. At this point, you will hide the Members folders because you wantto only examine the metadata that is available from the tree, and not members.You can change the view of the data package tree, on the Source tab, byswitching between the Metadata tree view , which allows you to view the fulldata tree (the metadata and dimensional members), and the Members tree7.8.9.view, which limits your view to dimensional-only data. For now, you willwork in the default view.In the Data pane, right-click the background of the Source tab, and then clickPackage Tree Settings.In the Settings section, clear the Members and the Members for each levelcheck boxes, and then click OK.The tree will now display levels and member properties.In the Data pane: Expand the Sales (analysis) namespace.It contains measures and dimensions. Expand the Products dimension.It contains the Products hierarchy. Copyright IBM Corp. 2007, 2016Course materials may not be reproduced in whole or in part without the prior written permission of IBM.Name: Olugbenga OlobaEmail: enrollments@tcworkshop.comTCW Adobe Connect 2021/01/281-22
Unit 1 Introduction to dimensional reporting concepts Expand the Products hierarchy.It contains a hierarchical structure consisting of the Products, Product line,Product type, Product, and Product details levels. The Products levelrepresents the top level of the hierarchy and, when used in a query or reportalong with a measure, represents the aggregate total for the lower levels of thehierarchy. Expand the Product line, Product type, and Product levels.Each level contains attributes that describe the parent level. Attributes can beused in queries or reports to provide information about a particular level. Expand the Time dimension, hierarchy and levels. Expand the Sales measure dimension.It contains the measures that are in scope with all the dimensions within theSales namespace.You will now identify the differences between some of these objects when theyare used to create reports.Task 2. Use the highest level in a hierarchy to create a report.1.In the Data pane: Drag the Time levelto the Columns drop zone of the report.Time is the highest level in the Time hierarchy, and although not currentlyvisible, has a single member that is called the root member. This same rootmember is also known as the root member for the hierarchy. Right-click the Time level and then click Properties.2.The Properties dialog box for the Time level data item appears, and thefollowing expression appears in the Ref field:[Sales (analysis)].[Time].[Time].[Time][Sales (analysis)] represents the namespace, and [Time].[Time].[Time]represents the dimension, hierarchy, and level (in this case the root level,which is a rollup for all years) of the selected item.In the Properties dialog box, click Close. Copyright IBM Corp. 2007, 2016Course materials may not be reproduced in whole or in part without the prior written permission of IBM.Name: Olugbenga OlobaEmail: enrollments@tcworkshop.comTCW Adobe Connect 2021/01/281-23
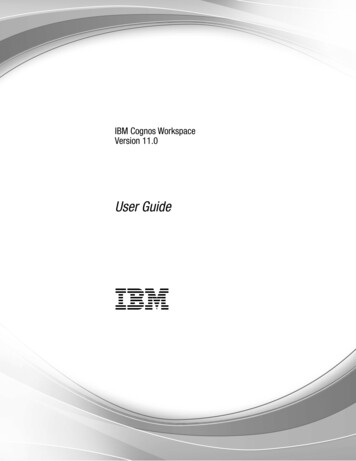
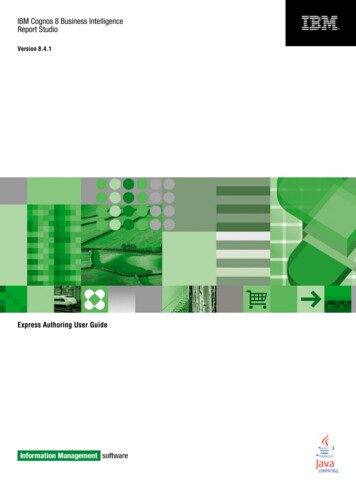
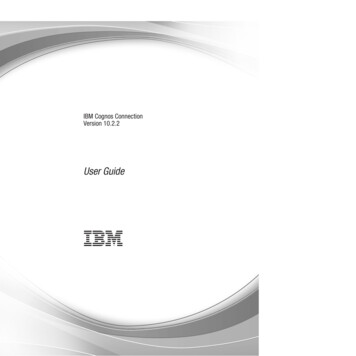
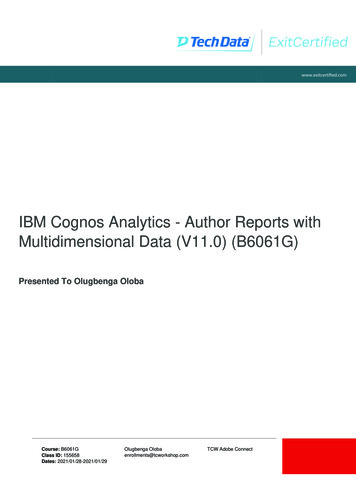
Unit 1 Introduction to dimensional reporting concepts3.In the Data pane: From the Products dimension Products hierarchy, drag the Products levelto the Rows drop zone of the report. From the Sales measure dimension, drag the Revenue measure to theMeasures drop zone of the report.Measures can also be used on the columns or row edges of a report.The results appear as follows:4.5.In the application toolbar, click the More ellipses, and then click Options.Click the Report tab, and click Automatic group and summary behavior forlists to deselect it, and then click OK.6.Run the report in HTML by first clicking Run options, and then clicking.The report appears in IBM Cognos Analytics as shown below:7.Because you included the top levels from both the Time and Producthierarchies, the report shows the corresponding members from each level in therows and column edges. In this case, each level contains a single member,Products and Time respectively. The value shown for Revenue is a rolled upvalue for all child levels for both hierarchies.Close the rendered report tab.Task 3. Use a level below the highest level in a hierarchy tocreate a report.1.2.In the report layout, click #Time# , and then press the Delete key.In the Data pane: From the Products dimension Products hierarchy, drag the Product linelevel to the Rows drop zone above #Products# as a peer From the Time hierarchy, drag the Year level to the Columns drop zone. Right-click the Year level and then click Properties.The expression in the Ref field appears as follows:[Sales (analysis)].[Time].[Time].[Year]Compared to the previous expression, the level [Year] now replaces [Time]. Copyright IBM Corp. 2007, 2016Course materials may not be reproduced in whole or in part without the prior written permission of IBM.Name: Olugbenga OlobaEmail: enrollments@tcworkshop.comTCW Adobe Connect 2021/01/281-24
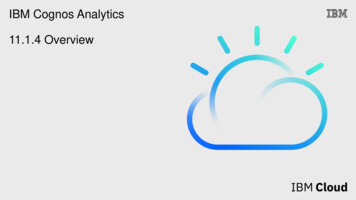
Unit 1 Introduction to dimensional reporting concepts3.4.Click Close, and then run the report in HTML.The results appear as follows:Because you are using the first levels below the highest levels from bothhierarchies, you now see the child members of those levels on both the rowsand columns edges. On the rows edge, you can see that the values shown foreach child member roll up to the values shown at the parent member, which isProducts.Close the rendered report tab.Task 4. Use a hierarchy to create a report.1.2.3.4.5.6.In the report layout, click #Product line# , Ctrl click #Products# , and thenpress the Delete key.In the Data pane, from the Products dimension, drag the Products hierarchyto the Rows drop zone.The Insert Hierarchy dialog box appears.Accept the default selection of Root members, and then click OK.In the Data pane, right-click the Products hierarchy, and then click Properties.The expression in the Ref field appears as follows:[Sales (analysis)].[Products].[Products]In the Properties dialog box, click Close.In the report layout, click #Products# , and then in the Properties panescroll to the DATA ITEM section.The DATA ITEM section of the Properties pane appears as follows: Copyright IBM Corp. 2007, 2016Course materials may not be reproduced in whole or in part without the prior written permission of IBM.Name: Olugbenga OlobaEmail: enrollments@tcworkshop.comTCW Adobe Connect 2021/01/28,1-25
Unit 1 Introduction to dimensional reporting concepts7.The DATA ITEM properties indicate that the Products hierarchy will be
Jan 28, 2021 · non-IBM product, program, or service. IBM may have patents or pending patent applications covering subject matter described in this document. The furnishing of this document does not grant you any license to these patents. You can send license inquiries, in writing, to: IBM Director of Licensing.