Transcription
Writing Reports from aData WarehouseUsing CognosSam Houston State UniversityXiaohong LiDonna Artho
Outline Basic Concepts Data Warehouse Components Evolution of Cognos Cognos at SHSU SHSU Data Flow Chart, IR Reports and Support Planning and Developing the Cognos Report Creating the Cognos Report Initial Design Variables Writing and Reviewing the Cognos Report Tips Questions
Data Warehouse ComponentsData Input/Front LineReportDesignStagingAreaReporting ToolDataWarehouseManager/Client
Cognos Business Intelligence ComponentsDataFiles (Excel, Access); Data Warehouse (Package: Dimensional, Relational); OtherFrameworkManagerTransformerMetric DesignerCognos entStudioOther
Evolution of Cognos 1969 - Founded by Alan Rushforth and Peter Glenister, Ottawa, Ontario 1979 – Developed their first software product for consulting 1982 – Adopted the Cognos name, borrowed from the Latin word “cognosco,”(“knowledge from personal experience”) and moved into software sales 2008 – IBM acquired Cognos. (SAP and Oracle were acquiring their own BIproducts.) 2010 – IBM brought Cognos and SPSS together to form its Business Analyticsdivision Currently, Cognos Business Intelligence and Performance Management Suiteincludes about three dozen software products, include reporting, analysis,dashboard and scorecards delivered through a web-based server.
Features of Cognos as a Web-based Analytics Tool Supports decision-making for management, operations, and planning level ofan organization. Informs decisions based upon business performanceDashboards Data analysis and reporting Cognos 10 (newest version) can be accessed online or through mobile devices Integrates with other systems – Extraction, Transformation & Loading (ETL)tool. SHSU: Banner ERP (raw data) integrates with Cognos Multiple users can simultaneously use it from around the world. Security solutions offer complete control over the report delivery method andaccess.
Cognos at Sam Houston State Beginning in 2010, SHSU initiated steps to replace its 40-year old Legacydatabase Enterprise Resource Planning ModulesImplemented in 2010 – Ellucian’s (formerly SunGard) Banner 8 Financial Aid module Implemented in 2011 – Ellucian’s Banner 8 Student, Finance, Human Resources &Payroll, and Relationship Management modules UsersReport Studio for Business Analysts – IR staff and Business Analysts with pivots andqueries Query Studio – for users with moderate skills to access limited information Dashboards - Management, Cognos 10, new version expected to be launched in2014
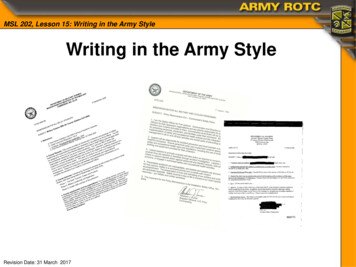
SHSU Data Flow ChartLoading the Data WarehouseStaging AreaOperational System(Data Source)BannerETLDynamic Data WarehouseETLStageODSNightly Data LoadETL – Extraction: process of reading data from data source Transformation: process of converting the extracted data from previous form intothe desired state by using rules or look up tables Loading: process of writing the data into a target databaseStaging Area – holds data for extended periods of time for archival or troubleshootingpurposes Source data are only available for extraction; less than overall data loading time Data warehouse’s loading frequency does not match with the refresh frequenciesof the source systems Extracted data - in multiple places (ODS loading, third-party applications, etc.)
SHSU IR - Report Creation Cognos Connection – Web portal, create and run reports, and perform administrative tasks, suchas scheduling reports Package – a subset of a model of the metadata; Framework manager by ITStudentHRFAIDFinanceOtherPackageNon Package DataODSDataWarehouseProfessional authoring modeCognos ConnectionWeb Interfacesfor reportcreationQueryStudioReportStudioPull data directly from ODS if packagenot availableMultiple-page, multiple-databases
Support Information Technology (IT Support) Provide package(s) as requested by Institutional Research staff Knowledge of Framework model and reporting practices in existing projects Technical resources with Cognos expertiseFunctional User Understands the data and process Understands unique business concepts/Knowledge of business requirements Shares/manages the reports
Planning the Cognos Report Types of Reports New Reports without Template – Analysis, Scheduled Understanding business needs and requirements Designing the report based upon specificationsChoose layout - Essential to ensure theinformation in the report is presented in a clearand effective manner Report Development Review and Validate Data Deliver – Cognos portal, e-mail Feedback & DocumentationFill data into existing Table – Common Data Set InitialInitial Design – Planning ReportsThree StepsDesignFeedback ewValidate
Developing the Cognos Report New Reports without a Template Select a data source – Package or non-package data (If no Framework model, nopackage published using that model – use SQL query.) Choose a Report Type – List, Crosstab, Charts, etc. Design a Query Choose a Reporting Style – Data Source Relational (data as tables and columns - SQL) - Displays records that exist inthe result set. Dimensional (data in multiple dimensions intersecting at cells – MDR) - Displaysevery member unless you remove it.
Report Studio – User InterfaceInsertableObjects PanePage Explorer; Query Explorer; Condition Explorer (changethe appearance of the report)Source; Data Items; ToolboxPackage, folder, namespace, queryselectsubject,* fromqueryszrcbm1item, measureChange Data Source from default empty toODS
SQL Query Workflow vs. Cognos Report Studio QueryCognos Report Studio QuerySQL Syntax StructureSelect Variables in the ReportFrom Tables ViewsJoin /Union Left Right FullFrom (Data source – no package published)(Optional clause)Where Condition / Calculation/HavingGroupbyOrderbySelect (Display Variables in the report) Class (Optional clause) Decs / Aced (Optional clause)Toolbox – Insertable ObjectsFilterTool
Creating Joins in Cognos Report Studio – Create two queries in one report Create joins between Query Subjects Between Query Subjects which have not been joined using the Framework Manager tool, or thosethat have been joined, for which the report writer needs to enforce his own join relationship,overriding the relationship defined in Framework Manager. Cartesian Production: Relationshipwhich joins each row from Table A toeach row in Table B. The lower thecardinality, the more duplicatedrecorder. One-to-one relationship (1:1) One-to-many relationship (1:N) Zero-to-one (0:1) Zero-to-many (0:N)
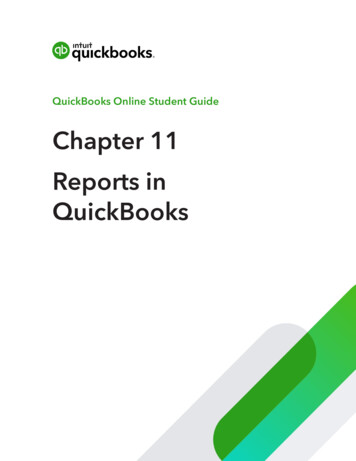
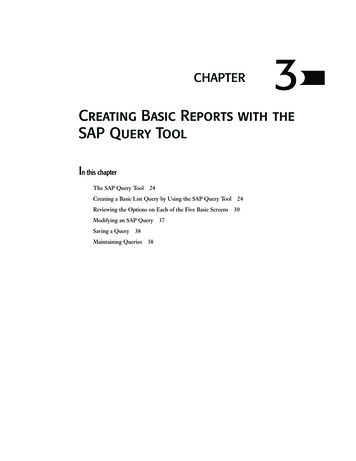
SHSU IR Reports IR 2012/13 Reports Analysis Total Reports – 375 Data Source CB data – No Package IR Freeze Data – No Package Operational Data Store (ODS) data - PackageData Source25%30%Report Type24%PackageNo Package45%MixWith TemplateWithout Template76%
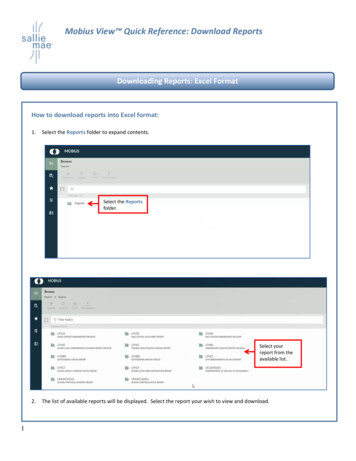
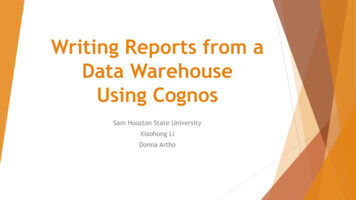
SHSU IR Reports Report Content – Student-related, especially Enrollment Report Requester – College and Department personnel2012 Reports by Requestor2012 Reports by Content22%Student45%7%PayrollFinancial Aid8%10%Combination18%Administrative Units9%53%Other8%Federal, State20%Colleges/DepartmentsService/Support UnitsExternal
Creating the Cognos Report Report Requester – Administrative Units Sample Goal – Create a new report illustrating the Longitudinal Study ofUndergraduates Enrollment Trends – classification, demographic information Retention Rates Graduation Rates Data Source – CBM001, CBM009 Package not available - CB data Report Studio SQL query pulls data directly from ODS when package is not availableSupport – Registrar’s Office, IT (manages TCC tables and processes scripts)
Initial Design Initial Design Communicate with report requestor Understand the purpose of the report Determine if report is for internal/external use Agree on definitions and terms – ex. retention Fall to FallDetermine best presentation format to meet requestor’s needs/purpose Draft Table Title, Headers, Labels Formats
Determining the Data Variables Better understand the data variables Do not use a variable based only on its name FT – Full Time or First Time Manual – understand data definitions in the manuals (CB), metadata Functional Unit – understand how and when the data enters the data system,such as identifying the flex entry student Possible data issues – there is no perfect data, but there is good enoughonce everyone understands definitions and limits on data/access
Writing the Cognos Report Sample - Create Two Queries Query 1 (Enrollment) - Select * from CBM001 Query 2 (Graduation) - Select * from CBM009
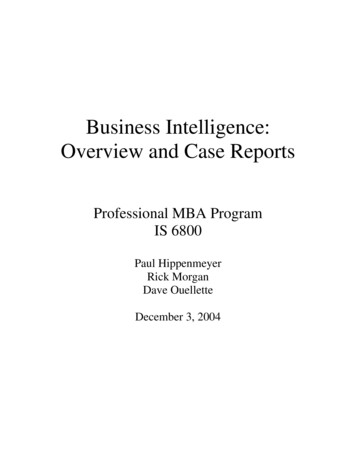
Writing the Cognos Report Cardinality join: Ex. One-to-one relationship (1:1). Establish joinrelationship without writing SQL script.
Writing the Cognos Report Using SQL query data directly from ODS Back to query – see the variables in the Query Item
Writing the Cognos Report – Package Not Available Report Page – select the variables needed for creating the report
Writing the Cognos Report - Calculations Calculated Column Toolbox, Querycalculation Common functions/Typethe calculationAggregation Summarization ofgrouped items Retention rate
Writing the Cognos Report Creating Filters - ? Term ? Creating Prompt Page – allowsuser to customize theinformation in a report for eachrun Creating a Drill-Through Report –links two or more reportscontaining related information Changing Auto Group &Summarize
Reviewing the Cognos Report Modify Report Source Tab vs. Data Items Tab – Cutting vs. Deleting a column Turn Auto Aggregation Off Report change - the items from the source tab never changeMultiple records for one unique ID are combined into one rowReview and Testing Tabular Data Check – Multi queries, check each query and each query join byrunning the report in View Tabular within Report Studio. (Data output willappear very much like the Results section in Brio). This will aid in finding dataerrors, filter problems, and join issues as you create the multi queries.
Tips Keep the Documentation of the Special Variables Used in the Report Reporting on Schedule Offering or Section data, use Academic Period andCourse Reference Number for a unique offering Graduation - ACADEMIC OUTCOME, filter on ACADEMIC PERIOD GRADUATION insteadof ACADEMIC PERIOD Create Template – ensure a consistent look, standardize reports Create consistent Header and Footer Prompt Page – include Academic Year, Student Level, etc. Layout Component Reference – reusable; minimal maintenance, system changesto variables pulled from LCR are automatically updated and reflected in thereports that are built with LCR YouTube Tutorials Join Cognos Professional Groups
Questions Contact InformationXiaohong Li, Senior Institutional Research AnalystSam Houston State Universityxxl001@shsu.eduDonna Artho, Assistant VP for Institutional EffectivenessSam Houston State Universityartho@shsu.edu
Features of Cognos as a Web-based Analytics Tool Supports decision-making for management, operations, and planning level of an organization. Informs decisions based upon business performance Dashboards Data analysis and reporting Cognos 10 (newest version) can be accessed online or through mobile devices Integrates with other systems – Extraction, Transformation & Loading (ETL)