Transcription
IBM Cognos Analytics11.1.4 Overview
What’s new in 11.1.4 New Welcome section on the Home page Waterfall visualization available Forecasting in line/column visualization KPI widget (compare 2 measures) Zero suppression for OLAP sources incrosstabs/tables Supporting custom visualizations (D3,Highcharts, iCharts etc) Updated crosstab (resize column/row, hide,search) Compact legends on visualization Jupyter Notebooks output in reports Weather Company data source2
ReportingIBM Cloud / DOC ID / Month XX, 2019 / 2019 IBM Corporation3
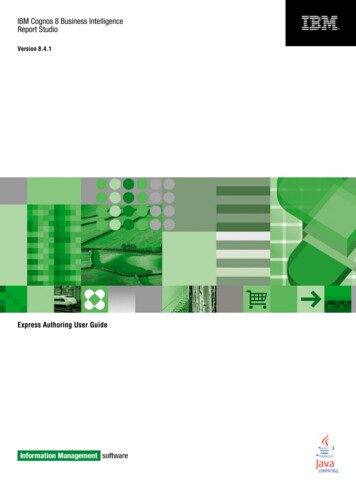
Supporting custom visualizations (D3, Highcharts,etc) Custom visualizations can be uploadeddirectly from Reporting and dashboardingfor reuse. Developers can preview and test customvisualizations live within Cognos Analyticsbefore uploading. Administrators can set permission oncustom visualizations for access control. Additional properties can be included aspart of the custom visualization
Compact legends on visualizations Legends are top positioned by default. More compact design. Users can change legend section heightdirectly on the visualizations by using thegripper.
Jupyter Notebook integration with Reporting Jupyter Notebook cells can be included as part of the report output. For saved report outputs, Notebook cells will always show the latest refreshresults.
DashboardIBM Cloud / DOC ID / Month XX, 2019 / 2019 IBM Corporation7
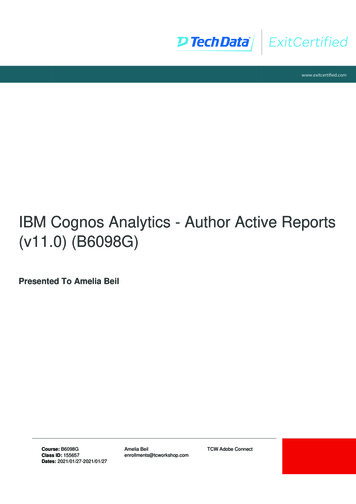
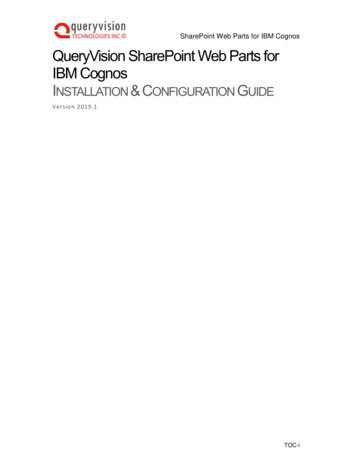
KPI Visualization 3 Data Slots - KPI Measure, Comparative/Target Measure and Time The time slot is an optional field and can be used to generatethe spark line The target measure can be taken from the data, a calculationor a manual value found in the propertiesUp to 3 “steps” to measure performance against a targetBuilt-in indicator shape selectionDocs Link
Crosstab EnhancementsSelection formatting New crosstab design layoutResize column/row width and height & word wrapDrop Zones for nesting/replacing rows and columns
Waterfall Visualization Depict positive and negative values within the same visualization
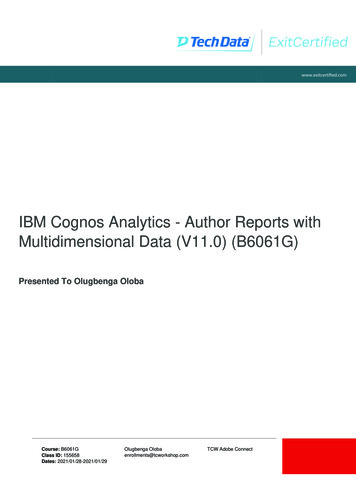
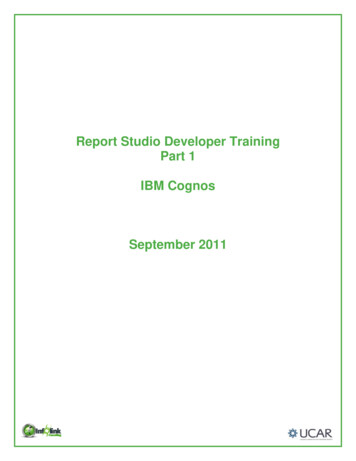
Time Series Forecasting Option to display forecasted values in line, column or bar visualizations with time data Available in dashboards, stories, and explorations Automatic detection of seasonality and exponential smoothing model with best fit
ExploreIBM Cloud / DOC ID / Month XX, 2019 / 2019 IBM Corporation12
Compare Card Suggestions for creating a comparison Improved interaction with Compare line Comparisons across more aggregationmethods – average, countsIBM Cloud / DOC ID / Month XX, 2019 / 2019 IBM Corporation13
Relationship Diagram Choices up front to help users orient themselves to the information Suggested visualizations presented immediately Edit scope, like edit drivers (Edit drivers also has updated UI)IBM Cloud / DOC ID / Month XX, 2019 / 2019 IBM Corporation14
Other Clarify ambiguous fields Properties on visualizationsIBM Cloud / DOC ID / Month XX, 2019 / 2019 IBM Corporation15
Data ModulesIBM Cloud / DOC ID / Month XX, 2019 / 2019 IBM Corporation16
Improved JoinsSupport for 'Between'non-equi joinsOperators:[ , , , ]now supportedIBM Cloud / DOC ID / Month XX, 2019 / 2019 IBM Corporation17
Simplified Data GroupcreationChange from Numeric to Text styleIn cases where groups need to bespecific valuesIBM Cloud / DOC ID / Month XX, 2019 / 2019 IBM Corporation18
IBM Weather Company Data Live data connectivity to IBM Weather Company’s History on Demand and EnhancedForecast API packages Blend weather data with your corporate data
Smarts & AIIBM Cloud / DOC ID / Month XX, 2019 / 2019 IBM Corporation20
AI Assistant Enhancements Generate a dashboard using a suggested chart as context Improved filter support Smarter related visualization recommendations
Home PageIBM Cloud / DOC ID / Month XX, 2019 / 2019 IBM Corporation22
Easy to accessresources for new users Step-by-step guided tours (withAppCues) How-to catalog with newprofessionally made videos Quick access to the SamplesIBM Cloud / DOC ID / Month XX, 2019 / 2019 IBM Corporation23
Pricing and LicensingIBM Cloud / DOC ID / Month XX, 2019 / 2019 IBM Corporation24
New Analytics Viewer LicenseExisting Information Distribution Licensewill be renamed to Analytics ViewerAdded functionality users will now be ableto run dashboardsYou will need to give these users runaccess of the dashboards they will needto accessThere are no changes to the existingreporting capabilities they will still needan Analytics User license to run promptedreportsIBM Cloud / DOC ID / Month XX, 2019 / 2019 IBM Corporation25
Useful linksMain Cognos Analytics page Free Trial– http://www.ibm.biz/cognosanalyticsCommunity:– nalytics/Documentation– http://www.ibm.com/support/knowledgecenter/SSEP7J 11.0.0/Upgrade Central– ustomercenter/upgrade.html
Supporting custom visualizations (D3, Highcharts, etc) Custom visualizations can be upl