Transcription
WORKFORCE MOBILITYBENCHMARK REPORT:VEHICLE EDITION2017
CONTENTSINTRODUCTION24VEHICLE ALLOWANCESCost Benchmarks: Vehicle AllowancesWhat do people like most about allowances?What do people like least about allowances?Monthly tax waste in a 800 allowance2021222223KEY FINDINGS3MARKET CHALLENGESMETHODOLOGYRespondents by IndustryRespondents by Annual RevenueRespondents by Organization SizeVehicle Program Type67778CENTS-PER-MILE (CPM)Cost Benchmarks: Cents-per-mile (CPM)What do people like most about Cents-per-mile reimbursement?What do people like least about Cents-per-mile reimbursement?Managed Cents-Per-Mile (CPM) programs2425262627VEHICLE PROGRAM POLICYInsurance VerificationSafe Driving IncentivesMotor Vehicle Record (MVR) ChecksDUI/DWI Risks910111111FIXED AND VARIABLE RATE (FAVR)Cost Benchmarks: Fixed and Variable Rate (FAVR)What do people like most about FAVR?What do people like least about FAVR?28293030APPS IN THE MOBILE WORKFORCEImpact of Using Mobile Mileage Capture1212COST BENCHMARKS BY PARTICIPANTAverage Direct Spend per ParticipantUS National Average Fuel PricesAverage Reported Business Mileage per ParticipantCosts per Business MileVehicle Program Ownership131414141515COMPANY-OWNED VEHICLESCost Benchmarks: Company-owned VehiclesWhat do people like about company-owned vehicles?What do people like least about company-owned vehicles?Personal use of Company-owned vehicles1617181819
INTRODUCTIONWelcome to Runzheimer’s 11th annual Workforce Mobility Benchmark Study.Why do we perform this study year after year? We do it because we arecommitted to helping companies understand leading practices for vehicleprograms and develop strategies that align with their company objectives.Also, by evaluating best practices across many industries and vehicleprogram types, we continue to deliver technologies and services that alignwith the direction of the mobile and digital workplace.As the experts in vehicle reimbursement programs, we monitor trendsacross industries and company sizes while also aggregating study responsesfrom hundreds of companies in order to provide current benchmark data.This data will help you understand areas of risk, compliance gaps, financialcosts, perceived administrative burdens, and overall fairness to employeesfor each vehicle program approach.Understanding practices among industry peers (external benchmarking) canprovide competitive insights and help companies accomplish their strategicgoals. That’s one reason why companies consult with Runzheimer – to gaininsight into vehicle program practices among industry peers and createstrategic vehicle program policies.Reducing risk and improving compliance are at the forefront of thechallenges organizations face today. These add to the challenges ofmonitoring spend, reducing administrative burdens, and providing deepinsights into field activity and performance. The world is changing andwe are committed to helping you optimize your mobile workforce andaccomplish your strategic goals.2KEYFINDINGS
Mobile Mileage Capture saves employeestime and saves companies moneyManaging accident risk is achallenge for employersEmployers have opportunities to increasevisibility into mobile workforce activities Automated mileage capture reduces administrativeburden on employees by up to 84% vs. manualmileage logging and reporting Driver safety is a priority for 80% ofcompanies1, but 62% don’t check motorvehicle records on an annual basis Among companies that use mobile technology tocapture employee mileage, only 33% report usingthat data for additional insights into their mobileworkforce Companies report that using mileage capturetechnology led to an average 17% reduction inreimbursement spend per mileADMINISTRATIVEBURDENREIMBURSEMENT SPENDVehicle reimbursement programs arebecoming more affordable The average direct spend per business mile wasreported at the lowest rate in the past five years( 0.54 per business mile).RATE OF DIRECT SPENDOPPORTUNITY TO INCREASEAWARENESS OF DRIVING BEHAVIOROPPORTUNITY FOR MORE INSIGHTSCompany-owned vehicles remain the mostexpensive option for employers Companies report that fleet vehicles cost,on average, nearly 15% more than vehiclereimbursement programs.REIMBURSEMENT COSTCOMPARED TO FLEET VEHICLES3
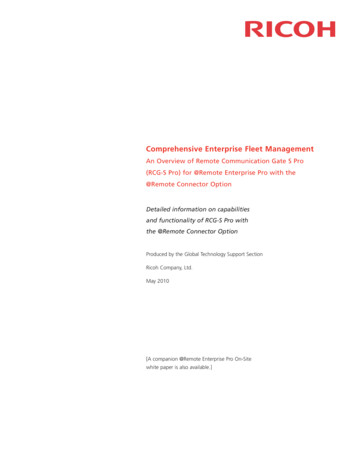
MARKET CHALLENGESCompanies report three common challenges regarding vehicle programs.1234Comparing against best-in-class firmsin respondent industriesMany companies use benchmarking to measuretheir policies and practices against competitorsand identify opportunities for improvement.Optimization of program managementand administrative processesAs technology improves, expectations increasefor simplified processes and streamlinedprogram management across all expensemanagement categories.Understanding whether vehicleprogram spending is accurateBusiness mileage reimbursement is a top-10 expensecategory6 and results in high pressure on organizations toimprove insight into spending. Despite this, the most commonmethod of mileage reimbursement involves employeesmanually entering mileage into an expense report.Companies can address many of these concerns byleveraging mobile technology to streamline this segmentof expense reporting.DID YOU KNOW?Nearly 75% of companies benchmark against others and industries2Runzheimer delivers thousands of benchmarks each year to clientsin more than 200 industries3DID YOU KNOW?Streamlining processes is a key component in minimizing the costof expense reporting4Nearly half of companies identify the elimination of manual and paperbased processes as a top business pressure for managing expenses4The top goal for improving T&E for 66% of companies is: Simplify theprocess for employees and managers5DID YOU KNOW?Using mobile technology helps companies capture expenses at theearliest possible moment7Standardized mileage records and improved accuracy helpcompanies increase visibility into spendMobile technology creates an 84% reduction in employeeadministrative burden for mileage reporting
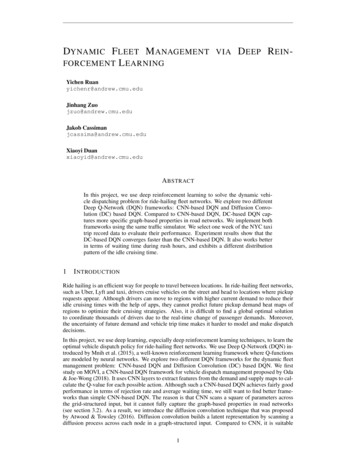
Popular Market Challenges19%How does mycompany’s businessvehicle programcompare againstBest-in-Class firmsin my industry?15%Are we doingenough to optimizeour programmanagement/administrativeprocesses?14%Are vehiclereimbursementsaccurate andrepresenting truebusiness miles?13%Are employeescomplying withvehicle programpolicies?12%Are employeessatisfied with mycompany’s businessvehicle program?Note: 27% of companies identified other top challenges5
METHODOLOGYKey details about the 11th Annual Runzheimer Workforce Mobility Benchmark Study700700 companies respondedto Runzheimer’sbenchmark studyFocusVehicle programpolicy, process,controls and costsData collectedJanuary - May 2017Responses verifiedMay - June 2017PublishedJuly 2017Participant Profile and MethodologyThe Runzheimer Workforce Mobility Benchmark Study collectsfinancial, operational, and program-specific data points to providetrends and comparisons among participant organizations. Thisstudy drills deep into vehicle programs including:Fixed and Variable Rate (FAVR)Company-owned (Fleet)Cents-per-mile (CPM)Vehicle Allowances6Organizations that participated in the Runzheimer WorkforceMobility Benchmark Study have US-based operations. Financialdata was captured for operations in only these locations andreported in U.S. dollars. An extensive validation process wasconducted following receipt of participant data. In cases where theaccuracy of information was in question and could not be validated,data was not included as part of the analysis. All data was collectedfrom study respondents for their prior completed fiscal year.
Respondents by IndustryParticipants in this year’s study represent many diverse industries. Thelargest samples came from manufacturing, wholesale, biotechnology,pharmaceuticals & medicine, healthcare/medical services and foodand beverage manufacturing. Here’s a breakdown by industry:Examining the RespondentsIndustry Classification%RespondentsRespondents by Annual RevenueManufacturing9.84%This study also represents a range in scale based on annual revenue as reflected below.Wholesale – Other7.73%Biotechnology, Pharmaceuticals & Medicine7.26%Healthcare / Medical Services6.09%Food & Beverage Manufacturing5.39%Food Service4.92%Business / Professional Services4.68%Retail4.45%Alcoholic Beverage Wholesale3.75%Medical Equipment & Supplies3.75%Construction Materials3.51%Chemical Manufacturing3.28%Respondents by Organization SizeConstruction / Home Improvement3.04%Transportation / Trucking2.58%Runzheimer works with mobile workforces of five employees through thousands.This benchmark study represents a diverse sampling of company sizes as seen below:Construction & Hardware Materials Wholesale2.11%Consulting2.11%Machinery & Equipment Manufacturing2.11%Telecommunications1.87%Utilities / Energy1.87%Agriculture / Mining1.64%Machinery Wholesale1.41%Petroleum and Natural Gas Extraction1.41%Education1.17%Grocery Wholesale1.17%Non-Profit1.17% 13% 2- 10 million2824%19%10%%19% 13% 11- 49 million 21% 50- 499 million 18% 500 million 1.5 billion35% 1.5 billionLess than 250251 - 1,0001,001 - 4,0004,001 - 10,000More than 10,001Other11.69%7
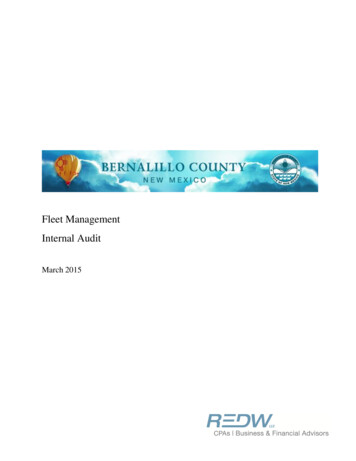
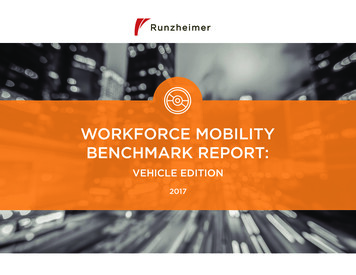
Examining the Respondents Cont’dVehicle Program TypeFrequency of Vehicle Program Types1Different vehicle programs are designed to meet the uniqueobjectives of each business, and most organizations opt for ablended approach rather than single strategy to manage frequentand infrequent drivers differently. While Cents-Per-Mile (CPM) isthe dominant program, it is usually paired with another method forfrequent/high-mileage drivers.Many organizations manage CPM separately from other vehicleprograms, and this fragmented ownership can conceal risks andinflate costs. A centralized approach to vehicle program managementhelps organizations better manage cost, reduce risk and increaseemployee satisfaction.DID YOU KNOW?80%of companies havemore than onevehicle program8866%Cents-per-Mile22%Company-owned Vehicles7%Vehicle Allowance5%Fixed and Variable Rate
VEHICLE PROGRAM POLICYJob responsibilities was the most commonly reported factor (56%) for including employees in vehicle programs. Theamount of business mileage (23%) and job title (21%) also were common factors for determining employee eligibility.Job Responsibilities56%Amount of Business Mileage23%Job Title21%The majority of companies (83%)report having a vehicle policy.Most organizations (59%) requireemployees to sign the policy.59%A policy exists andemployees sign it24%A policy exists butemployees do not sign it17%No policy exists9
Vehicle Program Policy Cont’dInsurance VerificationThe majority of organizations (73%) include minimum levels of insurance as part of their vehicle program policy.Most of those organizations (66%) also verify insurance coverage for participants.66%3%7%24%Company policy existsANDInsurance is verifiedCompany policy does not existANDInsurance is verifiedCompany policy existsANDInsurance is not verifiedCompany policy does not existANDInsurance is not verified!!DID YOU KNOW?Fortune 500 companies that verify insurance as part of a vehicleprogram average 90% compliance1010DID YOU KNOW?70% of Fortune 500 companies with reimbursement polices withholdreimbursements when participants are out of compliance10
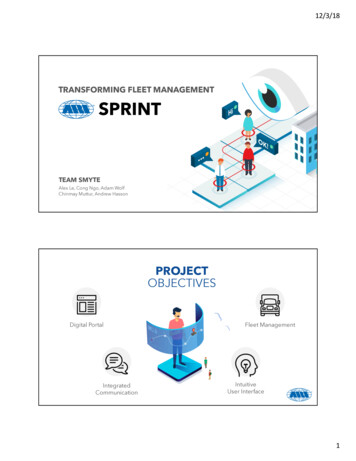
Safe Driving IncentivesMotor Vehicle Record (MVR) ChecksThe majority of study respondents(91%) report that safe drivingincentives are not part of theircompany’s vehicle program policy.Most organizations (62%) report that they do not performMVR checks, or only check prior to hiring an employee. Someorganizations (26%) report performing motor vehicle record(MVR) checks on an annual basis.Not Incentivized91%Incentivized9%62%Do not performMVR checks or onlyprior to hiring26%DUI/DWI RisksPerform annualMVR checksA majority of organizations (65%) havea policy of revoking driving privilegesfor employees who are convicted ofdriving under the influence. Alcoholis a contributing factor in 39% of allwork-related traffic crashes13, yet jobdismissal was cited as the penalty byonly 25% of responding organizations.65%Drivingprivilegesare revoked25%JobdismissalMVR checks are runseveral times a year10%There is nopenaltyDID YOU KNOW?In 2014, crashes involving vehicles on public roadways were the leading cause of work-relatedfatalities, accounting for 23% of all workplace fatalities1312%DID YOU KNOW?Nearly 50% of business driving accidents occur after five years of tenure11DID YOU KNOW?On-the-job distracted driving crashes annually cost employers anestimated 4.3 Billion1211
APPS IN THE MOBILE WORKFORCEImpact of Using Mobile Mileage CaptureAmong respondents, 34% report using a mobile app for business travel booking purposesand 18% report using a mobile app for expense reporting purposes. A growing number oforganizations report using a mobile app to capture and report business mileage.Organizations with mileage reimbursement programs report usingmanual mileage entry into a spreadsheet or system as the mostfrequent method of mileage reporting (51%). A larger number oforganizations report using automated mileage capture than in theprior year (41% vs. 29%).Manual Log Entry intospreadsheet or system51%41%AutomatedMileage Capture14%Business mileagecapture & reporting18%Expensereporting3434%%None ofthe aboveTravelbookingAmong respondents that use mileage capture apps for business purposes, 33% reportusing the data generated through mileage capture activities to gain insight into fieldworkforce activities. Territory intelligence (8%), optimization of territories (13%), andefficiency improvement (12%) were cited as ways companies use the data. As workersbecome increasingly mobile, opportunities to understand field workforce activities grow.Gain territoryintelligence8%Improve internalefficiencies12Optimize territoriesNone of the above12%13%67%33%Gain insight intofield workforceOBDII / TelematicsDevice8%Companies that participated in the study report that using mileagecapture technology led to a 17.5% average reduction in direct spendper business mile. Mileage reporting accuracy improves when usingautomated mileage capture, and that influences the reduction.DID YOU KNOW?A company with 3M in reimbursements can save 525,000per year by using mileage capture technologyWhen using mileage capture technology in their vehicle programs,companies report an average of 18.9% lower total costs perbusiness mile. Standardized mileage data and reporting automationinfluence this reduction in support costs.DID YOU KNOW?Automated mileage capture reduces administrative burden byup to 84% vs. manual mileage logging14
COST BENCHMARKS BY PARTICIPANTThe average annual direct spend per participant was 8,480. Support costs decreased from the previousyear to 664, bringing the total cost per participant to 9,144 – a 13% decrease from prior year. 8,480 664annual direct spendper participantAnnual DirectSpend/Participantsupport costsDECREASE FROMPREVIOUS YEARAnnual SupportCosts/ ParticipantTotal AnnualCosts/Participant 9,144total cost per participant13% DECREASE FROMPREVIOUS YEARSupport Costs as% of Direct SpendTotal VehicleCosts as % ofRevenueParticipantsas % of TotalEmployeesParticipants Servedby 1 Support Full-TimeEquivalentAverage 8,480 664 9,1447.83%0.68%17.03%40725th Percentile 5,680 469 6,1493.84%0.58%11.75%98Median 7,320 600 7,9205.34%0.66%17.86%18275th Percentile 9,901 921 10,8239.60%0.77%19.84%44013
Cost Benchmarks by Participant Cont’dAverage Direct Spend per ParticipantThe average direct spend per participant decreased14% compared with the prior year results of 9,843.National average fuel costs continue to trend lowerthan previous years, and the decrease is reflectedin the average direct spend costs collected for thisstudy. A lower reported number of business milesper participant may also influence the decreasedaverage direct spend.US National Average Fuel PricesThe average US price per gallon of self-serve,regular fuel remained lower than the 2015 averagethroughout 2016. This is a 12% annual reduction inthe average price compared with 2015. 9,697 9,843 8,48014% decrease inaverage direct spendper participant in2016 than 2015201420152016 3.38 2.43 2.1412% lower annualaverage fuel price in2016 than 2015201420152016Average Reported Business Mileage per ParticipantOrganizations reported a 9% lower average numberof annual business miles per program participantcompared with the previous year. Increased use ofmileage capture technology is reflected in lowerreported mileage. This could also be influenced byreporting on programs for occasional businessdrivers, smaller field territories, and a larger numberof employees driving for business purposes.1415520 1 3 106 1 1 8852014201520169% lower averagenumber of annualbusiness miles perparticipant in 2016than 2015
Costs per Business MileThe average direct spend per business mile decreased 9% compared with the prior year. The averagedirect spend was 0.54 per mile, with support costs of 0.05 per mile for a total cost per business mileof 0.59. This reflects lower overall vehicle ownership and operating costs - including fuel costs.15Direct Spend perBusiness MileSupport Costs perBusiness MileTotal Costs perBusiness MileSupport Costs as %of Direct SpendAverage 0.54 0.05 0.599.25%25th Percentile 0.46 0.04 0.503.84%Median 0.53 0.05 0.585.34%75th Percentile 0.62 0.06 0.689.60%Vehicle Program OwnershipThis benchmark includes responses from several key vehicleprogram owners. In most cases, Human Resources (28%) andAccounting/Finance (22%) reported owning their company’svehicle programs in this study.9% decrease inaverage direct spendper business milecompared to prior yearHuman Resources27.71%Accounting / Finance22.29%13.25%OperationsFleet Management9.04%Purchasing / Procurement7.83%Administration7.23%Sales / Marketing7.23%No Central Department Has OwnershipCorporate Services3.01%2.41%15
COMPANY-OWNED VEHICLESCompany-owned vehicle programs, also referred to as fleet, are one of the most traditional approaches. Unlike otherprograms, fleet vehicles are the property of the employer and can be reassigned to new employees as necessary.For this study, the most common industry segments reporting oncompany-owned vehicle programs include:Manufacturing16Healthcare/Medical ServicesWholesale
Company-owned VehiclesThe average annual direct spend per participant for company-owned vehicle programs was 11,247, whilesupport costs per participant were 1,097, for a total annual cost per participant of 12,344. Even if youaccount for the average personal use chargeback of 132 per month, the average total cost per participant forcompany-owned vehicles ( 10,760) is 15% higher than the average across all program types ( 9,144).Average25th PercentileMedian75th PercentileAnnual DirectSpend/ ParticipantAnnual SupportCosts/ Participant 11,247 1,097Total Annual Costs/ Participants as %Participantof Total Employees 12,344Direct Spend perBusiness Mile17.00% 0.55 8,995 667 9,6618.00% 0.43 10,540 1,000 11,54010.00% 0.56 12,810 1,521 14,33130.00% 0.63Total Annual Costs per Participant 9,129The average cost per participantfor company-owned vehiclesis 15% higher than the averageacross all program types.DID YOU KNOW?15%Fixed and Variable Rate (FAVR)On average, FAVR Programsare 15% less expensive perparticipant than Company-ownedvehicle programs 10,760Company-Owned VehiclesNote: Total company-owned vehicle annual cost includes average personal use chargeback17
Company-owned Vehicles Cont’dWhat do people like about company-owned vehicles?Company-owned vehicles are often perceived as an employeebenefit, and nearly half of benchmark respondents report thatthe perceived benefit is what they like most about the program.Another popular aspect of this program is control over vehicletypes – in fact, some companies wrap vehicles with logos andtaglines to optimize their vehicle investment.Perceived asa benefit49%Control overvehicle types28%Predictablelease costs23%What do p
Key details about the 11th Annual Runzheimer Workforce Mobility Benchmark Study The Runzheimer Workforce Mobility Benchmark Study collects financial, operational, and program-specific data points to provide trends and comparisons among participant organizations. This study drills deep into vehicle programs including: Fixed and Variable Rate (FAVR)