Transcription
2019 COSTS OFBUSINESS TRAVEL
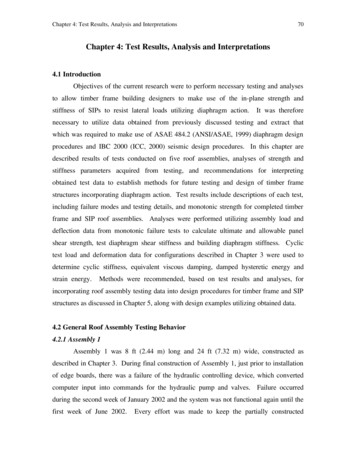
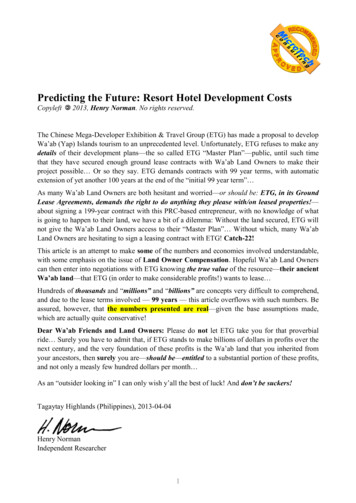
Travel and expense is a big line on any business’s budget. Emphasis on the travel.Companies in the U.S. will spend 111.7 billion to send employees on over 117 million businesstrips in 2019.1 Business travel costs have increased steadily in recent years and this trend isexpected to continue in 2020. Runzheimer performed a study to see how business trip costsvary around the U.S. The most expensive destinations might surprise you.Business travel to high cost areas can range as much as54% higher than the U.S. averageThe average domestic U.S. business trip lasts about three days.2 Many people think ofairfare as the major business travel expense, but it only makes up 34% of a typical businesstrip cost. Lodging, meals and ground transportation make up most of a business traveler’sexpenses today. This is expected to remain the same through 2020.Average business trip cost: 1,293BUSINESS TRIP COSTLODGING28%MEALS19%AIRFARE34%CAR RENTAL18%EXPECTED BUSINESS TRAVEL COST INCREASES IN 20203AIRFARE.5 - 1% increaseGROUND TRANSPORTATION2% increaseHOTEL2 - 3% increase
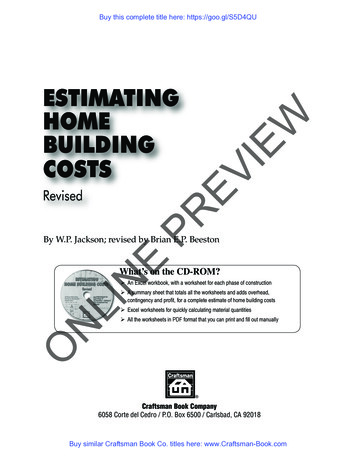
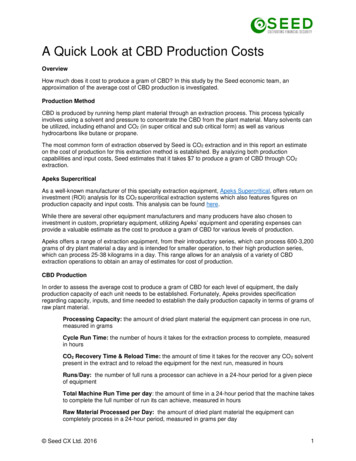
LOCATION MAKES A DIFFERENCEAlthough workers don’t always choose where business travel takes them, the location can havea big impact on trip costs. When looking at the most expensive states for business travel, certainregions come to mind. The Northeast and the West Coast are among the most expensive regionsfor business travel. But other expensive states are not clustered into a single area. Additionally,trip costs are not only driven by the state where employees travel. Costs in specific metropolitanareas also make a big impact on business trips.15 MOST EXPENSIVE STATES FOR BUSINESS TRAVEL1Hawaii2 Massachusetts3 California4 Vermont5 Washington6 Rhode Island7 New Jersey8 New Hampshire9 Connecticut10 New York11 Oregon12 South Carolina13 Florida14 Minnesota15 Maryland
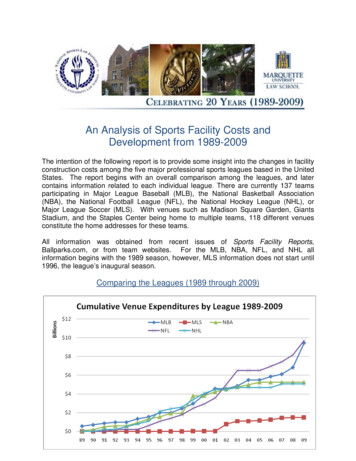
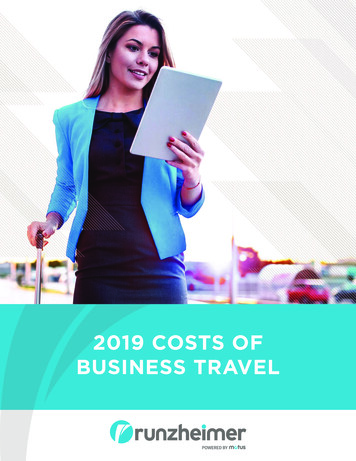
MOST EXPENSIVE CITIES FOR BUSINESS TRAVELERSPrices can vary widely between cities themselves and the areas that surround them. Add up thecosts of lodging, ground transportation and meals for a three-day/two-night trip in a major city.It’s likely to cost up to 55% more than the average destination. Taking a city-by-city approach isthe most accurate way to analyze business travel expenses.12 Boston. 1,2094123 San Francisco. 1,2094 Seattle. 1,0892143New York. 1,306811055 San Jose. 1,0316 Los Angeles. 1,0287 Honolulu. 9848 Newark/Jersey City. 9779 San Diego. 965610 Chicago. 95091111 Charleston. 94712 Portland. 9407131513 Austin. 93214 Minneapolis. 92715 New Orleans. 923New York City, San Francisco and Honolulu have gaineddeserved reputations for being expensive areas. But some ofthe most expensive cities are surprising. Many of these citiesare expensive for business travel because of high hotel costs,but the reasons behind these rankings are not always the same.For example, New York City has higher meal and hotel costs,but below average car rental costs. Boston has above-averagecosts for car rental, meals and hotels. Spending a little extra ona hotel may be a good investment – hotel experience is a bigpiece of employee trip satisfaction.4Many of these cities areexpensive for business travelbecause of high hotel costs.Meals are another travel expense that should not be overlooked.Instead of using a one-size-fits-all approach, setting per diemson a per-city basis can make travel expenses more predictable.Knowing high cost areas is not enough. Meal costs in citieslike Buffalo, Albuquerque and Sacramento can be 20% moreexpensive than the average business trip.It is important to understand the context of each trip whenanalyzing travel expenses. These insights can help a widerange of professionals. Finance professionals can forecast moreaccurate travel budgets. Event planners can understand the lessobvious costs of locations they choose. City officials can makesure that their cities are competitive destinations to attractbusiness travelers. There are new options to enable smart, costeffective choices. Organizations can take advantage of locationintelligence to understand the costs of business travel in detail.Meal costs in cities likeBuffalo, Albuquerque andSacramento can be 20% moreexpensive than the averagebusiness trip.
METHODOLOGYRunzheimer analyzed travel cost data from 60 of the most common destinations for U.S.domestic business travel for this study. Airfare costs were calculated using median values for14-day advance airfares.Ground transportation, meal and lodging costs were calculated using these assumptions:HOTEL STAYTHREE MEALSCAR RENTALTwo nightsBreakfast, lunch, dinner½ day on arrival, 2 full days,and ½ day on departure dayReady for a deeper insight into your travel program?Contact Runzheimer to learn about using cost data to optimize business travel.Contact Us
Runzheimer is the premier relocation and livingcosts intelligence solution, powered by Motus.Understanding that today’s workforce is driven bydata, Runzheimer provides employers and theirmobile workers with the actionable insights andtools needed for a successful move. Our worldclass solutions support companies with everythingfrom equitable compensation calculations betweenmultiple locations to understanding relocation-relatedexpenses and needs. With comprehensive data,Runzheimer empowers employers to win the war fortalent while getting the most from their budget.1234Understanding the average cost of business travel. Certfiy. OfBusinessTravel.aspxInternational Business Trip Costs Remain Flat, While Domestic Trip Nights and Prices Increased. Travel Leaders 17-data-and-trends/2019 Global Outlook. Travel Leaders Network. iness Travelers Happy with Travel Experience Despite 54% Having Travel Mishaps. GBTA. shaps/info@runzheimer.com 800.558.1702 runzheimer.comCopyright 2019 Runzheimer
CAR RENTAL ½ day on arrival, 2 full days, and ½ day on departure day THREE MEALS Breakfast, lunch, dinner Runzheimer analyzed travel cost data from 60 of the most common destinations for U.S. domestic business travel for this study. Airfare costs were ca