Transcription
DYNAMIC F LEET M ANAGEMENTFORCEMENT L EARNINGVIAD EEP R EIN -Yichen Ruanyichenr@andrew.cmu.eduJinhang Zuojzuo@andrew.cmu.eduJakob Cassimanjcassima@andrew.cmu.eduXiaoyi Duanxiaoyid@andrew.cmu.eduA BSTRACTIn this project, we use deep reinforcement learning to solve the dynamic vehicle dispatching problem for ride-hailing fleet networks. We explore two differentDeep Q-Network (DQN) frameworks: CNN-based DQN and Diffusion Convolution (DC) based DQN. Compared to CNN-based DQN, DC-based DQN captures more specific graph-based properties in road networks. We implement bothframeworks using the same traffic simulator. We select one week of the NYC taxitrip record data to evaluate their performance. Experiment results show that theDC-based DQN converges faster than the CNN-based DQN. It also works betterin terms of waiting time during rush hours, and exhibits a different distributionpattern of the idle cruising time.1I NTRODUCTIONRide hailing is an efficient way for people to travel between locations. In ride-hailing fleet networks,such as Uber, Lyft and taxi, drivers cruise vehicles on the street and head to locations where pickuprequests appear. Although drivers can move to regions with higher current demand to reduce theiridle cruising times with the help of apps, they cannot predict future pickup demand heat maps ofregions to optimize their cruising strategies. Also, it is difficult to find a global optimal solutionto coordinate thousands of drivers due to the real-time change of passenger demands. Moreover,the uncertainty of future demand and vehicle trip time makes it harder to model and make dispatchdecisions.In this project, we use deep learning, especially deep reinforcement learning techniques, to learn theoptimal vehicle dispatch policy for ride-hailing fleet networks. We use Deep Q-Network (DQN) introduced by Mnih et al. (2015), a well-known reinforcement learning framework where Q-functionsare modeled by neural networks. We explore two different DQN frameworks for the dynamic fleetmanagement problem: CNN-based DQN and Diffusion Convolution (DC) based DQN. We firststudy on MOVI, a CNN-based DQN framework for vehicle dispatch management proposed by Oda& Joe-Wong (2018). It uses CNN layers to extract features from the demand and supply maps to calculate the Q-value for each possible action. Although such a CNN-based DQN achieves fairly goodperformance in terms of rejection rate and average waiting time, we still want to find better frameworks than simple CNN-based DQN. The reason is that CNN scans a square of parameters acrossthe grid-structured input, but it cannot fully capture the graph-based properties in road networks(see section 3.2). As a result, we introduce the diffusion convolution technique that was proposedby Atwood & Towsley (2016). Diffusion convolution builds a latent representation by scanning adiffusion process across each node in a graph-structured input. Compared to CNN, it is suitable1
for non-Euclidean, directional graph-based architectures such as road networks. Based on Li et al.(2017) and Oda & Tachibana (2018), we build up a DC based DQN framework with the same reward function and vehicle-customer matching policy as MOVI so that we can have fair performancecomparison between these two frameworks.We implement both CNN-based DQN and DC-based DQN using the same traffic simulator fromOda (2018) to compare their performance. We use NYC taxi trip record data as the dataset, whichincludes pick-up and drop-off dates/times, pick-up and drop-off locations, trip distances, etc. Forour evaluation, we use the trip records from Monday 6/6/2016 to Sunday, 6/12/2016. Experimentresults show that: the DC-based DQN converges much faster than the CNN-based DQN; the DCbased DQN works better in terms of waiting time during rush hours; the total amount of revenuefor drivers is relatively fixed whatever which DQN is used; average cruising time is similar for bothDQNs, but the DC-based method could be unfair for drivers, i.e., some drivers benefits more whilesome do not.2R ELATED W ORKIn ride-hailing fleet networks (e.g., Uber), drivers cruise vehicles on the street and head to locationswhere pickup requests appear. A dynamic fleet management should proactively dispatch vehicles tolocations where pickup requests are likely appeared in the future. In order to reduce drivers’ idlecruising times or passengers waiting times, many previous works on fleet management use modelbased or model-free methods to address this vehicle dispatch problem.Oda & Joe-Wong (2018) propose MOVI, a model-free Deep Q-network (DQN)-based frameworkthat learns the optimal dispatch policy. Since the complexity of the DQN grows exponentially withthe number of dispatches, MOVI takes a distributed approach: it streamlines the DQN training andlet each individual vehicle independently learn its own optimal policy. It builds a large-scale realisticsimulator based on 15 million taxi trip records and shows that the DQN dispatch policy outperformsa centralized receding-horizon control (RHC) policy proposed by Miao et al. (2016).Lin et al. (2018) also consider the large-scale fleet management problem, but they use multi-agentreinforcement learning algorithms. They propose contextual deep Q-learning and contextual multiagent actor-critic to tackle this problem. They also build a traffic activity simulator to evaluate thetheir algorithms. The framework is however incompatible with MOVI which only supports singleagent dispatching. We will defer the implementation of multi-agent algorithms for future works.Zheng & Wu (2017) study the urban taxi dispatching problem and model the interests of passengersand taxi drivers. They propose a stable marriage approach to dispatch taxis. Inspired by their work,we can also introduce the interests of passengers to MOVI, since now it only considers the feedbackfrom drivers’ side. Qu et al. (2014) also take a vehicle-centric approach as MOVI, but provide routerecommendations that aim to maximize individual drivers profits. Drivers profits can also be relatedto the reward function of Q learning. Miao et al. (2016) design a centralized Receding HorizonControl (RHC) framework, which serves as the baseline in MOVI. However, their framework ismodel-based, so cannot really capture the uncertainty of fleet management problem.33.1M ETHODSCNN- BASED D EEP Q-N ETWORKIn fleet networks, the reward function for a vehicle n is given by:tX(n)(n)(n)rt λbt0 ct0 ,(1)t0 t δ(n)(n)which is the weighted sum of the number of rides, bt0 and the total dispatch time, ct0 . The rewardfunction is not directly expressed as a function of the actions because the relation between actionsand reward will be learned by the network. Given the reward function for vehicles, the Q-valuefunction can be written as: X0(n)Q (s, a) max E[γ t t rt0 ](2)πt0 t2
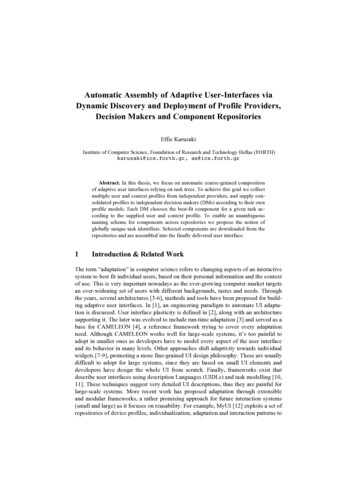
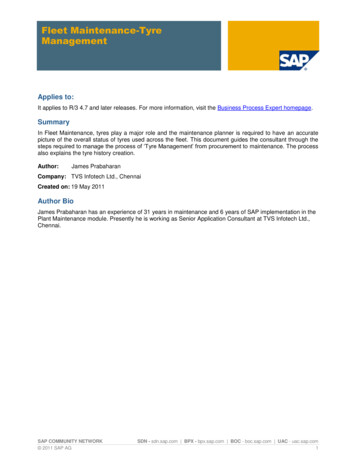
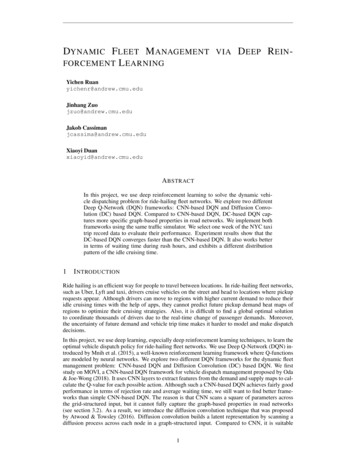
In the DQN for fleet management problem, the state means the current location and occupancy ofeach vehicle, while the action is where the vehicle should approach to pick up customers. Deepneural networks are used to model the relationship between input data and output Q-values. ForCNN-based DQN, it uses a deep convolutional net as displayed in Figure 1. The input to this DQNincludes the demand map that predicts where future requests will appear and the supply map thatindicates current locations and occupancy of all vehicles. Auxiliary features include current positionof the input vehicle, current time, day of week, etc. (see Table 2 in Oda & Joe-Wong (2018) for moredetails) The output of the network is a map of Q values, which represents the long-term expectedreward gain of moving to different locations. It can give us a probability distribution over all possibleactions the taxi can take to maximize the collected reward at each time step. The loss is calculatedby an estimate of the optimal Q-value as calculated with the current network:Li (θi ) E[(rt γ maxQ(s0 , a0 ; θi ) Q(s, a; θi ))2 ](3)0aθi withthe parameters from the previous iterations. That easily gives rise to unstable learning as thenetwork is learning from its own predictions. Next to that, reinforcement learning with a non-linearapproximator for the Q-function is also known to cause unstable conditions. This can be counteredby leveraging RMSProp optimization and using an experience replay to remove correlations. Bothlike the original DQN-paper by Mnih et al. (2015) suggests. This DQN is distributed in the sensethat every taxi agent in the simulation makes its own decisions unaware of the decisions being madeby the other taxis. The only information shared is the current state of the environment.Figure 1: Architecture of CNN-based Q network3.2D IFFUSION C ONVOLUTION - BASED D EEP Q-N ETWORKConvolutional neural networks (CNNs) scan a square of parameters across a grid-structured inputas the convolution operation, while diffusion-convolutional neural networks (DCNNs) Atwood &Towsley (2016) is for graph-structured data by scanning a diffusion-convolution operation over everynode. In contrast with standard CNNs, DCNN parameters are tied according to search depth ratherthan their position in a grid. Road network is a non-Euclidean and directional graph-based structureas shown in 2. Road segment road 3 is close to road 1 in distance but may not have similar speedor direction as road 2.Figure 2: Road NetworkThe diffusion convolution-based q-network architecture is illustrated in Figure 3. The diffusionconvolution (DC) operation learns latent representations of graph-structured data. The diffusionconvolutional activate Ztijk for node i, hop k, and feature t of graph a is given byXZaikt (Wkt )c ·A aik τait(4)3
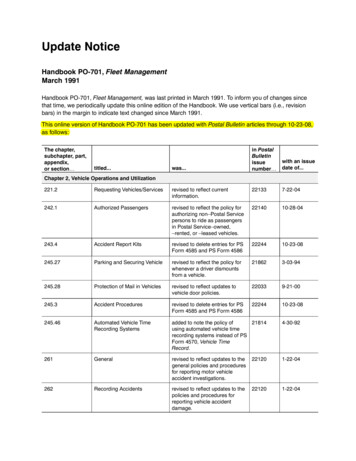
Figure 3: Diffusion convolution-based q-network architectureOur input matrices are demand and supply graph, Wt and Xt . For each center node in the grids,the action apace is 15 from the node in the center. Therefore, the convolutional filter for everynode is a 15 matrix A with the node in center. The feature map τ for each node is a 15 trip timematrix. All features pass through a DC layer where graph diffusion convolution is carried out ktimes with a filter of dimensions Mx My Ax Ay Each node in Wt and Xt is transformed toa diffusion-convolutional representation, which is k t matrix defined by k hops of graph diffusionover t features. The feature vectors from output Z of demand matrix and supply matrix representorigin and destination. Input them in fully-connected layers and output action values Q(s, a) foran action a. In addition to Zt , we also feed into the FC layer squeezed auxiliary features as in thebaseline model (see Figure 1).4E XPERIMENTS AND R ESULTSThis section will provide a brief description of the experimental results. It will start with a briefoverview of the data set and framework used. Next, it will continue with plots of the most importantgraphs related to the problem setting. The analysis and of these results follows in section 5.4.1DATA S ETWe used the simulator and the data of NYC Taxi and Limousine Commission taxi trip records fromMay and June 2016. The data set contains the pick-up and drop-off dates/times, pick-up and dropoff locations, and travel distances, real time rates etc. For our evaluation, we use the trip recordsfrom Monday 6/6/2016 to Sunday, 6/12/2016.4.2S IMULATORThe environment will provide rewards and respond to the actions that the algorithm takes. At eachtime step the simulator will create ride requests that will be matched to taxis by the Matching Policy.The Matching Policy is a simple greedy policy that takes the closest taxi available. If matched, thetaxi calculates the route to the destination and how long it will be busy acting out this action beforebecoming idle again.A second policy that interacts with the simulated environment is the Dispatch Policy. The task of thislearned algorithm is to predict where future requests will happen and to dispatch taxis proactivelyto make sure that it maximizes the reward defined above. The entire setup happens in a single agentso there is no explicit competition between the different taxis. Every taxi makes its decision withoutknowledge of the actions that others choose except from the current demand and supply heat maps.There is one common Q-network that is cloned and used by each taxi separately.4
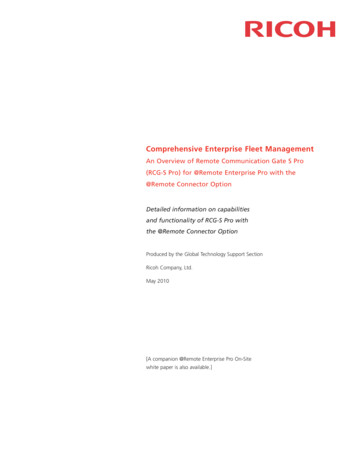
The demand and supply inputs to the network will be generated by the simulator at every step. Forthe DC based model, it also computes the estimated trip time maps. All input maps are divided into51 by 51 grids, i.e. there will be a total of 2601 different locations. In order to reduce the searchingspace, we limit the maximum distance a vehicle can move to 7, resulting in a 15 by 15 action space.4.3C ONFIGURATIONHere we list the parameters we used in the experiment. Unless specifically mentioned, two modelsshare the same settings. Trained for a total of 20,000 steps and used a replay memory of the 10,000 most recenttransitions. The original greedy value is 1.0, and decays linearly every 3,000 steps all the way to 0.1. A batch size of 128 experience records randomly drawn from the replay memory. RMSProp Optimizer with learning rate equals 0.00025, and momentum equals 0.95. Stabilizing learning with the double Q learning technique, updating the target networkevery 50 steps. The discount coefficient γ for future rewards equals 0.98. As per Oda & Joe-Wong (2018), for the baseline model, in the first 5000 steps, only α ofvehicles are allowed to move, where α increases linearly from 0.7 to 1.0.4.4R ESULTSThe following graphs compare the results for the two Q-network structures: the CNN-based and theDC-based.Figure 4 shows the evolution of the average maximum Q-value during training of the CNN-basednetwork. Figure 5 is the plot for the counterpart network. The DC-based model reached 16 ataround 600 steps and started decreasing, while CNN-based model reached 14 at around 700 steps.Figure 5: The average maximum Q-value forDC Q-networkFigure 4: The aver
such as Uber, Lyft and taxi, drivers cruise vehicles on the street and head to locations where pickup requests appear. Although drivers can move to regions with higher current demand to reduce their idle cruising times with the help of apps, they cannot predict future pickup demand heat maps of regions to optimize their cruising strategies. Also, it is difficult to find a global optimal .