Transcription
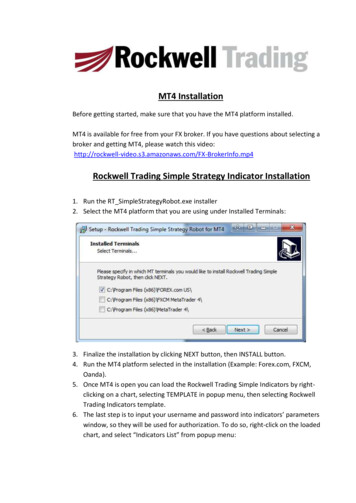
Our indicator 'Trexper' has used the calculation of the same infamous indicator named"Donchian channel" an indicator used in market trading developed by Richard Donchian . Itis formed by taking the highest high and the lowest low of the last n periods. The areabetween the high and the low is the channel for the period chosen in conjunction withanother powerful indicator named 'Moving Average Ribbon' which is a series of movingaverages of different lengths plotted at the same time on a chart. In our case, our indicatorusage 18 different lengths moving averages for the moving average ribbon, and the movingaverage is calculated based on Simple moving average (SMA) or Exponential moving average(EMA). The Donchian channel and the ribbon indicate the market trend direction. When thecurrent price is above the channel or ribbon it should clearly indicate bullish trend orbuyers getting optimistic and the bulls dominating against bears and when price is lowerthe channel or ribbon it should indicate bearish trend or sellers/bears dominating againstbulls. This ribbon and channel both acts also as dynamic resistance and support dependingon where the current price is floating. Price floating above the channel and ribbon will actas a support level and when price floating below the channel shall act as resistance andprice will feel difficulties to break above the channel and ribbon. With some slightlycomplicated calculation on the higher high and lower low from multiple timeframes of thesame security 'Trexper' generate potential long and short trade signals. It came along withsmall lines drawn on high or low of a price bar which pinpoints the highest high or lowestlow of the price for that certain financial instrument. Actually, our indicator is also usinganother powerful indicator to generate signals and they are Average true range (ATR) andTrue range (TR). Most contribution goes to average true range and true range for ourindicator to decide either a long or short signal.Features:- Powerful 5 concepts used in one. Donchian channel, Moving average ribbon, Averagetrue range, True range, Swing high and low.- Clearly shows support and resistance levels, as well as momentum and trend direction- Donchain channel and the ribbon indicate the overall market trend with the helpof EMA and SMA.- Dynamic resistance and support levels.- Generate potential long and short trade signals- Traders can determine the strength of a trend by looking at the distance between themoving averages ribbon.- ATR calculation method can be changed from normal (ATR) to and SMA version truerange inside setting by ticking and unticking the input function named “Change ATRCalculation Method?”.- Long and short signals can be turn off/on using “Show Buy/Sell Signals?”.
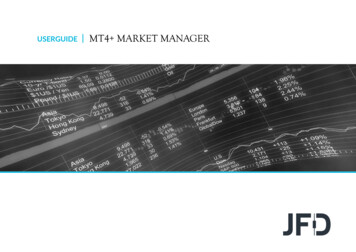
- Alert feature available for long and short signals.Important two main settings of Trexper indicator:1. ATR Multipliero ATR multiplier value lower can produce more signals which will be as more tradesopportunities but it can also lead to fake signals. Ao A retail trader should adjust the setting depending on the financial market, instrumentand timeframe as per required.o Basically, higher timeframe has more range in price so ATR multiplier can be sethigher.2. Reactor [0, 1]o Reactor can be a float or integer value from 0 to 1.o It is used to control the reaction of a signal from fast to slow 2-4 candle bars during thetime of a signal is generation.o Lower value either 0 to 0.4 can delay a signal speed 2-4 candle bars while higher valuefrom 0.5 to 1 can fasten the speed of a signal 2-4 candles ahead.How to trade using long & short signals?Long Signal:1) While a long signal generates, we see a star symbol with a long text right at thebottom of the candle bar where the signal was generated. This tell us a longsignal is ready to be entered. We are entering right at the closing price of thatcandle bar where the long signal was generated.2) Keep a Risk to reward as 1:1.5 for take profit level-1 and 1:2 for take profitlevel-2 (or max TP we can say)3) After the entry we should focus on Donchian channel & Moving average ribbon. IfDonchian channel & Moving average ribbon are below the price we can assumetrade will go fine for long as this indicates price trending upward. Good space ofgaps on upside between moving average of moving average ribbon indicates highervolatility or strength in momentum and bulls domination over bears.4) Three rules for exits. One rule is to exit when price hits our take profit levelseither 1:1.5 or 1:2 (Risk to Reward Profit Targets) or stop-loss (exit level) level.Second rule is to exit when price change direction or reverses from bullish tobearish which we get signal if price drives lower or crosses below theDonchian channel & Moving average ribbon. Last rule of exit for the older runningtrade position is when any opposite direction new signal emerges. It mean whenwe were holding a long position and if a short signal generates then we exit ourtrade for long position.
5) Risk to Reward ‘Profit level & Stop-Loss level’ can be set using the swing high andlow of the price which we can see on top and bottom of price high and low ashorizontal lines. We can set take profit level just above the previous swing high orlow levels and stoploss slightly lower the previous swing low or high levels.
Short Signal:1) While a short signal generates, we see a star symbol with a short text right atthe top of the candle bar where the signal was generated. This tell us a shortsignal is ready to be entered. We are entering right after the closing of thatcandle bar where the short signal was generated.2) Keep a Risk to reward as 1:1.5 for take profit level-1 and 1:2 for take profitlevel-2 (or max TP we can say)3) After the entry we should focus on Donchian channel & Moving average ribbon. IfDonchian channel & Moving average ribbon are above the price we can assumetrade will go fine for short as this indicates price trending lower. Good space ofgaps on downside between moving average of moving average ribbon indicateshigher volatility or strength in momentum and bears domination over bulls.4) Three rules for exits. One rule is to exit when price hits our take profit levelseither 1:1.5 or 1:2 (Risk to Reward Profit Targets). Second rule is to exit whenprice change direction or reverses from bearish to bullish which we get signal ifprice drives higher or crosses above the Donchian channel & Moving averageribbon. Last rule of exit for the older running trade position is when any oppositedirection new signal emerges. It mean when we were holding a short position andif a long signal generates then we exit our trade for short position.5) Risk to Reward ‘Profit level & Stop-Loss level’ can be set using the swing high andlow of the price which we can see on top and bottom of price high and low ashorizontal lines. We can set take profit level just above the previous swing high orlow levels and stoploss slightly lower the previous swing low or high levels.
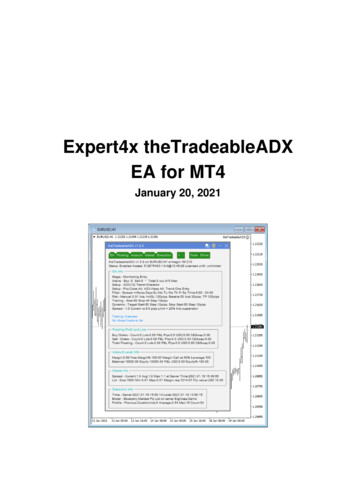
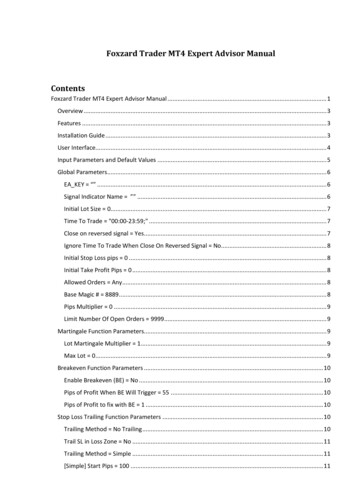
How to Set Alerts for Long & Short Signals?Step: 1 & 2 (Colored in Red Numbers)
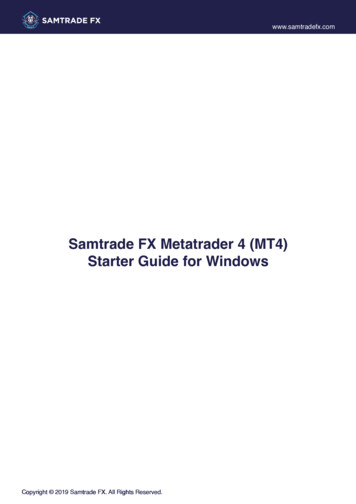
Step: 3
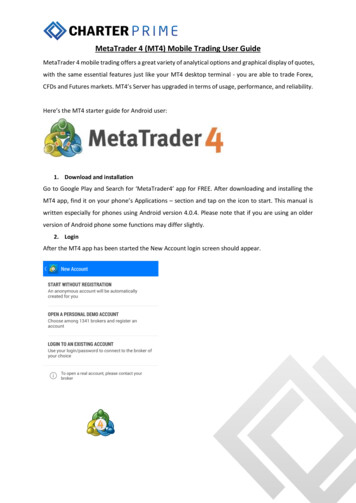
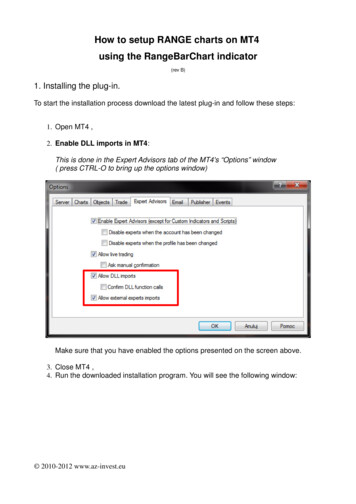
Step: 4 & 5
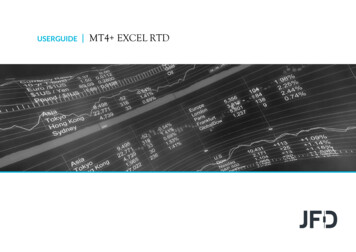
Step: 6Step: 7-Alert dialog box where we can see the alerts which we made and we can manage alerts from here likestop, remove, resume and add etc.
[Q & A Section]What is a Moving Average Ribbon?
The Moving Average Ribbon indicator is a series of moving averages of different lengthsplotted at the same time on a chart. The result is a ribbon appearance that gives a 3dimensional look.The ribbon is made up of actually 8 different length moving averages but here we have optionto either make 8 to 18 from indicator setting inside style tab by choosing which movingaverage to use and which not. In this indicator above for now we have used all 18-movingaverage from the indicator setting inside style tab but a trader can decide and use dependingon his/her requirements. An exponential moving average is used default but it can also usesimple moving average if we untick the input value named “EXPO MA” inside the setting ofthe indicator. The shortest moving average is called the base length. This is an input that canbe set in the properties of the indicator. By default, it is set at 5. The rest of the averages arebased off of the increment property, which is also defaulted to 5. The increment is the
amount added to each average. For example, the second line is set to a 10 period, the thirdline is set to 15 and so on. Changing either the base or the increment will allow us to adjustthe sensitivity of the indicator. Smaller numbers are more reactive to price movement andlarger numbers are slower acting or smoother.What is Ichimoku Cloud?Conversion Line (kenkan sen):
Conversion Line, is the mid-point of the highest and lowest prices of an asset overthe last nine periods. The Conversion Line is part of a larger indicator, called theIchimoku Cloud, which shows potential support and resistance areas based ondifferent timeframes.Base Line (kijun sen):The Kijun-sen, or base line, is an indicator and important component of theIchimoku Kinko Hyo method of technical analysis, which is also known as theIchimoku cloud. The Kijun-sen is the midpoint price of the last 26-periods, andtherefore an indicator of short- to medium-term price momentumLeading Span A (senkou span A):Senkou Span A, or Leading Span A in English, is one of five components of theIchimoku Cloud indicator. Leading Span A is a line used to measuremomentum and can provide trade ideas based on support and resistance levels.Leading Span B (senkou span B):Senkou Span B, also called Leading Span B, is one of five components of theIchimoku Cloud indicator. Leading Span B in works in conjunction withthe Senkou Span A line to form a cloud formation known as a "kumo." The cloudprovides support and resistance levels.Lagging Span:Lagging span it is created by plotting closing prices 26 periods behind the latestclosing price of an asset. . Many traders watch for the lagging span to crosswith prior prices to signal a potential trend change.Displacement:The distance between the two lines forms what is known as the cloud. There'sa forward-looking displacement on the Ichimoku (as you've probably noticed),so there will always be a cloud to the right of the price current price movement,which makes it 'predictive' in its own right.
The above mention feature are used in our Trexper indicator and their valuecan be adjusted inside the indicator setting which makes our Ichimoku cloudwhich we can see in above picture with color in lime.What is Pivot High/Low?Pivot Points (High/Low), also known as Bar Count Reversals, are used toanticipate potential price reversals. Pivot Point Highs are determined by thenumber of bars with lower highs on either side of a Pivot Point High. Pivot PointLows are determined by the number of bars with higher lows on either side of aPivot Point Low.
For example, a Pivot Point High, with a period of 5, requires a minimum of 11bars to be considered a valid Pivot Point. A minimum of 5 bars before and afterthe Pivot Point High all have to have lower highs.Calculation Pivot Point Highs are determined by the number of bars with lowerhighs on either side of a Pivot Point High.Pivot Point Lows are determined by the number of bars with higherlows on either side of a Pivot Point Low.
o Basically, higher timeframe has more range in price so ATR multiplier can be set higher. 2. Reactor [0, 1] o Reactor can be a float or integer value from 0 to 1. o It is used to control the reaction of a signal from fast to slow 2-4 candle bars during the time of a signal is generation. o L