Transcription
Metrics Dashboard DesignDesigning Effective Metrics Management DashboardsDesigners of metrics management dashboards needto incorporate three areas of knowledge andexpertise when building dashboards. They mustunderstand the dashboard users’ needs andexpectations both for metrics and for thepresentation of those metrics; they mustunderstand where and how to get the data for thesemetrics; and they must apply uniform standards tothe design of dashboards and dashboard suites inorder to make them ‘intuitive’ for the end-users.This paper outlines dashboard design best practicesand design tips, and will help dashboard designersensure that their projects meet with end-userapproval. It concludes with a checklist of designconsiderations for dashboard usability
Metrics Dashboard Design2Increasing User Adoption of Metrics DashboardsUsers turn to metrics management solutions to find out what is goingon with the business in order to make informed, reasoned decisions.Probably the mostcommon reasondashboards remainunder-used is thatthe dashboarddesigner did notunderstand the endusers’ needsGood metrics management dashboards show key performanceindicators (KPIs) in context so that they are meaningful, and presentthem in a way that allows users to instantly understand the significanceof the information. This presentation lets users quickly evaluate choicesand make decisions with full confidence that these decisions aresupported by facts.Dashboards are neither detailed reports nor exhaustive views of alldata. Good metrics management solutions can offer users the option to‘drill-down’ to as much detail as they require, or even link intoreporting systems, but these are only ancillary functions. The primaryfunction of metrics management dashboards is to support—eveninduce—pro-active decision-making.Know the End UsersUsers want dashboards that respond to their business requirements.There is no substitute for understanding end-users’ needs and gettinginvolved in dashboard development. Even more important thanunderstanding product capabilities is understanding the people whowill be using the dashboards, what they need to know to improve thebusiness, and what sort of dashboard organization and displays willwork best for them.Use Context to Make Metrics MeaningfulUsers need to understand what the metrics mean before they canmake decisions. Data is meaningful only in context.In order to easily understand metrics users must see them in context—their context. In fact, context and presentation are integral to anymetric; without them the metric is simply meaningless numbers.Dashboard designers should take time to learn what contextualinformation users require in order for metrics to be meaningful for themand to facilitate decisions and actions.
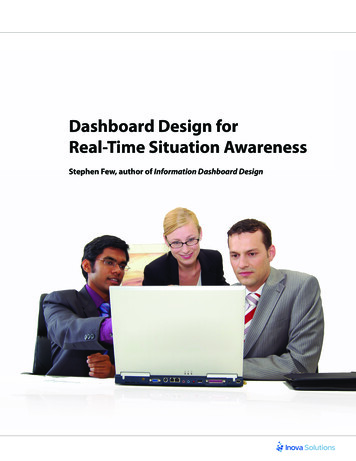
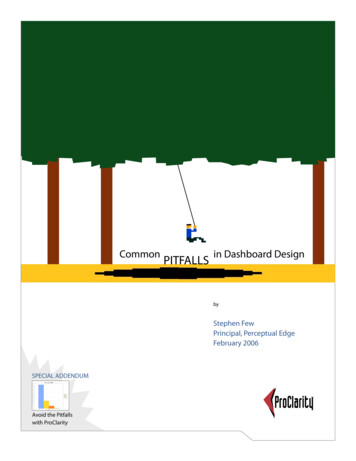
Metrics Dashboard DesignContext includesthe date and timethe metric wasupdated. In manycases, a metric hasvalue only if theuser knows whenthe data wasretrieved.3Contextual information will differ depending on the specific area beingmanaged. For example, dashboard users in finance may need to trackactual expenditures against budget targets, while a support desk mayneed to track the number of trouble tickets exceeding mean resolutiontimes by more than 15 percent. In an environment where a metricsmanagement solution is being used to help improve processes, usersmay need to monitor trends, compared to performance during anothergiven period.Figure 1: Use displays to show context and progress towards targets.The much used pie charteffectively shows proportions, butdoes not tell anything aboutperformance or progress towardstargets.A simple bar chart effectivelyshows proportions of allocatedbudgets and monies spent,targets and performance:progress towards targets (dottedlines).Whatever the case, the dashboard designer should spend timeunderstanding not only the data behind the indicator, but also the datathat creates the context for the indicator (such as revenue targets, timeperiod coverage, maximum capacities, etc.). This rule should guide thedashboard designer through every step of design, from data gatheringto detailed composition of displays.
Metrics Dashboard DesignData RetrievalUsers need to have confidence in the integrity of the metrics they useto manage the business. They need to know that they are acting onfacts, not guesses.If a metricsmanagementsolution cannoteasily bringtogether data fromdisparate sources, itmay be worthwhileconsidering anothersolution.There is no easy formula that will guarantee the value of data broughtto dashboards. Nonetheless, it is essential to determine the sources,ownership and quality of the data to be used before starting dashboarddesign.The following guidelines will help dashboard designers deliver themetrics dashboard users need and will use.Identify KRAs and KPIsUsers need to know their metrics so they can make informed decisionsfor their areas of responsibility.A common—and effective—approach to understanding what usersneed to know is to work with end users to identify the key results areas(KRAs) for which they are responsible, then the key performanceindicators (KPIs) they need to monitor and manage to improveperformance in their areas of responsibility.Get the Data Whatever Its Format or LocationUsers want metrics derived from complete data, no matter where thatdata is stored, so they do not have to guess.Once the metrics users require have been identified, the data should beretrieved, no matter where it is located.A well-designed metrics management dashboard provides both acurrent synthesis and details of key metrics. Often the data required toprovide this synthesis and these details is spread across a variety ofdatabases technologies and even spreadsheets at different physicallocations. It is, nonetheless, essential that all required data be retrieved.A dashboard that provides metrics based on partial information is oflittle value when a global view is needed.4
Metrics Dashboard Design5Refresh the Data According to Users’ NeedsUsers need metrics that are up to date so they can act on current andprobable future situations.A good metricsmanagementsolution will be ableto play a role inensuring dataquality bymonitoring datasources and byautomating datatransformations.The timeliness of a metric is as important as the metric data itself. Findout how current data must be for it to be valuable to users, and set thepolling frequencies for the queries that retrieve the data accordingly.Metrics used to monitor hourly call levels to a help desk are worse thanuseless if data is gathered every Sunday at 6 a.m. Similarly, if salespersonnel report sales once a week on Thursdays, there is little point inpolling the database every hour for updates to this data.Usability Design Best PracticesUsers do not want to be surprised by the dashboard design. They needto be able focus on metrics and decisions.A metrics management dashboard should function for the user in thesame way that an automobile dashboard or traffic signs function for anautomobile driver.Just as a driver knows to stop at a red light, a metrics dashboard usershould understand without deliberation that, for example, a redthermometer means that corrective action is required. This requirementmeans that dashboard design must be consistent with common usageand practices as well as across all dashboards.Offer Users a Choice of ViewsUsers need to be able to view metrics differently, so they can see therelationships between the metrics that affect their specific concerns.Users may need to view metrics differently, and dashboards shouldallow them to do this. For example, financial metrics dashboardsshowing actuals versus budgets could offer views by department , andby line item or profit center.Whatever the view offered, dashboards should be consistent, and thecurrent view should be clearly identified by titles and labels.
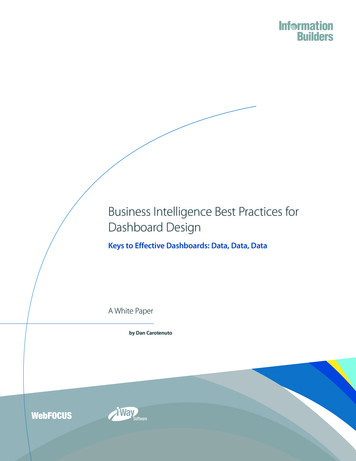
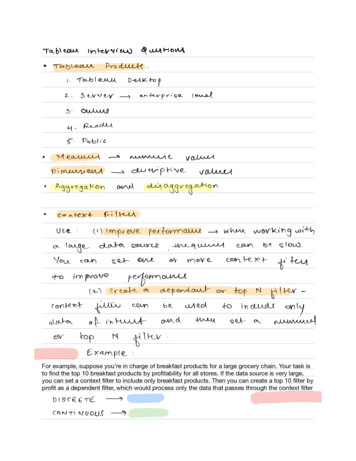
Metrics Dashboard Design6Use Commonly Accepted Symbols, Colors & OrganizationUsers need to understand dashboards instantly and without specializedtraining so they can focus on their jobs, not on deciphering data.PureShareAccelerators arebest practicesbased, ready-todeploy dashboardtemplates forspecific areas ofbusiness.Use symbols, colors and organization in ways that are commonlyaccepted and therefore easily understood.Figure 2: Use color to improve communication of key information.Users might be confused by theuse of color combined with theexpressions on the faces.Red usually means that somethingis amiss, but the red face has asmile. The user will not know ifaction is required.Green usually means thateverything is going well. Themessage is reinforced by thesmiley face.Red usually means action isrequired. This message isreinforced by the frown.For example, red is the color most commonly used to identifysomething that requires attention. Therefore, unless there is acompelling reason to use another color to identify, for example, salesthat are below targets, use red to communicate this information.Similarly, where appropriate use commonly accepted symbols, such asstop signs or caution signs, rather than new symbols that users willhave to learn.Organize information using commonly accepted norms. Generally, thismeans that the most important information is placed at the top of adashboard and secondary information and details are placed below.
Metrics Dashboard Design7Note, however, that symbols may differ between countries andcultures. Take these differences into account if the dashboards will beused in different parts of the world.Establish Clear Dashboard Navigation & HierarchiesUsers need to be able to find information—more detail, less detail or adifferent view—instantly.Few dashboards are deployed individually. Typically users require asuite of dashboards. Clearly establish an organization for the dashboardsuite. Use an easily recognizable hierarchy of dashboards andconsistent links for navigating between dashboards.A good rule is to use the dashboard with top-level information for auser’s area of responsibility as that user’s entry point, then provide linksfrom individual metrics to dashboards with more details about thatarea of the business. This is known as ‘drill-down’ capability.Maintain Consistency of DesignUsers do not want to have to learn how to read each dashboard.Establish and implement a limited set of templates with consistent useof color, symbols and navigation, and use them throughout thedashboard suite.Presentation of information on dashboards should be consistent. Forexample, if dashboards show trends, percentages and absolutenumbers, place each type of information in the same place on everydashboard and use the same display for these types of informationacross similar dashboards.For example, if thermometers are used to show progress of revenueagainst targets in the company financials roll-up dashboard, do not usegas gauges to show revenue against targets in the regional detaildashboards; use thermometers.Similarly, if display threshold of red-yellow-green are set to 40, 60 and80 percent for the company roll-up dashboard, use the same thresholdsfor the details unless there is a compelling reason to do otherwise.
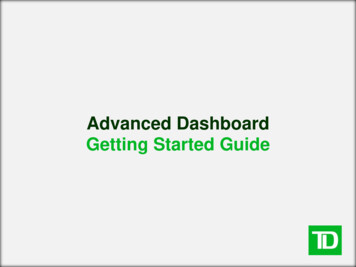
Metrics Dashboard Design8Figure 3: Maintain consistent design for all dashboards.The different displays used to showthe overview (thermometer) andthe monthly values (gas gauges)may confuse users who ‘drill-down’to get more detail.Consistent use of thermometers(large for the overview and smallfor the details) ensures that userswill immediately and intuitivelyassociate the two displays.Use Color JudiciouslyUsers expect color to provide important information they need, notdistract them.Generally, color can be used to for four effects on a dashboard. It can: Identify the status of key metrics and areas that requireattention. For example, use red to identify expenditures thathave increased more than 15 percent over the same period theprevious year. Identify types of information. Color can be used to help usersinstantly identify the type of information they are looking at.For example, dark green can be used for monetary values, anddark blue for quantities of items. De-emphasize areas or items. Border areas, backgrounds andother supporting dashboard components (the dashboard skins)should use plain, unobtrusive colors that help define dashboardareas without distracting from the information displayed. Identify the dashboard type or its level. Different backgroundcolors, or the color of dashboard titles can help users identify
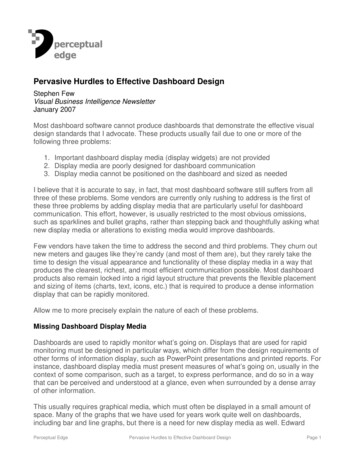
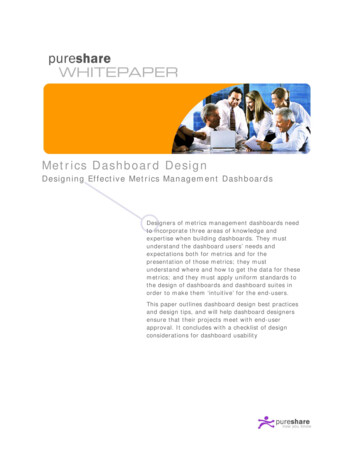
Metrics Dashboard Design9what they are looking at. For example, financial dashboardscould use a green skin, while help desk dashboards could use abeige as a reassuring color.Use Dashboard Groups to Improve OrganizationUsers need to see metric groups and hierarchies so they canunderstand relationships between different areas of the business.Group displays together by the type of metric displayed or byfunctional area.Figure 4: Sample dashboard with grouped metricsPureShare’s Profit Accelerator dashboards group related informationtogether to improve dashboard ‘legibility’.For example, on a dashboard showing financial roll-ups, put top-levelinformation into one group that shows progress against targets in threeways: absolute numbers against targets; performance compared to thesame period in the previous year, or against average performance for
Metrics Dashboard Design10the same period during the last five years; and the trend, based onperformance over the last 60 days. Alternately, show absolute numbersagainst targets for each region or department.Large, geometricshapes are easier tosee on screen andthey are morequickly processedthan detailedillustrations.Whatever the rationale used to group information on dashboards, beconsistent. Use the same rationale when establishing groups ondifferent dashboards.Set dashboard groups to ‘open’ or ‘closed’ based on the hierarchy ofinformation. Closed groups can be used to provide more detailedmetrics, or compl
Metrics Dashboard Design 7 Note, however, that symbols may differ between countries and cultures. Take these differences into account if the dashboards will be used in different parts of the world. Establish Clear Dashboard Navigation & Hierarchies Users need to be able to find information—more detail, less detail or a different view—instantly. Few dashboards are deployed individually .