Transcription
SOLVING EDUCATIONAL PITFALLSWITH BIG DATAZeehasham RasheedPrincipal Software Engineer Data ScienceVerizonAdjunct Professor - George Mason Universityzeehasham@gmail.comKnowledge Sharing Article 2018 Dell Inc. or its subsidiaries.
Table of ContentsIntroduction . 4Role of Big Data in Education Data Analytics . 4Types of Educational Data . 4Investigating Potential Questions from Educational Data . 5Admissions . 5Enrollment and Course Registration Pattern . 6Retention and Graduation . 6Costs . 6Productivity . 6Learning Activity . 6Proposed Education Data Analytics Framework . 7Data Analytics Models . 9Enrollment, Admission, Tuition Fee and Cost Model. 9Regression Model. 9Association Rule Model. 9Decision Tree Model . 10Clustering and Segmentation Model . 11Sentiment Analysis Model . 11SQL Query Engine . 11Proposed Technology Specification . 11Proof of Concept with Demo Application . 12Analysis Methodology and Outcome . 14Conclusion . 16References . 172018 Dell EMC Proven Professional Knowledge Sharing2
Table of FiguresFigure 1: Proposed Framework for Big Data Analysis in Education . 8Figure 2: Proposed Framework for Big Data Analysis in Education . 8Figure 3: Technology Stack for Data Analytics and Reporting Solution System . 12Figure 4: Demo Application Main Screen . 13Figure 5: Demo Application Data Explorer View. 13Figure 6: Demo Application Exploratory Analysis Dashboard . 14Figure 7: Exploratory Data Analysis on Students Homework Activity Logs . 15Figure 8: Student Segmentation with Correlation Analysis using RFM Model . 16Disclaimer: The views, processes or methodologies published in this article are those of the author. Theydo not necessarily reflect Dell EMC’s views, processes or methodologies.2018 Dell EMC Proven Professional Knowledge Sharing3
IntroductionData-driven decision making in schools and universities is a global yet overlooked trend in the educationsector. The use of educational data to generate insights for accountability, self-improvement and supportday-to-day operations discovers several critical issues in current initiatives for data analytics. However,initial results in teaching and learning analytics research using emerging data analytics technologiesespecially in the area of Big Data are promising. A vital aspect of these results can be considered as DataLiteracy, which empowers institutes to make use of data in their decision-making processes and to meetboth external requirements of regulatory standards as well as internal requirements of continuous selfevaluation and improvement needs [1].Role of Big Data in Education Data AnalyticsAs the requirement of processing big data in terms of increasing volume, velocity and variety is surpassingthe capability of conventional systems [2], more innovative tools and techniques are required to managebigger data sets. The exploration of a massive amount of data is not novel, however, big data providesmore challenges which are intended for investigating correctness of data (veracity) as well as differenttypes and formats of data (variety) [3].With such advancement in technology, the analysis of big data provides useful information and discoveryof meaningful patterns, which is commonly defined as big data analytics. The impact is more evident whenit unleashes its competency to provide effective data-driven decision making in teaching and learninganalytics. Teaching and learning analytics facilitates teachers to reflect on their teaching methodologyusing evidence from the delivery to the students. It also provides insights about learners and their contextsto better understand and improve the learning environment.In the same context, big data concepts is useful for a range of instructional and administrative applicationsin higher education such as monitoring and checking student performance, improving teachers capacities,and reviewing course evaluations [4]. This article concentrates on types of educational datasets, differentquestions related to those datasets and different methods for leveraging analytical capabilities to answersthose questions.Types of Educational DataSchools and universities have a broad range of educational data generated by various sources, bothinternal and external to the school. For example student portfolios, grades, credit hours, and workschedules pile up over the years and educational institutes continue to uncover new ways to convert thatdata into actionable insights. Course Management Systems (CMS) and Learning Management Systems(LMS) such as Blackboard, Moodle, etc. have the capability to capture those extensive and time-sensitivetransactional data points. Most such systems afford continual observing of learner activities, access toreading material, reactions, posts on a discussion board, solving of a test or quizzes, and final evaluationscores. Recording and investigation of these transactions in real-time can be used as input data forlearning analytics application. Furthermore, additional sources of data can include any combination of2018 Dell EMC Proven Professional Knowledge Sharing4
location, previous learning activities, health concerns (physical, emotional and mental), attendance, socioeconomic data (parental income), and parental status that will add value to the overall analysis. Mostuniversities store and aggregate this data under the umbrella of institutional statistics and can becategorized as1. Student data, such as demographics and prior academic performance2. Teacher data, such as competencies and professional experience3. Activity data that is generated during teaching, learning, and assessment processes, both withinand beyond the physical classroom premises, such as lesson plans, methods of assessments,classroom management, online activity monitoring and progress.4. Human Resources, Infrastructure, Enrollment and Financial Plans, including educational and noneducational personnel and operational expenditures.5. Student reviews and recommendations, social and emotional development such as support,respect to diversity and special needs.With this richness in educational data, there is a need for the design and implementation of an analyticsframework to increase institutional knowledge as well as improving responsiveness and real-timemanagement. This, in turn, will make education institutes achieve dramatic improvements in bothoperational performance and the attainment of strategic objectives.Investigating Potential Questions from Educational DataThe core objective of data analytics in education is to provide solutions that will operate cooperativelywith the educational environment and build upon business rules, processes and practices. It should alsobridge the gap between enrollment, student success and financial data and provide the ability to applypredictive and prescriptive modeling to answer a multitude of questions across the administration,teacher and student life cycles. Several questions that can be answered by leveraging educational datathrough data analytics. Some of them are listed below.Admissions1.2.3.4.5.6.7.8.9.10.11.12.13.Who is more likely to apply to the institute after initial prospecting?Who will enroll in which discipline/program of study?How does increasing the average SAT/GMAT/GRE scores affect incoming enrollment?What will be the expected number of applications in the upcoming semesters?What is the average GPA of students for each program?What strategies in terms of marketing or financial aid would increase enrollment?Who are the potential students for financial aid offering to maximize revenue?How many students who applied for financial aid that meet all the requirements?What is the impact of additional aid by program for financial aid leveraging?How can we measure the performance of students based on the level of scholarship provided?What combination of financial aid would increase the enrollment rate?What is the impact of marketing efforts on out-of-state or in-state enrollment?What is the net revenue gained by the upcoming class compared to previous years?2018 Dell EMC Proven Professional Knowledge Sharing5
Enrollment and Course Registration Pattern1.2.3.4.5.6.7.8.9.10.How does change in tuition fees affect the percentage of total enrollment?Who is more likely to enroll in a particular course?What is the frequent student course-taking patterns?Which classes and courses are likely to fill up quickly or need additional sections?Which courses have high dropout rates?Who is likely to change a major discipline and how does it affect graduation rates?Which courses are in high demand and why?What is the average course load per student by program?What is the number of students by status in each program at any given time?How to leverage data for enrollment modeling by year and status along with tracking retentionso that we compare with the approved budget.Retention and Graduation1.2.3.4.5.Who is likely to return (first, second, third year)?Who is likely to graduate in four or six years?Does lowering admissions requirements negatively affect overall retention?How much financial aid will be vacated by students who do not return to the university?What are the differences in terms of graduation rates for first time freshman and transferstudents with respect to each academic program?Costs1. What is the instructional costs per student credit hour by program, department and level?2. What is the average amount spent to enroll each student by program?3. What is the total instructional cost per student by level, course, degree, program, department,school and college?4. What are the revenues generated by each student enrolled by course, degree, program,department, school and college?Productivity1. Which degree programs are in demand and growing in enrollment along with increasing degreesawarded and at the same time contributing to revenue?2. What is our current cash by program?3. At any given point, what is our cash collection compared to calculated budget?4. What impact would there be if we had different rate structures by school, college or by program?Learning Activity1. How can we predict learning sequences, student knowledge behavior and final grades?2. How do we determine significant relations and patterns between student progress on consumingknowledge, activity time and usage on online learning systems and students grades?3. How to discover the relationship between usability of the course materials and student learningperformance?2018 Dell EMC Proven Professional Knowledge Sharing6
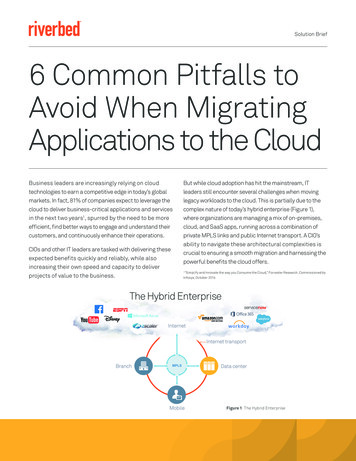
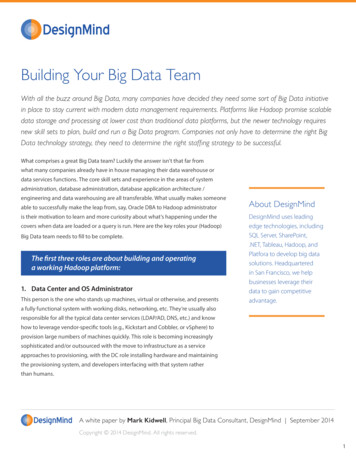
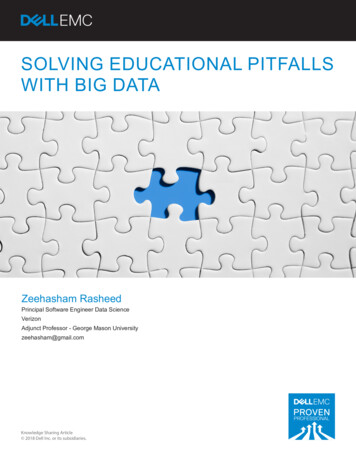
4. How can we assess students’ performance based on their schedules, grades, disciplinary recordsand attending information?5. How can we construct students’ metric based on engagement, page views, click rate, frequencyof posting, number of logins, etc. using online activity logs from the learning systems?Proposed Education Data Analytics FrameworkThe general process of extracting information from big data can be broken down into five stages [5]1.2.3.4.5.Data acquisition and managementExtraction, cleaning and annotationIntegration and aggregationModeling and AnalysisInterpretation and presentationWith respect to the role of big data and learning analytics in educational institutes, a general architecturalframework is proposed in Figure 1 that supports multi-structured data sets processing, analysis andpresentation. The roles and abilities of two groups (i) Students, Teachers, Researchers and (ii) Data Analyst,Data Scientists, Data Engineers and Administrators are clearly defined and proposed within thisframework and explained in the section below.Data collection module maps, aggregates and cleans data from different sources. Structured data thatconstitutes about 5% of all the available data [6] such as Learning Management Systems (LMS),Administration and Enrollment data refers to the tabular data found in spreadsheets or relationaldatabases. On the other hand, text, images, audio, video, and data from web logs are examples ofunstructured data that sometimes lack the structural organization required by analytical methods.A group of data-savvy people (Data Analyst, Data Scientists, Data Engineers) are responsible for preparingETL (Extractions, Transformations, and Loading) layer. The ETL module includes functions such as dataintegration to relevant tables, data transformation, and loading of data specifically for advance analysis.Data scientists use this data to create complex predictive and business intelligence models that produceuseful information and actionable insights. The output is then transferred to the presentation layer.The presentation layer provides a user-friendly graphical interface where students, teachers, andresearchers can easily retrieve information without the need for the in-depth data analysis knowledge,programming skills or database schema in the background.We made this proposal, according to the most important aspects of the implementation of big data andanalytics in the field of education that covers integration of data from different sources, embedded ETLand statistical computational layer and the possibility of high quality presentation layer to the end users(students, teachers, and researchers). The presented framework can be useful for providing anexceptional high performance and flexible data processing framework for ongoing study in educationalresearch.2018 Dell EMC Proven Professional Knowledge Sharing7
Figure 2:1: Proposed Framework for Big Data Analysis in Education2018 Dell EMC Proven Professional Knowledge Sharing8
Data Analytics ModelsFollowing are some data analytics models and methods to answer potential questions related toeducational datasetsEnrollment, Admission, Tuition Fee and Cost ModelThe primary task is to develop a model that can project future student enrollment. Simple methods suchas moving averages with exponential smoothing can be used to predict the enrollment. Other complextime series models for example Box-Jenkins method, which uses Autoregressive Moving Average, wouldbe another candidate model if required. Data preparation and model building requires complexcalculation of counts, running averages and percentages.Tuition fee model helps forecast net tuition revenue with respect to course, degree, program, departmentand school. It can also solve the use-cases regarding what/if scenarios under different tuition fee modeland financial aid packages. Data preparation and model building requires complex calculation of counts,retention, aggregation, factor multiplication and percentages. Examples of calculations in tuition feemodel include Attrition Rate, Percent change in tuition fee, Per Credit Hour Rate, Per Credit Hour Increase,and so on.Accuracy of these models can be evaluated by applying a model on historical data. Actual and predictedvalues along with difference and percentage of error will determine the effectiveness and accuracy.Regression ModelRegression model uses multivariate analysis to investigate the relationship between input variables withoutput variables. It is also used to analyze how the change of one variable can affect the outcome. Forexample, how a change in tuition fee can affect total enrollment can easily be investigated usingregression model. If we consider tuition fee and enrollment use-case, we can define input and outputvariables as1. Input variablesa. In-state tuition and feesb. Out-of-state tuition and feesc. Total scholarships, fellowships and grantsd. Other input variables: i.e. number of graduates, state population, unemployment rate,etc.2. Output variablesa. Enrollment headcountb. Total credit hoursUsing regression, we can estimate the effect of tuition on total enrollment and total credit hours. Thecoefficients given by regression model for each input will determine their effect on output variables suchthat if their relationship is directly proportional or inversely proportional to each other.Association Rule ModelAssociation Rules is an algorithm that helps uncover relationships and patterns between seeminglyunrelated or scattered data in a relational database or other information repositories. An example of an2018 Dell EMC Proven Professional Knowledge Sharing9
Association rule would be if a customer buys product X, he is more likely to buy product Y. We can alsoapply the same logic to discover course-taking patterns among undergraduate/graduate studentsFor the input of Association Rule model, we require student information such as courses taken by eachstudent in each semester throughout the academic career. Once the input is prepared, Association rulesand patterns are generated by analyzing data for freq
With such advancement in technology, the analysis of big data provides useful information and discovery of meaningful patterns, which is commonly defined as big data analytics. The impact is more evident when it unleashes its competency to provide effective data-d