Transcription
Nigeria PowerBaseline Report
This report was developed by the Advisory Power Team, Office of the Vice President, Federal Government of Nigeria in conjunction with Power Africa.Disclaimer: The information provided is current as of 15 August 2015. The analyses and conclusions contained in this document are based on best available data sourcedfrom the Federal Government of Nigeria. Despite all efforts to ensure the integrity of the inputs, accuracy is limited to completeness of the source data.
ContentsForeword1Glossary of terms2Executive summary3Power in Nigeria5Overview of the power sectorReform timeline and major playersGeneration13Primary energy – gas17Transmission19Distribution23Power sector performance fromJune to August 201527
ForewordThe Buhari administration is committed to delivering change to Nigeria’s power sector tobenefit the lives of all Nigerians. Currently, over half of our population ( 55%) does not haveaccess to grid-connected electricity, and those that do, suffer from intermittent powersupply. Stable and constant electricity is vital to the economic and social welfare of Nigeria.This is not a luxury, but a necessity for the development and progress of Nigeria.This report was commissioned in conjunction with Power Africa to provide an objectiveperspective on the current state of the power sector and identify the key constraints, whichwill be the focus of the administration’s efforts in improving the sector’s performance. Thereport intentionally does not contain recommendations, but instead, presents an unbiasedanalytical picture of the current state of the sector.The power sector is plagued with structural issues in all key areas: generation, gas supply,transmission and distribution. To name a few of these challenges, the operational capacityof the country’s power plants is less than a third of their installed capacity. Chronic vandalismhas crippled oil and gas pipelines, creating gas shortages at power plants. Underinvestmentin maintenance and infrastructure has constrained our transmission grid. Finally, highcollection and commercial losses have impacted the financial viability of the privatiseddistribution companies.Although these fundamental challenges still exist, since June, the power sector has recordedsome operational improvements, mainly driven by increased availability of gas. In August,Nigeria hit historical highs for both peak generation (4,811MW peak generation on August25) and total energy generated across the system (4,213MWh/h energy generated onAugust 5). Transmission losses fell by 10% (June to August 15th 2015) compared to the firstfour months of the year. In addition to the improvement in power supply, delayed decisionshave been fast tracked to provide clarity to investors, including: a sovereign immunitywaiver granted to progress development on the first tranche of project-financed IPPs; theexecution of the first set of World Bank partial risk guarantees; the interim extension of theTCN management contract; and the imposition of a September 2015 deadline for thesubmission of the distribution companies’ revised tariff trajectories.Though these improvements are laudable, they are only the beginning of the extensivechange required in the power sector. This administration is dedicated to providing stableand constant electricity to all Nigerians, which has manifested in the post-handoverimprovement of the electricity supply.This administration has also created a publicly accessible website (www.nesistats.org),which has brought a new level of transparency to the performance of all the power stationsconnected to the grid, as well as, the performance of the grid itself.This report provides a common set of facts needed for all stakeholders to participate in theprogressive change needed in the Nigerian power sector.Professor Yemi Osinbajo, SANThe Vice PresidentFederal Republic of Nigeria1
Glossary of termsAcronymDefinitionBPEBureau of Public EnterprisesBSCFBillion Standard Cubic FeetBSCFDBillion Standard Cubic Feet per DayFGNFederal Government of NigeriaIOCInternational Oil CompanyIPPIndependent Power ProducerkWhKilowatt-hourMHIManitoba Hydro InternationalMOMarket OperatorMoFFederal Ministry of FinanceMoPFederal Ministry of PowerMoPRFederal Ministry of Petroleum ResourcesMWhMegawatt HourMWh/hMegawatt Hour/HourMYTOMulti-year Tariff OrderNBETNigeria Bulk Electricity Trading CompanyNCPNational Council on PrivatisationNDPHCNiger Delta Power Holding CompanyNEPANational Electric Power AuthorityNERCNigerian Electricity Regulatory CommissionNESINigerian Electrical Supply IndustryNGCNational Gas CompanyNIPPNational Integrated Power ProjectNNPCNigerian National Petroleum CompanyNPDCNigerian Petroleum Development CompanyOPTSOil Producers Trade SectionPHCNPower Holding Company of NigeriaSOSystem OperatorTCNTransmission Company of NigeriaTSPTransmission Service Provider2
Executive summaryNigeria is the biggest economy in Africa, with a GDP of USD569 billion (2014). However, itspower sector is performing below the level of its peer countries. Over half of the population( 55%) has no access to grid-connected electricity and those who are connected to thegrid suffer extensive power outages.To improve the power sector, the Nigerian government has undertaken long-term structuralreforms (which started in 2005 but gained momentum in 2010) focused on privatisinglegacy power assets and instituting regulatory reform. However, these reforms haveproved insufficient and more must be done to address the challenges in the sector, whichinclude sub-optimal utilisation of generation plants (partly due to insufficient gas moleculeavailability), inadequate transmission infrastructure and high distribution losses (with relatedliquidity and viability issues).These challenges are evident in all four segments of the Nigerian power value chain: Generation. Today, Nigeria has 12,522MW of installed capacity, but due to maintenance,gas, water and transmission constraints, an average of only 3,879MW of capacity isoperational (January to 15 August, 2015). Primary energy — gas. The majority (85%) of installed capacity is fuelled by gas.Availability of gas molecules is low due to insufficient production, economic disincentives,inadequate infrastructure and frequent vandalism. Transmission. Nigeria’s transmission system has the capacity to transmit 5,300MW butis disrupted by system collapses and frequent forced outages. Currently, transmissioncapacity is higher than operational generation capacity, but transmission will rapidlybecome a constraint due to increasing operational capacity. Distribution. Nigeria’s distribution companies suffer significant losses, with 46% of energylost due through technical, commercial and collection issues.3
Resolving the above is critical to improving the country’s power supply. The past threemonths (June to August 2015) have seen measurable improvements, including: A 26% increase in operational generation capacity (June to August 15, 2015 compared toJanuary to May 2015) Decreased pipeline vandalism boosting gas supply A 10% reduction in transmission losses (June to July 2015 compared to January to May2015) De-bottlenecking the 450MW Azura-Edo IPP and the 500MW Exxon Mobil Qua-Iboe IPP One-year extension of Manitoba Hydro International’s management contract for TCN Imposition of a September 2015 deadline for the submission of the distribution companies’revised tariff trajectories Execution of the first set of World Bank partial risk guarantees to support financing of thegreenfield IPPsIn spite of these green shoots of progress, Nigeria must fix some fundamental structural issuesbefore supply can meet demand. The most critical issue is to ensure that the distributioncompanies have the revenues to settle their wholesale obligations, meet their operatingexpenditure requirements and invest in new capacity. Setting the right tariffs is just onepiece of the jigsaw.The required interventions cannot be isolated within a specific segment because of theinterconnectedness of the power value chain, in which disruptions cascade across thewhole sector, e.g., a decrease in power generation has an impact on the power distributedand in turn distribution collection losses have an impact on the financial health of all marketplayers. Major cross-cutting initiatives are needed to develop the power sector and improveelectricity supply.4
Power in NigeriaToday, 95 million Nigerians ( 55% of the population) have no access to electricity andthose who are connected to the grid face extensive power interruptions. Systemic issuesaffect all phases of the power value chain (generation, gas supply, transmission anddistribution) forcing Nigerians to rely on self-generation. According to the World Bank, anestimated 41% of Nigerian businesses generate their own power supply to augment thenational grid supply.To remedy these issues, the Nigerian government moved to privatise the power sector withthe Electric Power Sector Reform Map of 2005 and the launch of the Roadmap for PowerSector Reform in 2010. The former National Electric Power Authority (NEPA) was replacedby the Power Holding Company of Nigeria (PHCN), which was unbundled into separategeneration and distribution companies and the Transmission Company of Nigeria (TCN).Beginning in 2013, the generation and distribution companies were handed over to privateowners with the FGN retaining a minority stake. The TCN is still 100% owned by the FGN but iscurrently under a management contract with Manitoba Hydro International (MHI).Overview of the power sectorAt 126kWh per capita, Nigeria lags far behind other developing nations in terms of gridbased electricity consumption. Based on the country’s GDP and global trends, electricityconsumption should be four to five times higher than it is today.For example, Ghana’s per capita consumption (361kWh) is 2.9 times higher than that ofNigeria, and South Africa’s (3,926kWh) is 31 times higher.5
Nigeria’s powersector snapshot126kWh/capitaIn 2013, Nigeria ranked25 (from the bottom)on power consumptionper capita4-5xselfgenerationcosts 2xmore thangrid-basedpowerNigerians get a significantportion of their electricityfrom private generators ata higher cost (NGN 62 94/kWh) than grid-based(NGN 26 - 38/kWh) powerIncrease in electricityconsumption required tomatch peer countries withsimilar GDP per capita 95millionNigerians are withoutaccess to electricity,and those that dohave access faceextensive poweroutages25%of potentialenergyreaches theend-userStructural inefficienciesin power generationcause the underutilization of Nigeria’sgeneration capacity6
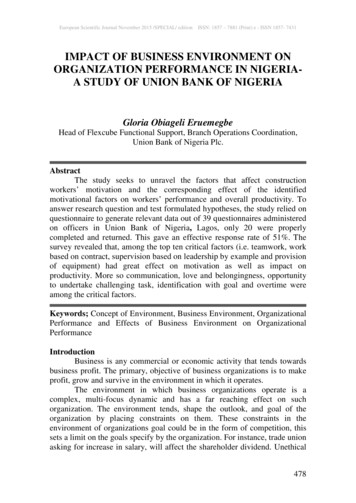
At 45%, Nigeria’s electrification rate is low – much lower than that of Ghana (72%) and SouthAfrica (85%). Furthermore, unreliable power supply forces both households and industry torely on privately owned generators for much of their power. These generators are more thantwice as expensive (NGN 62 - 94/kWh) than grid-based power (end user tariff of NGN 26 - 38/kWh).There are three stages in the delivery of power to customers: generation at the power plant(requiring a source of primary energy, i.e., water or gas), transmission to the distributioncompanies and distribution to the end user.Only 25% of Nigeria’s 12,522MW of installed capacity reaches the end user. Widespreadinefficiency means that only 3,879MW of this capacity is operational (average January to15 August, 2015), with 3,600MW transmitted and 3,100MW distributed (Exhibit 1).Exhibit 1Only 25% of Nigeria’s installed capacity is distributedNigeria power sector energy flowMWCONCEPTUALEstimated max.transmission capacityEstimated max.distribution capacity12,522 7.4%transmission loss5,381 6.9% commercial and36.5% collection losses 12.5% 2distributedDistribution1 Refers to average daily capacity of units non-available and non-operational from Jan to Aug 15 2015; assumes peak demand2 Effective capacity for transmission and distribution post-losses; assumes peak demandSource: Team analysis, TCN reports, Advisory Power TeamMost of the short fall (5,381MW average January to 15 August, 2015) is capacity that isunavailable due to obsolete equipment and poor maintenance or to ongoing maintenanceand repair activities at existing power plants. Also, 3,262MW (average January to 15 August,2015) is non-operational primarily due to gas, water, high frequency, and line constraints.In addition, the financial health of the sector is below par, as the distribution companies areunable to collect sufficient revenue to pay their full market costs. As a consequence, all ofthe upstream sectors (TCN, generation companies, and gas producers) do not receive fullcompensation for their costs.7
Reform timeline and major playersSince 2005, Nigeria has undertaken a long-term structural reform of the sector to improvethe provision of power to its citizens. The Roadmap for Power Sector Reform launched in2010 has provided major impetus. The government has developed the power sector from asingle state-owned utility to an unbundled system with private participation and ownershipof assets across generation and distribution (Exhibit 2).Exhibit 2Nigeria’s power sector privatisation timelinePrivatisation timelineFEB-MAR: BOE and preferred bidders sign industryagreements and preferred bidders pay initial depositsMAR: Electric Power Sector Reform Actpassed NEPA unbundled Power Holding Company of Nigeria(PHCN) created consisting of– 6 generation companies(GenCos)– 11 distribution companies(DisCos)– 1 transmission company(Transmission Company ofNigeria – TCN)FEB–MAR: Shareholders and Share SaleAgreements signed and initial deposits (25%) paidby preferred bidders of 10 DisCos (ex-Kaduna)MAR: Pre-due diligence conducted for retender of Kaduna DisCo and Afam GenCoMAR: EOIs received;requests for proposal(RFPs) sent toshortlisted bidders20052009/10AUG: Launch of roadmapfor Power Sector Reformto guide acceleration ofEPSR reforms. One of thekey tenets of theRoadmap was PHCN’sprivatisation2011DEC 2010: Bureau ofPublic Enterprises (BPE)sends outadvertisements forExpressions of Interest(EOIs) for PHCNsuccessor companiesMAR: Privatisation of Alaoji,Omoku and Gbarain NIPPGenCos temporarily suspendedpending ruling on EthiopeEnergy case challenging theirdisqualificationSEP: Share certificates and licences handedover to purchasers of PHCN GencosSEP: Requestsfor proposal(RFPs) issuedNOV: Incorporation of11 new successor DisCosand 6 successor GenCosMAR: Technically qualified biddersfor NIPP GenCos announcedJUL: Technical andfinancial proposalsfrom pre-qualifiedbidders receivedfor PHCN successorcompanies (exKaduna DisCo)NOV: After several shifts in hand-overdate owing to issues especially labourprotests, 10 DisCos were handed overon 1 Nov2012AUG: Preferred bidderselected for Afam GenCo2013OCT: National Council onPrivatisation (NCP) approvedpreferred bidders for legacyGenCos and DisCos (exAfam GenCo or KadunaDisCo)APR: Deadline of preferredand reserved bidders to paybank guarantee of 15% ofamount bid2014AUG:Northwestmissesdeadline forpayingbalance ofbid priceOCT:Northwestmeets theextendeddeadline forpaying thebalanceDEC:Handoverof KadunaDisCoSource: CSL 2014; press searchThe key decision, policy, and regulatory bodies active in the sector are: The Presidency Nigerian Electricity Regulatory Commission (NERC) Ministry of Power (MoP) Ministry of Petroleum Resources (MoPR) Ministry of Finance (MoF) National Council on Privatisation (NCP) with its secretariat, the Bureau of PublicEnterprises (BPE).8
There are seven main players in the daily operations of the power market: Nigeria Bulk Electricity Trader (NBET) Transmission Company of Nigeria (TCN) Nigerian National Petroleum Corporation (NNPC) and its key operational subsidiaries,the Nigerian Gas Company (NGC) and the Nigerian Petroleum Development Company(NPDC) Niger Delta Power Holding Company (NDPHC), which owns and operates the NIPPpower plants and is responsible for completing construction of parts of the critical newtransmission and distribution infrastructure Private sector natural gas producers: international oil companies (IOCs) and indigenousoil and gas companies The divested generation companies The divested distribution companiesThe remainder of this document looks in detail at the four components of the powersector value chain (generation, primary energy – gas, transmission, and distribution) andtheir status.9
10
Nigeria’s power landscapeNERC(NIGERIAN ELECTRICITY REGULATORY COMMISSION) Overarching power sector regulator Responsible for licensing, tariffs, codes and other policiesNBET(NIGERIAN BULK ELECTRICITYTRADING PLC)GASPURCHASEAGREEMENTS Creditworthy intermediarybetween DisCos, TCN and GenCos Temporary role until sectorachieves fiscal GAS PRODUCERSGENCOS NNPC, IOCs, and Local Independents JV, PSC, and Independent fielddevelopment(GENERATION COMPANIES) 25 grid-connected power plants Mix of public and private ownership(privatised PHCN, NIPP and IPP)HYDROGAS15%85%8.9 BSCFD110.8 BSCFD Daily productionSupplied to power plantsGASTHERMALPLANTS 85% of installedcapacity 22 gas thermalplants HYDROELECTRICPLANTS 15% of installedcapacity 3 hydro plants
STARIFFSCUSTOMERSCUSTOMERS 8 million 8 millioncustomerscustomers 36% 36%collectioncollectionloss lossVESTINGVESTINGCONTRACTSCONTRACTS1 NYCOMPANYOF IES)COMPANIES) Owns gridgrid Managed Managedby onal 11 privatised11 privatisedDisCosDisCos Sell directlySell directlyto customersto customersandandindustryindustry pacity 3,6003,600MWMW3,1003,100MWMW nand otherand teredby marketby marketoperatoroperator2AverageAveragedaily operationaldaily operationalcapacitycapacityfrom Januaryfrom Januaryto Augustto August15, 201515, 201512
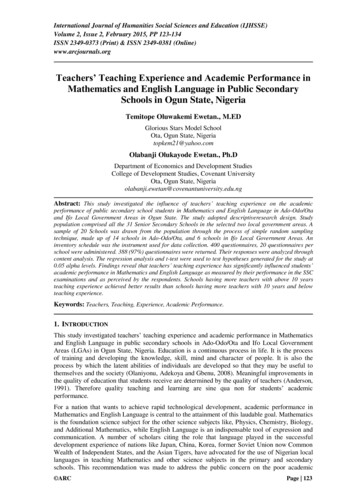
GenerationBetween January and 15 August, 2015, Nigeria’s power plants sent out an average3,317MWh/h of electricity daily from 25 grid-connected power plants (located largely in thesouth) with installed capacity of 12,522MW. The plants are run by generation companiesincluding those formerly under the PHCN, National Integrated Power Project (NIPP), andIndependent Power Producers (IPPs).Eighty-five percent of installed capacity is generated by gas thermal power plants and theremaining 15% is generated by hydroelectric power plants (Exhibit 3).Exhibit 3Nigeria has 25 on-grid power plants1, concentrated in southern oBauchiNigerGombeKadunaAdamawaPower plant installed capacity MWPlateauFCTKwaraOyoOsunOgun50-200Nassarawa verIn addition, 3 more NIPP plants are underconstruction and NERC has issued licensesfor additional on-grid projects with capacityover 9,000 MW, including IPPs such as AzuraPower, which is nearing financial close1 Includes plants connected to the grid with at least one constructed turbine2 IPP: Independent Power Project – note Ibom, Omoku, Rivers IPP, and Trans Amadi are sponsored by state governments 3 NIPP: National Integrated Power Project plantSource: TCN Reports, Advisory Power Team, NERCAlthough installed capacity totals 12,522MW, the average available capacity (January to 15August, 2015; 57% of installed capacity). Available capacity is capacity that could be usedfor generation but is constrained by internal plant issues – mainly maintenance and repairrequirements. Some of these are routine general maintenance and inspections, but mostare the result of unplanned issues (e.g., trips, faults, leakages, burnt components, vibrationand filter issues) and units needing rehabilitation/overhaul.13
Nigeria’s powergeneration efficiency1INSTALLED CAPACITY25 gas-fired and hydro-electric power plants3 HYDRO PLANTS1,930MW22 GAS PLANTS10,592MW12,522MWINSTALLEDAVAILABLE CAPACITYNon-availability reduced power generation by 5,381MWMAINTENANCEAND REPAIR ISSUESREDUCED CAPACITY21PLANTS7,141MWAVAILABLE CAPACITYOPERATIONAL CAPACITYGas, water management, transmission, and other constraints reduce power generationby 3,262MWGAS CONSTRAINTWATER CONSTRAINTHIGH FREQUENCYLINE CONSTRAINTOTHER CONSTRAINTS11,995MW444MW179MW84MW560MWAvailable and operational capacity data points are daily averages from January to 15 August 20153,879MW14
Although available capacity is 7,141MW, power plant operational capacity is even lower at3,879MW (average January to 15 August, 2015; 31% of installed capacity).The key constraintsto operational generation capacity are: Insufficient gas supply due to low production, insufficient infrastructure and vandalism Poor water management High frequency due to demand imbalances Line constraints due to inadequate transmission infrastructure.Exhibit 4All plants have sub-optimal utilisation; 7 operate at less than 10% of installed capacityLess than 10% operationalAvg. available capacity2MWInstalled capacity1MWPower plantEGBINIPPAFAM VIPRIVATISED PHCNOKPAIIPPDELTANIPPJEBBAIPPOLORUNSOGO GASPRIVATISED PHCNIHOVBOR NIPPPRIVATISED PHCN434GEREGU NIPPPRIVATISED PHCN450KAINJINIPPOLORUNSOGO NIPPIPPOMOTOSHO NIPPNIPPOMOTOSHO GASPRIVATISED PHCNSHIROROPRIVATISED PHCNGEREGU GASNIPPSAPELE NIPPIPPIBOMPRIVATISED PHCNSAPELENIPPALAOJI NIPPIPPODUKPANI NIPPPRIVATISED PHCNAFAM IV-VNIPPASCOIPPOMOKUPRIVATISED PHCNTRANS AMADINIPP150AES GASPRIVATISED PHCNRIVERS vg. operationalcapacity2, MW000001750007,14157%54%3,87931%1 Average daily capacity Jan to Aug 15 2015 with data extrapolated for days on which data not available2 Average of daily total across plantsSource: TCN Reports, Nesistats.org, Advisory Power TeamThese constraints cause the power industry to lose an average NGN1.4 billion (USD7 million)of revenue1 daily.Improving Nigeria’s power generation is key factor to resolving the power shortage. Ongoingrefurbishment of existing generation plants and construction of new gas-fired power plantswill help. However, building more generation capacity alone is not enough; it needs tobe supported upstream with improved gas availability and downstream with additionaltransmission capacity.115 Using net, average and levelised, tariff of N20/kWh (i.e. net of all ATC&C losses) per MYTO 2.1 assumptions(source: Nesistats.org)
16
Primary energy – gasNigeria has the world’s ninth-largest proven gas reserves (estimated 180,105 bscf). However,insufficient gas supply is the biggest constraint to available generating capacity andreduces operating capacity by an average of 2,060 MW daily.Although the country has abundant reserves, its gas production is low – it ranks 22 on theglobal production scale. The low level of gas supplied to power plants is exacerbated byinsufficient gas production for the domestic market. In 2014, total gas production was 8.9bscfd but less than 10% was supplied to the domestic power sector for generation.This is insufficient to run the country’s gas thermal power plants. As a result, only 56% of gasplants’ available generating capacity is operational. An additional 0.6 bscfd would berequired to sustain current available generating capacity.The low level of gas produced for the domestic market is the result of:—— Insufficient gas-processing and pipeline infrastructure. Long-term under-investmentand delays in the delivery of planned gas infrastructure have resulted in a shortageof gas-processing and pipeline infrastructure. Lack of investment in gas-processingfacilities and failure to complete already funded projects are key challenges. Regularvandalism of existing pipelines is another big challenge.—— Poor economics. Low domestic gas prices do not justify investment in gasdevelopment by upstream oil and gas companies. Recent tariff increases haveimproved the situation but it is estimated by OPTS2 that further increases are neededto fund projects requiring new infrastructure, e.g., processing facilities and pipelines.In addition, gas producers are not consistently paid for the gas they supply becausethe generation companies do not receive full remittances from the NBET due todownstream collection issues.—— Limited joint venture funding. From 2010 to 2013, the gas industry received USD6billion less than required from NNPC to fully implement its joint-venture business plans(on a yearly average basis). Resolving these funding challenges could increase gasproduction by 2.8 bscfd by 2020 under current fiscal terms.—— Regulatory issues. Nigeria’s oil and gas regulatory regime, specifically the PetroleumIndustry Bill, has been under debate since 2008, causing investor uncertainty.Gas is the primary feedstock for the Nigerian power industry and the failure to deliver has alarge downstream impact on all players from generation to distribution. Current and futurepower plants will not meet power demand unless gas supply improves significantly.172Oil Producers Trade Section of the Lagos Chamber of Commerce and Industry
Nigeria’s gas utilisation8%RE-INJECTEDPRODUCERINTERNAL USE27% T GAS TO POWERPOWER REQUIREMENTS FOR AVAILABLE CAPACITY11.4BSCFDneeded for gas generationPOWER 0.8BSCFD1,995MWlost to gas constraint28%of available capacity unutilizeddue to gas constraints1Average available capacity of 7,414MW from January to 15 August 201518
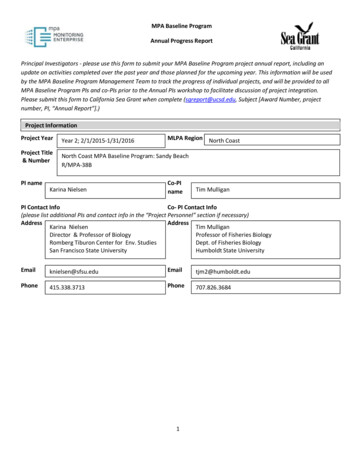
TransmissionTCN manages the transmission system under management contract with Manitoba HydroInternational. TCN consists of three departments:1. Transmission Service Provider (TSP) that is responsible for the development andmaintenance of transmission infrastructure.2. System Operator (SO) that manages the flow of electricity throughout the powersystem from generation to distribution companies.3. Market Operator (MO) that administers power market rules.TCN is the last legacy asset to be reorganised and is to be structured to operate independentlyfrom the SO and MO.Nigeria’s transmission network consists of 159 substations with a total (theoretical)transformation capacity of 19,000MW and 15,022km of transmission lines.Currently, transmission capacity ( 5,300MW) is higher than average operational generationcapacity of 3,879MW (average January to 15 August, 2015), but it is far below the totalinstalled capacity of 12,522MW. When operational generation capacity grows to the samelevel as transmission capacity, transmission will become a critical bottleneck to electricitydelivery – early signs were visible in July and August.At an average 7.4% (January to July 2015), transmission losses across the network are highcompared to emerging country benchmarks of 2-6%. This reflects the critical infrastructureand operational challenges.Ineffective maintenance and poor system management contribute to partial or total systemcollapses. The number of system collapses has fallen over the last seven years from a peakof 42 in 2010 to 13 in 2014 (Exhibit 5). The incidence of forced outages has not improved atthe same rate and maintenance challenges persist with an average of just 67% plannedmaintenance works completed per month (February to July 2015).19
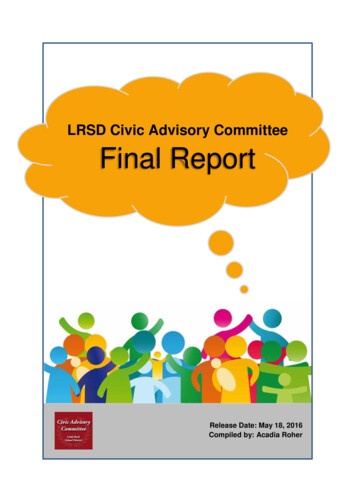
Exhibit 5System collapses have declined over the last 7 years, but remain a significant challengedue to insufficient maintenance and poor system managementNumber of 132010201141692012201320148352015 YTD11 January to August 15, 2015Source: TCN ReportsOne hundred and twenty-six approved TCN projects worth USD1.5 billion are underway tostrengthen the transmission network and a further 118 NIPP projects have been approved(Exhibit 6). As in generation, however, delivery has been slow and only 22 of the TCN projectshave been completed, primarily because of inadequate funding and invoicing delays(ongoing FGN funded projects are generally ineligible to access external funding reservedfor new projects). Of those yet to be completed, 30% have been underway for more thanfive years and eight were started in 2001. In addition, various external funding sources3have been made available to finance new projects within the transmission sector. However,much funding has yet to be accessed as the number of bankable projects is low.When complete, these projects could increase grid-wheeling capacity to 7,200MW andthe length of the network to 21,000km.3 From the African Development Bank, FGN Eurobond issue, French Development Agency, China EXIM, World Bank,Japan International Cooperation Agency20
Exhibit 6Approved projects aim to stabilise and strengthen the transmission networkApproved TCN and NIPP transmissionprojects1Number of projects126Potential impact of projects approvedNot completedPotential increase from projectsCompletedExisting118Grid wheeling capacity, MW5,3381,8927,23058Detailedfurther104Transmission line, km6015,02222TCNNIPP1 As of May 20152 Assuming power factor of 0.85 per minimum stated in Grid Code for the Nigeria Electricity Transmission System 2014Source: TCN Reports, Nesistats.org, Advisory P
generation and distribution companies and the Transmission Company of Nigeria (TCN). Beginning in 2013, the generation and distribution companies were handed over to private owners with the FGN retaining a minority stake. The TCN is still 100% owned by the FGN but is currently under a man