Transcription
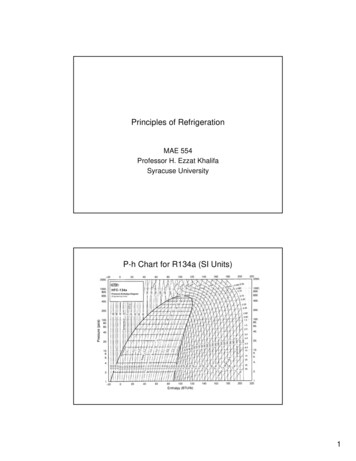
Principles of RefrigerationMAE 554Professor H. Ezzat KhalifaSyracuse UniversityP-h Chart for R134a (SI Units)1
Psychrometric Chart (ASHRAE)Psychrometric ProcessesAir ConditioningSystems Cool &Dehumidify AirHumidifyCoolHeatCool & DehumidifyDehumidify2
A/C System Psychrometric ProcessesCoil temperaturemust be cooler thanroom dew point (DP)to dehumidify the airOutdoor AirRoom DPCoil InletRoom Return AirCoil ExitRoom Condition LineReversed Carnot CycleTTHTCs3
Carnot Cycle Performance30.0Sat Cond T, Cold-Side Temperature - TC, CReversed Carnot Vapor Compression CycleTTHTCs4
Reversed Rankine Vapor Compression CycleTSuperheat HornIncreased WorkTHTCsIdeal Practical Vapor Compression CycleTSuperheat HornIncreased WorkTHThrottling LossIn WorkTCThrottling Lossin Refrigerations5
Simple Vapor Compression Cycle3241Single-Stage Vapor Compression CyclePΔTSCPCPEΔhWoΔTSHΔhEΔhWh6
Ideal VCC Performance1025R22Ideal VCC10 CFMCompressor20Cond.Sat. Temp., ºC15COPC6410250-40.0-30.0-20.0-10.00.0Capacity, kW835.0 COP50.0 COP35.0 Q50.0 Q010.0Evap. Sat. Temp., CRelative COPComparison of Ideal VCC with Carnot Cycle1.01.00.90.90.80.8Cond.Sat. Temp., .510.0Evap. Sat. Temp., C7
P-h Diagram for Real Vapor Compression CycleP2dPD32PCPEPS1a411b 1chEffect of the Gas Specific Heat Ratio, γ8
Two-Stage VCC with Flash Economizer54326781P-h Diagram for 2-Stage VCC with Flash 9
Two-Stage VCC with Subcooler Economizer554326781P-h Diagram for 2-Stage VCC with 0
Optimum Intermediate Temperature for 2-Stage VCC2.42.2COPC2.0COP C, e0.80.6-40-30-20-1001020304050Intermediate Sat. Temp., CComparison of Two-Stage and Single-Stage VCCs10R22Ideal VCC8Cond.Sat. Temp., ºC35/COP 1COP C650/COP 135/COP 2450/COP 220-40.0-30.0-20.0-10.00.010.0Evap. Sat. Temp., C11
Performance of Multi-stage VCCs1.81.6R22Ideal VCCRelative COP C and Capaity1.41.21.0Rel. COPRel. Capacity0.80.60.40.20.01234Number of StagesCascade SystemHigh-Temperature RefrigerantLow-Temperature Refrigerant4112
Desirable Characteristics of Refrigerants Thermally stableSafe (toxicity and flammability)Low cost and widely availableCompatible with materials of constructionHigh performance––––High latent heatLow compression superheatLow throttling lossesHigh heat transfer properties Environmentally benign (ODP and GWP)Refrigerant opesUsed in or considered for Refrigeration13
Mixture Phase DiagramsSat. TemperatureP2P1TsatLiquid Mole-Fraction0.00.10.2Vapor Mole-Fraction0.30.40.50.60.70.80.91.0Mole Fraction, xMixture Phase DiagramsSat. TemperatureP2P1TsatLiquid Mole-Fraction0.00.10.2Azeotrope0.30.40.5Vapor Mole-Fraction0.60.70.80.91.0Mole Fraction, x14
NIST Refrigerant PropertiesASHRAE Refrigerant Safety ClassificationLow/No ToxicityA1No FlammabilityLow FlammabilityHigh FlammabilityHigh ToxicityB1R11, R12, R22, R125, R134a, R407C,R507, R404A, R410A, R744R123, R764, R21A2B2R32, R142b, R143a, R152aNH3A3B3R170, R290, R600a, R1150R1140Refrigerants marked in Red are ozone depleting substances that are no longerused in new equipment.Refrigerants marked in Green are natural refrigerants that have low GWP,as well as no ODP.15
Refrigerants: Methane GroupRefrigerants: Ethane Group16
ODP and GWP for Various .00.00.840.250.251.20.0292.395.10N/A0.490.96ODP (Ozone Depletion Potential), and GWP (Greenhouse Warming Potential) arecalculated relative to CFC R11.Refrigerant oYesYesToxic?NoNoNoNoNoNoNoYesRelative Cost0.1-(1.0)4.05.05.00.30.2Volum. Capacity4.80.6(1.0)0.71.21.50.91.0Critical Temp.(F)88234205214163158206270P @ 70F (psia)8528513686165216125129ODP01.00.0500000GWP (100yr)(1.0)7100150013003750173030(1.0) means reference value17
Refrigerant Pressure-Capacity RelationshipVolumetric Capacity @ ARI [Ton/cfm]1.0R22 & itsnear neighbors0.8Best 4a0.20.00100200300400500Pressure Difference @ ARI [psi]Comparison of Simple Cycle EER1.10EER Relative to 7CR507R410A18
Relative ARI Capacity [Same Displacement]Capacity relative to R222.01.51.00.50.0Relative Compressor Displacement [Same Capacity]Displacement relative to R223.02.52.01.51.00.50.019
Low Temperature Capacity ComparisonCapacity Relative to ARI1.0R22R507R134aR410A0.1-50 -40 -30 -20 -1001020304050Saturated Evaporator Temperature [F]SCT 130F; SH 20F; SC 15F; No LSHX; No QuenchLow Temperature EER ComparisonEER Relative to R22 @ ARI1.0R22R507R134aR410A0.1-50 -40 -30 -20 -1001020304050Saturated Evaporator Temperature [F]SCT 130F; SH 20F; SC 15F; No LSHX; No Quench20
Discharge Superheat Comparison300Discharge Suoerhear [F]250200R22R507R134aR410A150100500-50 -40 -30 -20 -1001020304050Saturated Evaporator Temperature [F]SCT 130F; SH 20F; SC 15F; No LSHX; No QuenchTotal Equivalent Warming Impact (TEWI)Medium Temperature RefrigerationFrom DoE's ORNL Report, 199721
Fluid Comparison - R134a vs. R744 (CO2)R134aR744 (CO2)Region ofOperationalInterestRegion ofOperational InterestCritical PointLow PressureHigh PressureR134a214 F10-50 psi100-250 psiR74488 F110 - 500 psi750-2000 psiOther CO2 Properties:High throttling lossesSolid CO2 (Dry Ice) at -80F (70 psi)Transcritical Cycle (typical)Much Higher heat transfer potential (2-3x)Temperature ‘glide’ on heat rejection HXRefrigerant-Lubricant Viscosity22
Vapor CompressorsClassification of Vapor CompressorsPositive Displacement Machines [PD]: Reciprocating Piston, Rolling Piston, Scroll, Screw,Sliding Vane Rotodynamic (Turbo) Machines [RD]: Radial, Mixed-flow Centrifugal; Single and Multi-stage23
Positive Displacement Vapor CompressorsCompressor Application RangeCentrifugal [HVAC]Screw [HVAC]SH Recip [HVAC]H Recip [HVAC]Scroll [HVAC]Rotary [HVAC]0.11.010.0100.01000.010000.0ARI Capacity, Tons24
Positive Displacement CompressorsPiston (Reciprocating)25
Comparison of P-V DiagramsPressureClearance VolumeUp to 60%More CapacityRecip. Refrig.Recip. ACScroll/Screw (AC & Refrig.)Volume DisplacementPiston Compressor Volumetric Efficiency1.0Theoretical Volumeteric Efficiencyn 60.40.20.00102030405060Pressure Ratio26
Rolling Piston (Rotary) Compressor PumpTypical Rolling Piston CompressorASHRAE Handbook of Systems and Equipment, 200427
Hermetic Scroll CompressorScroll Compressor28
Scroll Compressor OperationScroll Operation (DTU)Typical Scroll Compressor PerformanceASHRAE Handbook of Systems and Equipment, 200429
Twin Screw (Lysholm) CompressorSingle Screw CompressorASHRAE Handbook of Systems and Equipment, 200430
Typical Screw Compressor PerformanceASHRAE Handbook of Systems and Equipment, 2004Over/Under-compression LossPercentage Over/Under-compression %20%0%0.01.02.03.04.05.0Relative Discharge Pressure (P d/P d*)31
Screw CompressorsEfficiency Improvement2.01.01.80.9CloseClose leakageleakage gapsgaps && reducereduce oiloil injectioninjection0.81.40.7Pump Efficiency1.20.61.00.50.80.4Leakage Losses0.6Flow & Viscous Losses0.30.40.20.20.10.0Isentropic EfficiencyRelative Loss1.60.00102030405060708090Male Rotor Tip Speed [m/s]Sliding Vane Compressor32
Centrifugal CompressorsCentrifugal Compressor33
Typical Centrifugal Compressor ImpellerASHRAE Handbook of Systems and Equipment, 2004Ns-Ds Diagram for Single-Stage CompressorsFrom O. E. Balje: Turbomachines - A Guide to Design Selection and Theory, Wiley, NY, '8134
2-Stage Centrifugal CompressorASHRAE Handbook of Systems and Equipment, 2004Polytropic Efficiency0.850η p 0.85; γ 1.10.848Isentropic 0.8301.02.03.04.05.06.07.08.09.010.0Pressure Ratio35
Typical Centrifugal Compressor PerformanceVariable-Speed ControlIGV Control – Fixed SpeedASHRAE Handbook of Systems and Equipment, 2004Centrifugal Chiller Part-Load PerformanceASHRAE Handbook of Systems and Equipment, 200436
Comparison of Chiller CompressorsASHRAE Handbook of Systems and Equipment, 2004Expansion Devices37
Short Restrictor Expansion DeviceASHRAE Handbook of Refrigeration, 2004Thermostatic Expansion ValveASHRAE Handbook of Refrigeration, 200438
Constant-Pressure Expansion ValveASHRAE Handbook of Refrigeration, 2004Float-controlled Expansion ValveASHRAE Handbook of Refrigeration, 200439
Thermally Activated Heat Pump ConceptASHRAE Handbook of Refrigeration, 2004Single-Effect LiBr-H2O Absorption CycleCondenserGenerator4"364'Solution HXPump2751EvaporatorAbsorber40
Practical Configuration of LiBr-H2O SystemASHRAE Handbook of Refrigeration, 2004Mixture Phase DiagramsSat. TemperatureP2P1TsatLiquid Mole-Fraction0.00.10.2Vapor Mole-Fraction0.30.40.50.60.70.80.91.0Mole Fraction, x41
Single-Effect LiBr-H2O Cycle Duhring DiagramP6PCPure H2O; x 03x xw4', 4"x xsCrystallizationPE1, 72TETC TA5TGTDouble-Effect LiBr-H2O Absorption Cycle [1]Condenser4"Generator 289Generator 164'7"7'3'63Solution HXSolution HXPump510Pump2841EvaporatorAbsorber3'42
Double-Effect LiBr-H2O Absorption Cycle [2]CondenserGenerator 1Generator 28'84"103'34'9"459'Solution HX6Pump1226'1EvaporatorAbsorberSingle-Effect LiBr-H2O Cycle Duhring DiagramP7PCPure H2O; x 03x xw4, 6x xsCrystallizationPE1, 82TETC TA5TGT43
Pumpless Aqua-Ammonia SystemBubble PumpASHRAE Handbook of Refrigeration, 2004Simple and Regenerative Reversed Brayton CycleT22′3′3146, 1′5S44
Regenerative Air CycleAmbient airRecuperatorGas CoolerPowerExp.Comp.ConditionedSpaceSimple Air Cycle Performance0.6Load T 010.0Expander Pressure RatioTa 35 ºC; εR 0.9; η′E 0.88; η′C 0.87; δP/P 0.05; ΔTA 10 ºC45
Regenerative Air Cycle Performance0.6Load T 78.00.2-98.0-118.00.10.01.02.03.04.05.06.0Expander Pressure RatioTa 35 ºC; εR 0.9; η′E 0.88; η′C 0.87; δP/P 0.05; ΔTA 10 ºCComparison of Air Liquefaction Cycles12000kJ/kg Liquid e VCPrecooler(-45 C)DualPressureLindeDualPressureLinde VCPrecoolerClaude46
Rotary Magnetic Refrigerator47
Psychrometric Chart (ASHRAE) Psychrometric Processes Cool Heat Humidify Dehumidify Cool & Dehumidify Air Conditioning Systems Cool & Dehumidify Air. 3 A/C System Psychrometric Processes Room Condition Line Coil temperature must be cooler than room dew point (DP) to dehumidify the air Coil Inlet Room Return Air Outdoor Air Room DP Coil Exit Reversed Carnot Cycle s T T C T H. 4 0.0