Transcription
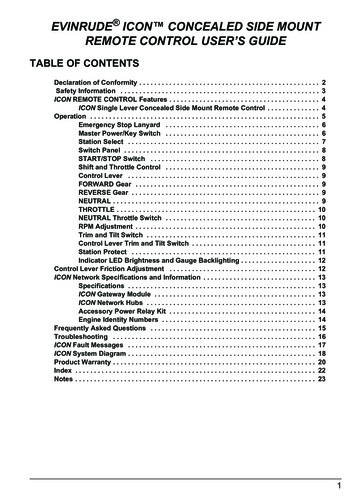
These tools are new in: escriptionExampleAdd one or more points in your data streamto review and verify your data.Allows users to get a look at their data anywhere inthe processQuery records based on an expression to splitdata into two streams, True (records thatsatisfy the expression) and False (those thatdo not).If you are looking at a dataset of customers, youmay want to only keep those customer records thathave greater than 10 transactions or a certain levelof sales.Create or update fields using one or moreexpressions to perform a broad variety ofcalculations and/or operations.For instance if there is missing or NULL value, youcan use the formula tool to replace that NULL valuewith a zero.Basically all of the formulas you can do in excel youcan do inside Alteryx formula tool – so many more!Connect to disparate datasets.InputBring data into your module by selecting a fileor connecting to a database (optionally, usinga query).JoinCombines two inputs based on a commonalitybetween the two tables. Its function is like aSQL join but gives the option of creating 3outputs resulting from the join.Can be used to join Customer profile data as well astransactional data, and join the two data sourcesbased on a unique customer IDOutput the contents of a data stream to a fileor database.Loading enriched data back into a database.Limit the data stream to a number,percentage, or random set of records.Choosing the first 10 records for each region ofpreviously sorted data so that you end up with thetop 10 stores in each region.Select, deselect, reorder and rename fields,change field type or size, and assign adescription.If your workflow only requires 5 fields out of 50 thatare read in from the file/database, you can deselectall but the 5 required fields to speed up processingdownstream.Sort records based on the values in one ormore fields.Allows you to sort data records intoascending/descending order- such as ranking yourcustomers based on the amount of they spendSummarize data by grouping, summing,counting, spatial processing, stringconcatenation, and much more. The outputcontains only the results of the calculation(s).You could determine how many customers you havein the state of NY and how much they have spent intotal or an average per transaction.Add annotation or images to the modulecanvas to capture notes or explain processesfor later reference.This will allow uses to document what they didduring a certain portion of the analysis, so otherusers have an understanding of what they werebuilding in the workflow.OutputSampleSelectSortSummarizeComment
These tools are new in: 9.0Text InputUnionInput/OutputIconToolBrowseDate TimeNowDirectoryInputMap Input9.19.510.0Manually add data which will be stored in themodule.A lookup table where you are looking for certainwords or codes to be replaced with newclassifications. You could create a Find field and aReplace field to populate with the values needed.Combine two or more data streams withsimilar structures based on field names orpositions. In the output, each column willcontain the data from each input.Transaction data stored in different files for differenttime periods, such as a sales data file for March anda separate one for April, can be combined into onedata stream for further processing.DescriptionExampleAdd one or more points in your data stream toreview and verify your data.Allows users to get a look at their data anywhere inthe processInput the current date and time at moduleruntime, in a format of the user's choosing.(Useful for adding a date-time header to areport.)This is a useful tool to easily add a date time headerfor a reportInput a list of file names and attributes from aspecified directory.Lists all files in a directory- can be used inconjunction with the Dynamic Input tool to bring inthe most recent data file that is availableBring data into your module by selecting a fileor connecting to a database (optionally, usinga query).Connect to disparate datasets.Manually draw or select map objects (points,lines, and polygons) to be stored in themodule.Output results to google maps, and allow interactionwith the results for example. Not really! This tool isonly so you can pick a spatial object, either bydrawing or selecting one, to use in your module(app).Output to data- anywhere we can read from, we canoutput to – no – we have some formats we can readonly. Example- loading enriched data back into adatabaseOutput the contents of a data stream to a fileor database.OutputManually add data which will be stored in themodule.Manually store data or values inside the Alteryxmodule- example- a lookup table where you arevalues of segmentation groups and you want thedescription nameThis tool enables access to an XDF format file(the format used by Revolution R Enterprise'sRevoScaleR system to scale predictiveanalytics to millions of records) for either: (1)using the XDF file as input to a predictiveanalytics tool or (2) reading the file into anAlteryx data stream for further data hygieneor blending activitiesThis tool reads an Alteryx data stream into anXDF format file, the file format used byRevolution R Enterprise's RevoScaleR systemto scale predictive analytics to millions ofrecords. By default, the new XDF files isstored as a temporary file, with the option ofwriting it to disk as a permanent file, whichcan be accessed in Alteryx using the XDFInput toolThis can be used when building and runningpredictive analytics procedures on large amounts ofdata that open source R has difficulty computing (specifically Linear Regression, Logistic Regression,Decision Trees, Random Forests, Scoring, Lift Chart)Text InputXDF InputXDFOutputPreparation 17 toolsIconToolDescriptionThis can be used when building and runningpredictive analytics procedures on large amounts ofdata that open source R has difficulty computing (specifically Linear Regression, Logistic Regression,Decision Trees, Random Forests, Scoring, Lift Chart)Example
These tools are new in: 9.0Auto FieldFilterDate nningMulti-FieldFormulaMulti-RowFormulaRandom %Sample9.19.510.0Automatically set the field type for each stringfield to the smallest possible size and typethat will accommodate the data in eachcolumn.Trying to identify the best fit field for text basedinputs. Make the data streaming into Alteryx assmall as possible to limit processing time and ensureproper formats for downstream processes.Query records based on an expression to splitdata into two streams, True (records thatsatisfy the expression) and False (those thatdo not).Allows users to exclude values – all fields comethrough! in the stream- for instance if you arelooking at a dataset of customers, you may want toeliminate certain characteristics of that customersuch as race or sexThe Date Filter macro is designed to allow auser to easily filter data based on a datecriteria using a calendar based interface.Return transaction records by specifying a start andend date.Create or update fields using one or moreexpressions to perform a broad variety ofcalculations and/or operations.For instance if there is missing or NULL value, youcan use the formula tool to replace that NULL valuewith a zeroCreate new rows of data. Useful for creating asequence of numbers, transactions, or dates.Creating data specifically time series data, Create365 unique records for each day of year.Update specific values in a numeric data fieldwith another selected value. Useful forreplacing NULL () values.For example, if you have a data set that is missinginformation, such as salary, and displays (NULL)rather than just making it zero, you can use themean or median to fill in the NULL, to improveaccuracy of the results.For instance if you have transactional data, you cangroup them into different buyer personas- i.e. Malesbetween 30-35 that spend between 1k permonth, etc Group multiple numeric fields into tiles orbins, especially for use in predictive analysis.Create or update multiple fields using a singleexpression to perform a broad variety ofcalculations and/or operations.For instance if there is missing or NULL value onmultiple fields, you can use the formula tool toreplace that NULL value with a zeroCreate or update a single field using anexpression that can reference fields insubsequent and/or prior rows to perform abroad variety of calculations and/oroperations. Useful for parsing complex dataand creating running totals.Generate a random number or percentage ofrecords passing through the data stream.Creating unique identifiers at a group level- crossrow comparisons- Sales volume for yr1, yr2, yr3 indifferent rows and want to notice the differencebetween the sales in each of these rowsAssign a unique identifier to each record.This can be used to assign a customer id to a legacytransaction, allowing for more accurate directmarketing/promotional offerings in the futureLimit the data stream to a number,percentage, or random set of records.Allows you to select a subset of data/records foryour analysis- Can be used to focus on a selectgroup of related records or transactions for analysissuch as selecting all items in an online shopping cartSelect, deselect, reorder and rename fields,change field type or size, and assign adescription.Allows you to determine a specific subset of recordsshould or should not be carried down throughout theanalysis- for instance if we are looking at customertransactional data and we want to eliminate alltransactions that are less than 5K)Record IDSampleSelectIf you want to base your analysis based on 35% ofthe data for instance, it will randomly return records
These tools are new in: 9.0SelectRecords9.19.510.0Select specific records and/or ranges ofrecords including discontinuous ranges. Usefulfor troubleshooting and sampling.If a user wants to find records that are less than 100 or in a range of 100- 150 it will returnrecords in this rangeSort records based on the values in one ormore fields.Allows you to sort data records intoascending/descending order- such as locating yourtop 1000 customers based on the amount of theyspendGroup data into sets (tiles) based on valueranges in a field.Creating logical groups of your data. User definedbreaks or statistical breaks. Very good forbucketing high valued customers vs. low valuedcustomersSeparate data into two streams, duplicate andunique records, based on the fields of theuser's choosing.Only want to mail to one individual, and based on aunique identifier(customer id)SortTileUniqueJoin 9 eGroupFuzzyMatchDun nExampleAppend the fields from a source input to everyrecord of a target input. Each record of thetarget input will be duplicated for every recordin the source input.Adding small value to a million records. A small tobig merge- Adding time stamps as well as the nameof the users who last accessed it onto your databaserecords.Search for data in one field from one datastream and replace it with a specified fieldfrom a different stream. Similar to an ExcelVLOOKUP.Think of this like Excel- find and replace. Lookingfor something and then replacing.Combine two data streams based on commonfields (or record position). In the joinedoutput, each row will contain the data fromboth inputs.For instance this can be used to join Customerprofile data as well as transactional data, and jointhe two data sources based on a unique customer IDCombine two or more inputs based oncommon fields (or record position). In thejoined output, each row will contain the datafrom both inputs.For instance this can be used to join Customerprofile data as well as transactional data, and jointwo or more data sources based on a uniquecustomer IDThe Make Group tool takes data relationshipsand assembles the data into groups based onthose relationships.Used primarily with Fuzzy Matching- ID 1 can match10 different values from source 2 and that becomesa group.Identify non-identical duplicates in a datastream.Helps determine similarities in your data. Forinstance if you have 2 different data sets withdifferent ID, looking a names and address as a wayto standard and matching them up based on thesetypes of characteristics- and displays all of the id’sthat matchMatching a business listing file to Dun andBradstreet.Match your customer or prospect file to theDun & Bradstreet business file. (Requires,Alteryx with Data Package and installation ofthe Dun & Bradstreet business location file.)Combine two or more data streams withsimilar structures based on field names orpositions. In the output, each column willcontain the data from each input.Can be used to combine datasets with similarstructures, but with different data. You might havetransaction data stored in different files for differenttime periods, such as a sales data file for March anda separate one for April. Assuming that they havethe same structure (the same fields), Union will jointhem together into one large file, which you canthen analyze
These tools are new in: 9.0Parse 4 ToolsIconToolDate TimeRegExText toColumnsXML Parse9.19.510.0DescriptionExampleTransform date/time data to and from avariety of formats, including both expressionfriendly and human readable formats.Easy conversion between strings and actual datetime formats- Example- taking Military time intostandard times. Or turning Jan 1, 2012 into 1.1.12,etc.Parse, match, or replace data using regularexpression syntax.An example would be if someone is trying to parseunstructured text based files- Weblogs or data feedsfrom twitter, helps arrange the data for analyticalpurposes into rows and columns.Split the text from one field into separaterows or columns.Allows you bring customer data from an excel file forinstance that contains first name and last name inone column and split them up into 2 columns so firstname is in one column and last name is in the othercolumn- this will make it easy to sort and analyzeCleaning an xml file, parse xml textRead in XML snippets and parse them intoindividual fields.Transform 7 ToolsIconToolDescriptionArrangeCountRecordsCross ed for staging data for reportsCount the records passing through the datastream. A count of zero is returned if norecords pass through.Returns a count of how many records are goingthrough the toolPivot the orientation of the data stream sothat vertical fields are on the horizontal axis,summarized where specified.Think of it as a way to change your excelspreadsheet that has a column of customer ID’s andthen next to a column of revenue. This will turnthese two columns into two rowsCalculate a cumulative sum per record in adata stream.Can take 3 columns of sales totals and summarize 3yr totals of sales by that row. ( ie yr 1 sales 10K, yr2 15K, yr 3 25K)Summarize data by grouping, summing,counting, spatial processing, stringconcatenation, and much more. The outputcontains only the results of the calculation(s).For instance if you wanted to look at a certain groupof customers of a certain age or income level, or getan idea of how many customers you have in thestate of NYPivot the orientation of the data stream sothat horizontal fields are on the vertical axis.Think of it as a way to change your excelspreadsheet that has a row of customer ID’s andthen below that a row of revenue. This will turnthese two rows into two columnsCalculate the weighted average of a set ofvalues where some records are configured tocontribute more than others.So if you are looking at calculating average spend,this will determine and “weight” if there are certaincustomers spending levels that are contributing tothe tingExampleManually transpose and rearrange fields forpresentation purposes.Create a chart (Area, Column, Bar, Line, Pie,etc.) for output via the Render tool.ExampleCreate bar, line, pie charts
These tools are new in: 9.0Email9.19.510.0Send emails for each record withattachments or e-mail generated reports ifdesired.Allows you to create dynamically updated emailcontentAdd an image for output via the Render tool.Add graphics/image that will be included in reportArrange two or more reporting snippetshorizontally or vertically for output via theRender tool.How to arrange the pieces of your reportCreate a map for output via the Render tool.Create a map for a reportRecombine the component parts of a maplegend (created using the Map LegendSplitter) into a single legend table, aftercustomization by other tools.Takes a customized legend and reassembles it.Split the legend from the Report Map toolinto its component parts for customization byother tools. (Generally recombined by theMap Legend Builder.)Help customize legends by adding symbols such as or % for instance or removing redundant textArrange reporting snippets on top of oneanother for output via the Render tool.Allows you to specify how to put a map togetherexample, putting a legend inside a map – I’dsuggest a different example such as overlaying atable and chart onto a mapOutput report snippets into presentationquality reports in a variety of formats,including PDF, HTML, XLSX and DOCX.Saves reports out of AlteryxAdd a footer to a report for output via theRender tool.Apply a footer to the reportAdd a header to a report for output via theRender tool.Apply a header to the reportCreate a data table for output via the Rendertool.Creates table for selected data fieldsAdd and customize text for output via theRender tool.Allows you to customize a title or other text relatedaspects to your reportDescriptionExampleAdd annotation or images to the modulecanvas to capture notes or explain processesfor later reference.This will allow users to document what they didduring a certain portion of the analysis, so otherusers have an understandingAdd a web page or Windows Explorer windowto your canvas.Helps you organize URL embedded into the canvas –I suggest a different example: Display a web pagefor reference in the module or use it to show ashared directory of macrosImageLayoutReport MapMap LegendBuilderMap rTableReport TextDocumentationIconToolCommentExplorerBox
These tools are new in: 9.0ToolContainer9.19.510.0Organize tools into a single box which can becollapsed or disabled.Spatial 15 FindNearestGeneralizeHeat MapMake patial InfoSpatialMatchSpatialProcessHelps you organize your module.ExampleExpand or contract the extents of a spatialobject (typically a polygon).Identify all of the business on a road, by placing abuffer on that road to determine who theyare/where they areCreate spatial points in the data streamusing numeric coordinate fields.Finding a spatial ref to a longitude, latitudeCalculate the distance or drive time betweena point and another point, line, or polygon.Creating the drive distance or drive time to acustomer locationIdentify the closest points or polygons in onefile to the points in a second file.As a customer, find me the nearest location to visit,optimizing my driving routeSimplify a polygon or polyline object bydecreasing the number of nodes.Object processing- generating an output map of acoastal boundary and you don’t need it to be toodetailed – significantly decrease the physical size ofa spatial record can increase processing timeGenerate polygons representing differentlevels of "heat" (e.g. demand) in a givenarea, based on individual records (e.g.customers)Could be used to view where there is a heavieramount of households in a certain locationCreate a grid within spatial objects in thedata stream.Use it to bucket on the ground where theircustomers are coming from (area, etc.)Create drive time trade areas that do notoverlap for a point file.Create drive time trade areas that do not overlap,for
Auto Field Automatically set the field type for each string field to the smallest possible size and type that will accommodate the data in each column. Trying to identify the best fit field for text based inputs. Make the data streaming into Alteryx as small as possible to limit processing