Transcription
Image description. Cover Image End of image description.NATIONAL CENTER FOR EDUCATION STATISTICSWhat Is IPEDS?The Integrated Postsecondary Education DataSystem (IPEDS) is a system of survey componentsthat collects data from about 7,000 institutions thatprovide postsecondary education across the UnitedStates. IPEDS collects institution-level data onstudent enrollment, graduation rates, studentcharges, program completions, faculty, staff, andfinances.These data are used at the federal and state level forpolicy analysis and development; at the institutionallevel for benchmarking and peer analysis; and bystudents and parents, through the College Navigator(http://collegenavigator.ed.gov), an online tool to aidin the college search process. For more informationabout IPEDS, see http://nces.ed.gov/ipeds.What Is the Purpose of This Report?The Data Feedback Report is intended to provideinstitutions a context for examining the data theysubmitted to IPEDS. The purpose of this report is toprovide institutional executives a useful resource andto help improve the quality and comparability ofIPEDS data.What Is in This Report?As suggested by the IPEDS Technical Review Panel,the figures in this report provide selected indicatorsfor your institution and a comparison group ofinstitutions. The figures are based on data collectedduring the 2016-17 IPEDS collection cycle and arethe most recent data available. This report provides alist of pre-selected comparison group institutions andthe criteria used for their selection. Additionalinformation about these indicators and the preselected comparison group are provided in theMethodological Notes at the end of the report.Where Can I Do More with IPEDS Data?Each institution can access previous Data FeedbackReports as far back as 2005 and customize thislatest report by using a different comparison groupand IPEDS variables of its choosing. To downloadarchived reports or customize the current DataFeedback Report (DFR), please visit our website gale CollegeOgden, UT
Nightingale CollegeCOMPARISON GROUPComparison group data are included to provide a context for interpreting your institution’s statistics. If your institution did not define a customcomparison group for this report by July 14, 2017 NCES selected a comparison group for you. (In this case, the characteristics used to definethe comparison group appears below.) The Customize Data Feedback Report functionality on the IPEDS Data Center at this provided link(http://nces.ed.gov/ipeds/datacenter/) can be used to reproduce the figures in this report using different peer groups.Using some of your institution's characteristics, a group of comparison institutions was selected for you. The characteristics include degreegranting four-year primarily associate's, Carnegie Classification of Special Focus Institutions--Other health professions schools, private forprofit. This comparison group includes the following 39 institutions:Ambria College of Nursing (Hoffman Estates, IL)American College for Medical Careers (Orlando, FL)American College of Healthcare Sciences (Portland, OR)AmeriTech College-Draper (Draper, UT)Angeles College (Los Angeles, CA)Arizona College-Mesa (Mesa, AZ)Baptist Health System School of Health Professions (San Antonio, TX)Broadview University-West Jordan (West Jordan, UT)Brown Mackie College-Fort Wayne (Fort Wayne, IN)Brown Mackie College-Salina (Salina, KS)Brown Mackie College-St Louis (Fenton, MO)Bryant & Stratton College-Akron (Copley, OH)Bryant & Stratton College-Wauwatosa (Wauwatosa, WI)Concorde Career College-Kansas City (Kansas City, MO)Daymar College-Owensboro (Owensboro, KY)Eastern International College-Belleville (Belleville, NJ)Eastern International College-Jersey City (Jersey City, NJ)Eastwick College-Ramsey (Ramsey, NJ)Galen College of Nursing-Louisville (Louisville, KY)Global Health College (Alexandria, VA)Herzing University-Minneapolis (Minneapolis, MN)Herzing University-Winter Park (Winter Park, FL)Hondros College of Nursing (Westerville, OH)Miami Regional University (Miami Springs, FL)Miller-Motte College-Wilmington (Wilmington, NC)National American University-Centennial (Centennial, CO)National American University-Rochester (Rochester, MN)National American University-Tulsa (Tulsa, OK)National American University-Zona Rosa (Kansas City, MO)Pacific College (Costa Mesa, CA)Pacific College of Oriental Medicine-Chicago (Chicago, IL)Pima Medical Institute-Tucson (Tucson, AZ)Platt College-Los Angeles (Alhambra, CA)Spencerian College-Louisville (Louisville, KY)St Louis College of Health Careers-Fenton (Fenton, MO)Stanbridge University (Irvine, CA)The College of Health Care Professions-Northwest (Houston, TX)Unitek College (Fremont, CA)Virginia College-Charleston (North Charleston, SC)The figures in this report have been organized and ordered into the following topic areas:1) Admissions (only for non-open-admissions schools)[No charts applicable]2) Student EnrollmentFig. 1 and 2Pg. 33) AwardsFig. 3Pg. 34) Charges and Net Price[No charts applicable]5) Student Financial AidFig. 4, 5, 6 and 76) Military Benefits*[No charts applicable]7) Retention and Graduation RatesFig. 8, 9, 10, 11 and 12Pg. 5 and 68) FinanceFig. 13 and 14Pg. 79) StaffFig. 15 and 16Pg. 710) Libraries*[No charts applicable]Pg. 4*These figures only appear in customized Data Feedback Reports (DFR), which are available through Use the Data portal on the IPEDS website.IPEDS DATA FEEDBACK REPORT2
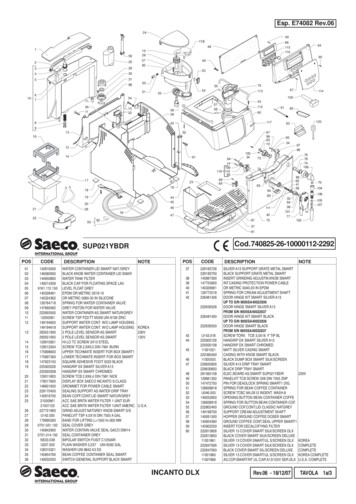
Nightingale CollegeFigure 1.Percent of all students enrolled, by race/ethnicity, and percent of students who are women: Fall 2016Image description.BarchartwithPercent.10 groups with 2 items per group.Y scaletitledGroupAmericanIndianor hoverAlaska Native.Item1,1,Yourinstitution0.01,on image.Item2,ComparisonGroupMedian text(N 39)0.01, hover text on image.GroupAsian.Item1,2,Yourinstitution1, hovertext(N 39)on image.Item2,ComparisonGroupMedian2, hover text on image.GroupBlackor AfricanAmerican.Item1,3,Yourinstitution4, hovertext(N 39)on image.Item2,ComparisonGroupMedian19, hover text on 7, hovertext(N 39)on image.Item2,ComparisonGroupMedian11, hover text on image.GroupNativeHawaiianorother textPacificIslander.Item 2,1,5,Yourinstitution0.01,hoveron image.ItemComparisonGroupMedian(N 39)0.01, hover text on image.GroupWhite.Item1,6,Yourinstitution87, hovertexton image.Item2,ComparisonGroupMedian(N 39)44, hover text on image.Group7,Twoinstitutionor moreraces.Item1,Your0.01,Medianhover texton image.Item 2,8,ComparisonGroup(N 39)2, hover text on image.GroupRace/ethnicityItem1, ComparisonYourinstitution1,unknown.hovertext(N 39)on image.Item2,GroupMedian3, hover text on n0.01,Medianhover texton image.Item2,ComparisonGroup(N 39)0.01, hover text on image.GroupWomen.Item1,10,Yourinstitution85, hovertexton image.Item2,ComparisonGroupMedian(N 39)85, hover text on image.Race/ethnicityor : Your institutionShapeComparisonGroupLegend,Label: Comparison Group Median (N arisonGroupLegendLine2,Label:End of image 00211174002013000American Indian orAlaska NativeAsianBlack orAfrican AmericanHispanic/LatinoNative Hawaiianor otherPacific IslanderWhiteTwo or more racesRace/ethnicityunknownNonresident alienWomenRace/ethnicity or genderYour institutionComparison Group Median (N 39)NOTE: For more information about disaggregation of data by race and ethnicity, see the Methodological Notes. Median values for the comparison group will not add to 100%. See "Use ofMedian Values for Comparison Group" for how median values are determined. N is the number of institutions in the comparison group.SOURCE: U.S. Department of Education, National Center for Education Statistics, Integrated Postsecondary Education Data System (IPEDS): Spring 2017, Fall Enrollment component.Figure 2.Unduplicated 12-month headcount of all students and ofundergraduate students (2015-16), total FTE enrollment(2015-16), and full- and part-time fall enrollment (Fall2016)Figure 3.Number of degrees awarded, by level: 2015-16Image description.Level of degreeHorizontalBarNumberchart with6 groups with 2 items per group.Xscale1,titledof itution0.01.MedianItem 1,2, YourComparisonGroup(N 39) rinstitution0.01.MedianItem2,ComparisonGroup(N 39) 1.Median (N 39) urinstitution0.01.Median (N 39) Yourinstitution2. Median (N 39) 6.Item2,ComparisonGroupGroupAssociate's.Item 2,1,6,Yourinstitution86. Median (N 39) tionLegend,Label: Your institutionShapeComparisonGroupLegend,Label: Comparison Group Median (N arisonGroupLegendLine2,Label:End of image description.Image description.EnrollmentBarmeasureHorizontalchart with5 groups with 2 items per pUnduplicatedtotal.Iteminstitution367.Median- (N 39)Item 1,2, YourComparisonGroup692.GroupUnduplicatedheadcount - mparisonGroupMedian (N 39) 671.GroupTotalFTE enrollment.Item1,3,Yourinstitution218.Median (N 39) ent.Item1,4,Yourinstitution210.Median (N 39) ent.Item1,5,Yourinstitution36. Median (N 39) tutionLegend,Label: Your institutionShapeComparisonGroupLegend,Label: Comparison Group Median (N arisonGroupLegendLine2,Label:End of image description.Enrollment measureLevel of degreeUnduplicatedheadcount - total367Unduplicatedheadcount undergraduates367Doctor's 0Research/0Scholarship692Doctor's 0Professional0Practice671Doctor's 0Other 0218Total FTEenrollment413Master's00210Full-timefall enrollment2312Bachelor's636Part-timefall enrollment086Associate's55200400600800890Number of studentsYour institution406080100Number of degreesComparison Group Median (N 39)NOTE: For details on calculating full-time equivalent (FTE) enrollment, see CalculatingFTE in the Methodological Notes. Total headcount, FTE, and full- and part-time fallenrollment include both undergraduate and postbaccalaureate students, when applicable.N is the number of institutions in the comparison group.SOURCE: U.S. Department of Education, National Center for Education Statistics,Integrated Postsecondary Education Data System (IPEDS): Fall 2016, 12-monthEnrollment component and Spring 2017, Fall Enrollment component.20Your institutionComparison Group Median (N 39)NOTE: For additional information about postbaccalaureate degree levels, see theMethodology Notes. N is the number of institutions in the comparison group.SOURCE: U.S. Department of Education, National Center for Education Statistics,Integrated Postsecondary Education Data System (IPEDS): Fall 2016, Completionscomponent.IPEDS DATA FEEDBACK REPORT3
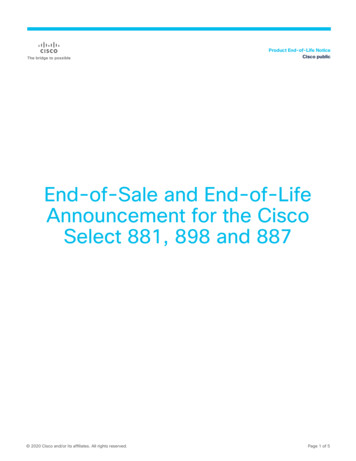
Nightingale CollegeFigure 4.Percent of full-time, first-time degree/certificate-seekingundergraduate students who were awarded grant orscholarship aid from the federal government, state/localgovernment, or the institution, or loans, by type of aid:2015-16Image description.Typeof aidBar chart with 8 groups with 2 items per group.HorizontalXscale1,titledPercentof students.GroupAnyinstitutiongrant aid.Item1, ComparisonYour81. Median (N 36) 84.Item2,GroupGroup2, Federalgrants.Iteminstitution67. Median (N 36) 71.Item 1,2, 1,3,Your67. Median (N 36) m1,4,Yourinstitution14. Median (N 36) em1,5,Yourinstitution16. Median (N 36) 4.Item2,ComparisonGroupAnyinstitutionloans. GroupItem1,6,Your74. Median (N 36) 82.Item2,ComparisonGroupGroupFederalloans.Item 2,1,7,Yourinstitution74. Median (N 36) institution7. Median (N 36) utionLegend,Label: Your institutionShapeComparisonGroupLegend,Label: Comparison Group Median (N arisonGroupLegendLine2,Label:End of image description.Type of aidAny grantaid81Federalgrants67Pellgrants67Any grantaid (N 35)84Federalgrants (N 35) 3,933 4,40171Pellgrants (N 35) 3,933 4,17914State/localgrants (N 22)Any loans74Federalloans7420 2,422 4,614 2,000Any loans(N 35)82 9,164 7,404Other loans(N 20)7102030405060708090100 11,357 6,244 0 2,000Percent of studentsYour institution 10,221 8,112Federalloans (N 35)81Other loans 1,301Institutionalgrants (N 23)164 4,368 4,797715InstitutionalgrantsAverage amounts of grant or scholarship aid from thefederal government, state/local government, or theinstitution, or loans awarded to full-time, first-timedegree/certificate-seeking undergraduate students, bytype of aid: 2015-16Image description.Typeof aidBar chart with 8 groups with 2 items per nstitutiongrantaid 4368.(N 35).Item1, ComparisonYourItem2,GroupMedian 4797.Group2, Federalgrants(N 35).Iteminstitution 3933.Item 1,2, YourComparisonMedian 4401.GroupPellinstitutiongrants Group(N 35).Item1,3,Your ants(N 22). 4179.Item1,4,Yourinstitution grants(N 23). 2422.Item1,5,Yourinstitution 4614.Item2,ComparisonMedian 2000.GroupAnyinstitutionloans Group(N 35).Item1,6,Your 10221.Item2,ComparisonGroupMedian 8112.GroupFederalloans(N 35).Item 2,1,7,Yourinstitution 9164.ItemComparisonMedian 7404.GroupOtherloansGroup(N 20).Item1,8,Yourinstitution 11357.Item2,ComparisonGroupMedian 6244.Shapeline,Label:ShapeInstitutionLegend,Label: Your institutionShapeComparisonGroupLegend,Label: Comparison Group omparisonGroupLegendLine2,Label:End of image description.Type of aidState/localgrantsFigure 5. 4,000 6,000 8,000 10,000 12,000Aid dollarsComparison Group Median (N 36)Your institutionComparison Group MedianNOTE: Any grant aid above includes grant or scholarship aid awarded from the federalgovernment, state/local government, or the institution. Federal grants includes Pell grantsand other federal grants. Any loans includes federal loans and other loans awarded tostudents. For details on how students are counted for financial aid reporting, see CohortDetermination in the Methodological Notes. N is the number of institutions in thecomparison group.SOURCE: U.S. Department of Education, National Center for Education Statistics,Integrated Postsecondary Education Data System (IPEDS): Winter 2016-17, StudentFinancial Aid component.NOTE: Any grant aid above includes grant or scholarship aid awarded from the federalgovernment, state/local government, or the institution. Federal grants includes Pell grantsand other federal grants. Any loans includes federal loans and other loans awarded tostudents. Average amounts of aid were calculated by dividing the total aid awarded by thetotal number of recipients in each institution. N is the number of institutions in thecomparison group.SOURCE: U.S. Department of Education, National Center for Education Statistics,Integrated Postsecondary Education Data System (IPEDS): Winter 2016-17, StudentFinancial Aid component.Figure 6.Figure 7.Percent of all undergraduates awarded aid, by type ofaid: 2015-16Average amount of aid awarded to all undergraduates, bytype of aid: 2015-16Image description.Type of aidBar chart with 3 groups with 2 items per nstitutiongrantaid. 5355.ItemItem 1,2, YourComparisonMedian (N 39) 4425.GroupPellinstitutiongrants.GroupItem1,2,Your 3701.Item2,ComparisonGroupMedian (N 39) 3990.GroupFederalloans.Item1,3,Yourinstitution 8471.Item2,ComparisonGroupMedian (N 39) 8129.Shapeline,Label:ShapeInstitutionLegend,Label: Your institutionShapeComparisonGroupLegend,Label: Comparison Group Median (N arisonGroupLegendLine2,Label:End of image description.Image description.Type of aidBar chart with 3 groups with 2 items per group.HorizontalXscale1,titledPercentof students.GroupAnyinstitutiongrant aid.Item70. Median (N 39) 76.Item 1,2, 1,2,Your62. Median (N 39) Yourinstitution74. Median (N 39) tutionLegend,Label: Your institutionShapeComparisonGroupLegend,Label: Comparison Group Median (N arisonGroupLegendLine2,Label:End of image description.Type of aidType of aid70 5,355Any grant aidAny grant aid76 4,42562 3,701Pell grantsPell grants66 3,99074Federalloans01020304050607080 8,471Federalloans7690100 8,129 0Percent of studentsYour institution 4,000 6,000 8,000 10,000Aid dollarsComparison Group Median (N 39)NOTE: Any grant aid above includes grant or scholarship aid awarded from the federalgovernment, state/local government, the institution, or other sources. Federal loansincludes only federal loans awarded to students. N is the number of institutions in thecomparison group.SOURCE: U.S. Department of Education, National Center for Education Statistics,Integrated Postsecondary Education Data System (IPEDS): Winter 2016-17, StudentFinancial Aid component. 2,000Your institutionComparison Group Median (N 39)NOTE: Any grant aid above includes grant or scholarship aid from the federal government,state/local government, the institution, or other sources. Federal loans includes federalloans to students. Average amounts of aid were calculated by dividing the total aidawarded by the total number of recipients in each institution. N is the number ofinstitutions in the comparison group.SOURCE: U.S. Department of Education, National Center for Education Statistics,Integrated Postsecondary Education Data System (IPEDS): Winter 2016-17, StudentFinancial Aid component.IPEDS DATA FEEDBACK REPORT4
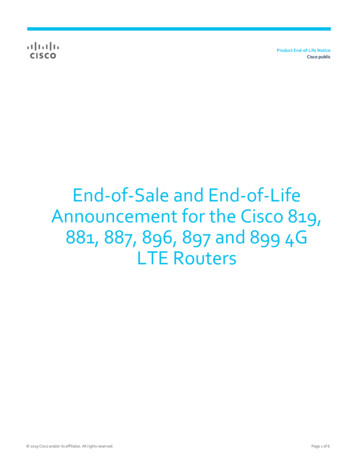
Nightingale CollegeFigure 8.Retention rates of first-time bachelor’s degree seekingstudents, by attendance level: Fall 2015 cohortFigure 9.Graduation and transfer-out rates of full-time, first-timedegree/certificate-seeking undergraduates within 150%of normal time to program completion: 2010 cohortImage description.MeasureHorizontalBarPercent.chart with 2 groups with 2 items per group.Xscale1,titledGroupGraduationrate,(N 31).Item1, ComparisonYourinstitution38. OverallItem2,GroupMedianGroup2, Transfer-outrate(N 8). 58.IteminstitutionNo data.Item 1,2, YourComparisonGroupMedian 8.Shapeline,Label:ShapeInstitutionLegend,Label: Your institutionShapeComparisonGroupLegend,Label: Comparison Group omparisonGroupLegendLine2,Label:End of image description.Image description.AttendancelevelHorizontalBarchart with 2 groups with 2 items per nrate (N 13).Item1, ComparisonYourinstitution50. MedianItem2,Group57.Group2, Part-timeretentionrate (N 6).IteminstitutionNo data.Item 1,2, YourComparisonGroupMedian 39.Shapeline,Label:ShapeInstitutionLegend,Label: Your institutionShapeComparisonGroupLegend,Label: Comparison Group omparisonGroupLegendLine2,Label:End of image description.Attendance levelMeasure5038Full-time retentionrate (N 13)Graduation rate,Overall (N 31)5758Part-time retentionrate (N 6)Transfer-out rate(N 8)390102030408506070809010001020PercentYour institution30405060708090100PercentComparison Group MedianYour inst
Eastwick College-Ramsey (Ramsey, NJ) Galen College of Nursing-Louisville (Louisville, KY) Global Health College (Alexandria, VA) Herzing University-Minneapolis (Minneapolis, MN) Herzing University-Winter Park (Winter Park, FL) Hondros Colle


![[Page 1 – front cover] [Show cover CLEAN GET- AWAY 978-1 .](/img/13/9781984892973-6648.jpg)