Transcription
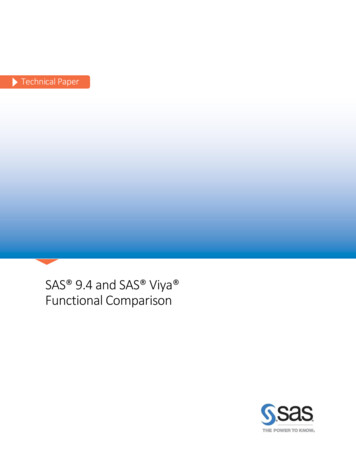
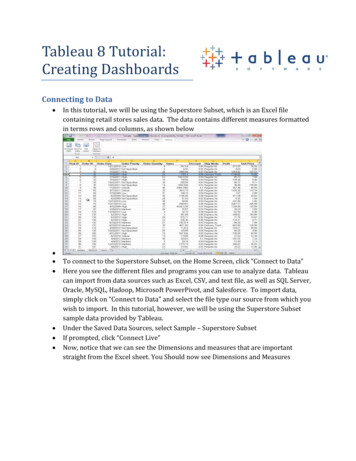
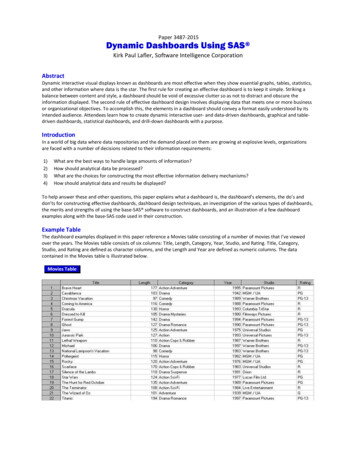
Paper 3487-2015Dynamic Dashboards Using SAS Kirk Paul Lafler, Software Intelligence CorporationAbstractDynamic interactive visual displays known as dashboards are most effective when they show essential graphs, tables, statistics,and other information where data is the star. The first rule for creating an effective dashboard is to keep it simple. Striking abalance between content and style, a dashboard should be void of excessive clutter so as not to distract and obscure theinformation displayed. The second rule of effective dashboard design involves displaying data that meets one or more businessor organizational objectives. To accomplish this, the elements in a dashboard should convey a format easily understood by itsintended audience. Attendees learn how to create dynamic interactive user- and data-driven dashboards, graphical and tabledriven dashboards, statistical dashboards, and drill-down dashboards with a purpose.IntroductionIn a world of big data where data repositories and the demand placed on them are growing at explosive levels, organizationsare faced with a number of decisions related to their information requirements:1)2)3)4)What are the best ways to handle large amounts of information?How should analytical data be processed?What are the choices for constructing the most effective information delivery mechanisms?How should analytical data and results be displayed?To help answer these and other questions, this paper explains what a dashboard is, the dashboard’s elements, the do’s anddon’ts for constructing effective dashboards, dashboard design techniques, an investigation of the various types of dashboards,the merits and strengths of using the base-SAS software to construct dashboards, and an illustration of a few dashboardexamples along with the base-SAS code used in their construction.Example TableThe dashboard examples displayed in this paper reference a Movies table consisting of a number of movies that I’ve viewedover the years. The Movies table consists of six columns: Title, Length, Category, Year, Studio, and Rating. Title, Category,Studio, and Rating are defined as character columns, and the Length and Year are defined as numeric columns. The datacontained in the Movies table is illustrated below.Movies Table
“Brief” History of DashboardsIn the world of information technology, a dashboard serves as a user interface to organize and display information visually inthe simplest way possible. Dashboards originated in the 1970’s as decision support tools and systems that served management,operations, and organizational planning. In the 1980’s, dashboards came of age as executive information systems emphasizinggraphical displays and simple user interfaces to assist with management decision making. In the 1990’s, dashboardsexperienced a growing interest with the rise of the Internet. As information technology and the Internet entered the 2000’s,vendors including SAS Institute, and others, offered high-end easy-to-use products for the development of comprehensive“custom” dashboards. The dashboards being built today offer users the ability to monitor key metrics, information summaries,and reports in a single easy-to-use user interface. As a result, dashboards are designed to alert users to key business issues thatimpact an organization’s tactics and strategies by facilitating improved decision making activities.So exactly what is a dashboard? In the paper, “Building Your First Dashboard Using the SAS 9 Business Intelligence Platform: ATutorial,” by Gregory S. Nelson (2009), Nelson describes a dashboard as a visualization technique that provides an immediateview or snapshot of exactly where you are in a specific process relative to your stated goals and objectives. He adds that, Visualindicators, such as temperature gauges, traffic lights and speedometers, help give a real-world sense of present progress andassists in making decisions, adapting to current conditions or drilling into more detailed information. As a user interface,dashboards display performance indicators (PIs), key performance indicators (KPIs), and other relevant information.Types of DashboardsThe first step in dashboard design is to understand the purpose and type of dashboard you will need. With three types ofdashboard designs available, users are encouraged to select the dashboard type that best meets your needs. The followingtable describes the three types of enterprise dashboards and their purpose.Dashboard TypePurposeStrategic DashboardsStrategic dashboards provide executives and managers with visual information to determine andsupport goals and objectives within an organization. This type of dashboard facilitatesmonitoring an organization’s health, progress, performance, and areas where improvement canbe made. There is typically no need for interactive features with this type of dashboard. Strategicdashboard examples include: Sales, Human Resources, Manufacturing, and Services.Analytical dashboards provide users with visual information to help gain a better understandingwith historical, present and future data; understand trends; allow comparisons to be made; anddetermine the type of adjustments that are needed. Analytical dashboards should allowinteractive features such as drill-down capabilities, as needed, to access more detailedinformation. Dashboard examples include: obtaining real-time data and information,determining why some things are working and others are not, identifying patterns andopportunities with your data, and aligning strategic objectives with performance initiatives.Operational dashboards provide users with visual information to concentrate on performancemonitoring and measurements, monitor the efficiency and effectiveness of their organization.There is typically a need to update information displayed in an operational dashboard frequentlyto make it relevant to the users’ needs. Dashboard examples include: improved understandingof performance, better focus and alignment, and faster and better decision making.Analytical DashboardsOperational DashboardsDashboard ElementsIn Malik Shadan’s (2007) paper, Elements for an Enterprise Dashboard, he mentions that there are basic and advancedcharacteristics specific to an enterprise dashboard. The basic characteristics encompass the acronym, SMART, and theadvanced characteristics of an enterprise dashboard encompass the acronym, IMPACT. The elements associated with eachacronym appear in the following tables.SMART Basic ElementsDescriptionSynergeticMonitor KPIsAccurateResponsiveTimelySynergize information in a single screen view.Display critical KPIs for effective decision making.Dashboard must be well tested and validated, and information must be accurate.Respond to user alerts and visual content to draw immediate attention to critical matters.Display information that is real-time and right-time for effective decision making.
IMPACT Advanced ElementsDescriptionInteractiveMore Data lityAllow user to drill-down and derive details, root causes and more.Allow users to review historical trends for any KPI.Display should be specific to each user’s domain of responsibility, data restrictions, and privileges.Allow users to perform guided analysis, compare, contrast, and make analytical inferences.Facilitate users’ ability to exchange notes regarding observations on their dashboard.Allow each user to customize the metrics they would like to track.Avoiding 13 Common Pitfalls in Dashboard DesignSuccessful dashboard design involves the transformation of quantitative data into meaningful and effective visual displaysincluding graphs, maps, gauges and summary information. In his paper, “Common Pitfalls in Dashboard Design,” Stephen Few(2006) proposes 13 common mistakes many make when designing dashboards. Instead of concentrating on what should bedone when designing dashboards, Mr. Few’s body of work espouses the most common mistakes along with detailedexplanations to help educate current and future designers alike. I have listed the 13 common pitfalls from Mr. Few’s seminalwork, below, but readers are encouraged to read his entire paper, see References, for a complete perspective.Stephen Few’s 13 Common Pitfalls in Dashboard Design (cited from reference)PitfallDescriptionPitfall #1Pitfall #2Pitfall #3Pitfall #4Pitfall #5Pitfall #6Pitfall #7Pitfall #8Pitfall #9Pitfall #10Pitfall #11Pitfall #12Pitfall #13Exceeding the Boundaries of a Single ScreenSupplying Inadequate Context for the DataDisplaying Excessive Detail or PrecisionExpressing Measures IndirectlyChoosing Inappropriate Media of DisplayIntroducing Meaningless VarietyUsing Poorly Designed Display MediaEncoding Quantitative Data InaccuratelyArranging the Data PoorlyIneffectively Highlighting What’s ImportantCluttering the Screen with Useless DecorationMisusing or Overusing ColorDesigning an Unappealing Visual DisplaySteps to Creating a Dynamic Dashboard using Base-SAS Follow these basic steps to successfully construct a dynamic dashboard using the Base-SAS software.1.Connect to desired data sources using Libname statement.2.Create user-defined formats containing URL links for dashboard and drill-down results.3.Create Graphics, Bar Chart, Box Plot, Histogram, Pie, etc.4.Produce Graph Template using PROC SGRENDER;5.Produce Drill-down Detail Reports, Summary Reports, Statistics, Tables, etc.
ReferencesFew, Stephen (2006), “Common Pitfalls in Dashboard Design,” Copyright 2006, ProClarity Corporation, Boise, ID, pers/Common Pitfalls.pdfLafler, Kirk Paul (2012), “Exploring the SAS Metadata DICTIONARY Tables and SASHELP Views,” Proceedings of the 2012 SouthCentral SAS Users Group Conference, Software Intelligence Corporation, Spring Valley, CA, USA. 012.pdfLafler, Kirk Paul (2013), “Hands-On SAS Macro Programming Tips and Techniques,” Proceedings of the 2013 SAS Global Forum(SGF) Conference, Software Intelligence Corporation, Spring Valley, CA, dings13/146-2013.pdfLafler, Kirk Paul (2013), PROC SQL: Beyond the Basics Using SAS, Second Edition, SAS Institute Inc., Cary, NC, USA.http://www.sas.com/store/prodBK 62432 en.htmlMalik, Shadan (2007), “Elements for an Enterprise Dashboard,” r-an-enterprise-dashboard.aspxNelson, Gregory S. (2009), “Building Your First Dashboard Using the SAS 9 Business Intelligence Platform: A Tutorial,”Proceedings of the 2009 SAS Global Forum (SGF) Conference, ThotWave Technologies, Cary, NC, dings09/028-2009.pdfOverton, Stephen (2012), “Lost in Wonderland? Methodology for a Guided Drill-Through Analysis Out of the Rabbit Hole,”Proceedings of the 2012 SAS Global Forum (SGF) Conference, Zencos Consulting, Cary, NC, dings12/020-2012.pdfSams, Scott (2013), “SAS BI Dashboard: Interactive, Data-Driven Dashboard Applications Made Easy,” Proceedings of the 2013SAS Global Forum (SGF) Conference, SAS Institute Inc, Cary, NC, dings13/061-2013.pdfZdeb, Mike (2004), “Pop-Ups, Drill-Downs, and Animation”, Proceedings of the 2004 SAS Users Group International (SUGI)Conference, University at Albany School of Public Health, Rensselaer, NY, pdfAcknowledgmentsThe author would like to thank the SGF 2015 Hands-on Workshop Section Chair, for accepting my abstract and paper; TylerSmith, SGF 2015 Conference Chair; and the SGF 2015 Conference and Executive Committees for organizing a great conference!Trademarks CitationsSAS and all other SAS Institute Inc. product or service names are registered trademarks or trademarks of SAS Institute Inc. in theUSA and other countries. indicates USA registration. Other brand and product names are trademarks of their respectivecompanies.Author InformationKirk Paul Lafler is consultant and founder of Software Intelligence Corporation and has been using SAS since 1979. He is a SASCertified Professional, provider of IT consulting services, trainer to SAS users around the world, mentor, and sasCommunity.orgemeritus Advisory Board member. As the author of six books including Google Search Complete (Odyssey Press. 2014); PROCSQL: Beyond the Basics Using SAS, Second Edition (SAS Press. 2013); PROC SQL: Beyond the Basics Using SAS (SAS Press. 2004);Kirk has written more than five hundred papers and articles, been an Invited speaker and trainer at four hundred-plus SASInternational, regional, special-interest, local, and in-house user group conferences and meetings, and is the recipient of 23“Best” contributed paper, hands-on workshop (HOW), and poster awards.Comments and suggestions can be sent to:Kirk Paul LaflerSenior SAS Consultant, Application Developer, Data Scientist, Trainer and AuthorSoftware Intelligence CorporationE-mail: KirkLafler@cs.comLinkedIn: http://www.linkedin.com/in/KirkPaulLaflerTwitter: @sasNerd
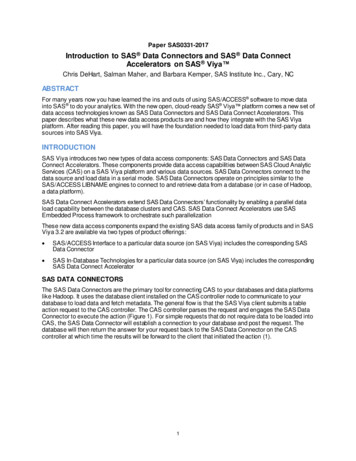
Dashboard Examples1. PROC PRINT Dashboard using PROC FORMATBase-SAS ********************************************;***** Program Name: Drill-down PROC FORMAT with PROC PRINT.SAS*****;***** Purpose.: Create and display a simple drill-down user interface using*****;*****PROC FORMAT and PROC PRINT with the ODS HTML destination.*****;**********;***** Author.: Kirk Paul Lafler, Software Intelligence Corporation*****;***** Date Written: 01/25/2015*****;***** SAS Version.: SAS 9.2, 9.3, 9.4*****;***** Input Files.: Workshop Data*****;***** Output Files: None*****;***** Subroutines.: None*****;***** User-defined Formats: RATFMT.*****;***** Macro Variables: None*****;***** Includes.: None*****;***** Modification History:*****;***** 02/12/2015 KPL Added Header *******;LIBNAME mydata 'e:\workshops\workshop data' ;*STEP 1 - Create BY-Group by Sorting Movies Dataset ;PROC SORT DATA mydata.moviesOUT work.sorted movies ;BY rating category ;RUN ***********************//* Step 2 - Create User-defined Rating Format with PROC ******************************/PROC FORMAT ;VALUE RATFMT'G' ' a href Drill-down-G-Movies.htm G-rated Movies /a ''PG' ' a href Drill-down-PG-Movies.htm PG-rated Movies /a ''PG-13' ' a href Drill-down-PG-13-Movies.htm PG-13-rated Movies /a ''PG-17' ' a href Drill-down-PG-17-Movies.htm PG-17-rated Movies /a ''R' ' a href Drill-down-R-Movies.htm R-rated Movies /a ' ;RUN ;
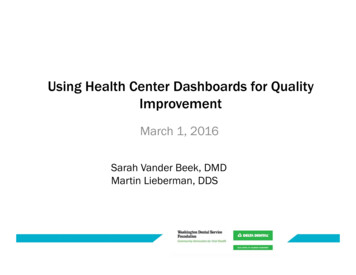
*Step 3 - Create Drill-down HTML File, Titles and Footnote ;ODS html file "e:\Drill-down-PROC-FORMAT.htm"(title "Drill-down User-defined Format in PROC PRINT") ;TITLE1 h .2in color blue"HTML Drill-down User-defined Format in PROC PRINT" ;TITLE2 color blue "by RATING" ;FOOTNOTE COLOR blue "(Click the underlined text to drill down.)" ;*Create the PROC PRINT Output with User-defined Format ;OPTIONS NODATE ;PROC PRINT DATA work.sorted movies LABEL NOOBS ;VAR rating ;FORMAT rating RATFMT. ;RUN ;ODS html close ;*Step 4 - Create Drill-down Output for Each Rating Group with PROC PRINT ;TITLE ;FOOTNOTE ;ODS html body "e:\Drill-down-G-Movies.htm" ;PROC PRINT DATA mydata.movies NOOBS N ;TITLE "G-rated Movies" ;WHERE UPCASE(rating) "G" ;RUN ;ODS html close ;. . . . . . . . .ODS html body "e:\Drill-down-R-Movies.htm" ;PROC PRINT DATA mydata.movies NOOBS N ;TITLE “R-rated Movies" ;WHERE UPCASE(rating) “R" ;RUN ;ODS html close ;2. Bar Chart DashboardBase-SAS Code:
Base-SAS *******************************************;***** Program Name: Drill-down with PROC SGRENDER and BarChart.SAS*****;***** Purpose.: Create and display a simple drill-down dashboard interface*****;*****using a DATA step, PROC TEMPLATE, PROC SGRENDER with the*****;*****ODS HTML destination.*****;***** Author.: Kirk Paul Lafler, Software Intelligence Corporation*****;***** Date Written: 02/19/2015*****;***** SAS Version.: SAS 9.2, 9.3, 9.4*****;***** Input Files.: Movies Workshop Data*****;***** Output Files: HTML Output (6 Movies.htm*****;***** Subroutines.: None*****;***** User-defined Formats: None*****;***** Macro Variables: None*****;***** Includes.: None*****;***** Modification History:*****;***** 02/21/2015 KPL Added Header ******;libname mydata 'e:\workshops\workshop data';*STEP 1 - Order Movies Dataset in Ascending Order by Rating ;proc sort data mydata.movies out work.sorted movies ;by rating ;run ;*STEP 2 - Assign HTML Link todata Classic Movies;length URLLINK 50;max 200;set work.sorted movies;if upcase(rating) 'G'elseif upcase(rating) 'PG'elseif upcase(rating) 'PG-13'elseif upcase(rating) 'PG-17'elseif upcase(rating) 'R'run;URLLINK Variable ;then URLLINK 'e:\SGRender-BarChart-G-Movies.htm';then URLLINK 'e:\SGRender-BarChart-PG-Movies.htm';then URLLINK 'e:\SGRender-BarChart-PG13-Movies.htm';then URLLINK 'e:\SGRender-BarChart-PG17-Movies.htm';then URLLINK 'e:\SGRender-BarChart-R-Movies.htm';*STEP 3 - Create BarChart Template Overlay with PROC TEMPLATE ;proc template ;define statgraph BarChartDashboard ;begingraph ;entrytitle "Drill-down BarChart Dashboard" ;layout overlay / xaxisopts (display (label tickvalues line)) ;barchart x Rating y length / url urllinkdataskin crispdatatransparency 0.3orient vertical ;endlayout ;endgraph ;end ;run ;*Step 4 - Produce Graphical Output from BarChart Template using PROC SGRENDER;ods html file 'SGRender-BarChart-Dashboard.htm' path 'e:\' ;ods graphics / reset imagemap on width 7in height 5inimagename 'SGRender-BarChart-Dashboard' ;title1 "BarChart of Movies Data" ;title2 "Rating by Movie Length" ;proc sgrender data Classic Movies template BarChartDashboard ;run ;title ;ods html close ;
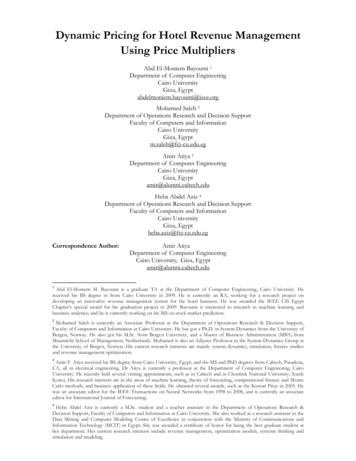
*STEP 5 - Create Drill-down Output for Each Rating Group with PROC PRINT ;ODS html body "SGRender-BarChart-G-Movies.htm" path 'e:\';PROC PRINT DATA classic movies(DROP urllink max) NOOBS N ;TITLE "G-rated Movies" ;WHERE UPCASE(rating) "G" ;RUN ;ODS html close ;. . . . . . . . .ODS html body "SGRender-BarChart-R-Movies.htm" path 'e:\';PROC PRINT DATA classic movies(DROP urllink max) NOOBS N ;TITLE "R-rated Movies" ;WHERE UPCASE(rating) "R" ;RUN ;ODS html close ;3. Pie / Bar Chart DashboardBase-SAS *******************************************;***** Program Name: 2-Cell Drill-down, PROC SGRENDER, Pie and Bar Chart #2.SAS*****;***** Purpose.: Create and display a simple drill-down dashboard with two*****;*****categorical variables using a DATA step, PROC TEMPLATE, Pie,*****;*****Bar Chart, and PROC SGRENDER with the ODS HTML destination.*****;**********;***** Author.: Kirk Paul Lafler, Software Intelligence Corporation*****;***** Date Written: 03/28/2015*****;***** SAS Version.: SAS 9.2, 9.3, 9.4*****;***** Input Files.: Workshop Data*****;*****Movies*****;***** Output Files: HTML Output (17 Files)*****;*****PieChart-BarChart-Dashboard.htm (Qty 1)*****;*****PieChart-Rating-Movies.htm (Qty 5)*****;*****BarChart-Category-Movies.htm (Qty 11)*****;***** Subroutines.: None*****;***** User-defined Formats: None*****;***** Macro Variables: None*****;***** Includes.: None*****;***** Modification History:*****;***** 03/28/2015 K
Steps to Creating a Dynamic Dashboard using Base-SAS Follow these basic steps to successfully construct a dynamic dashboard using the Base-SAS software. 1. Connect to desired data sources using Libname statement. 2. Create user-defined form