Transcription
Vrije Universiteit BrusselTwo-level clustering methodology for smart metering dataArco, Leticia; Casas Cardoso, Gladys María; Nowe, AnnPublished in:Cuadernos de ublication date:2020License:CC BYDocument Version:Final published versionLink to publicationCitation for published version (APA):Arco, L., Casas Cardoso, G. M., & Nowe, A. (2020). Two-level clustering methodology for smart metering data.Cuadernos de Administración, 33. ral rightsCopyright and moral rights for the publications made accessible in the public portal are retained by the authors and/or other copyright ownersand it is a condition of accessing publications that users recognise and abide by the legal requirements associated with these rights. Users may download and print one copy of any publication from the public portal for the purpose of private study or research. You may not further distribute the material or use it for any profit-making activity or commercial gain You may freely distribute the URL identifying the publication in the public portalTake down policyIf you believe that this document breaches copyright please contact us providing details, and we will remove access to the work immediatelyand investigate your claim.Download date: 22. Jun. 2021
ArticlesTwo-level clustering methodology for smart metering data*Metodología de agrupación en dos niveles para una medición de datos inteligenteMetodologia de agrupação em dois níveis para uma medição de dados inteligenteLeticia Arco García aVrije Universiteit Brussels, Países bajoslarcogar@vub.beORCID: http://orcid.org/0000-0002-5154-4441Gladys María Casas CardosoCENSA International College, Estados UnidosDOI: https://doi.org/10.11144.Javeriana.cao33.tlcmsDate received: 26/08/2019Date accepted: 20/10/2019Date published: 20/05/2020Ann NowéVrije Universiteit Brussels, Países bajosORCID: y efficiency and sustainability are important factors to address in the context of smart cities. In this sense, a necessaryfunctionality is to reveal various preferences, behaviors, and characteristics of individual consumers, considering the energyconsumption information from smart meters. In this paper, we introduce a general methodology and a speci c two-levelclustering approach that can be used to group, considering global and local features, energy consumptions and productions ofhouseholds. us, characteristic load and production pro les can be determined for each consumer and prosumer, respectively. e obtained results will be generally applicable and will be useful in a general business analytics context.JEL Codes: D19, Q41.Keywords: clustering, time series, smart metering.Resumen:La e ciencia energética y la sostenibilidad son factores importantes a abordar en el contexto de las ciudadesinteligentes. En este sentido, una funcionalidad necesaria consiste en revelar varias preferencias, comportamientos ycaracterísticas de los consumidores individuales, considerando la información de consumo de energía de los metrocontadores inteligentes. En este artículo presentamos una metodología general y un enfoque de agrupamiento en dosniveles teniendo en cuenta las características globales y locales del consumo de energía y la producción de loshogares. Por lo tanto, se pueden determinar los per les característicos de carga y producción para cada consumidory prosumidor, respectivamente. Los resultados obtenidos serán de aplicación general y serán útiles en un contexto de análisisempresarial general.Códigos JEL: D19, Q41.Palabras clave: agrupamiento, series de tiempo, medición inteligente.Resumo:A e ciência energética e a sustentabilidade são fatores importantes de abordar no contexto das cidades inteligentes. Nestesentido, uma função necessária seria revelar várias preferências, comportamentos e características dos consumidores individuais,considerando a informação de consumo de energia dos medidores de dados inteligentes. Este artigo apresenta uma metodologiageral e um enfoque de agrupação em dois níveis, tendo em conta as características globais e locais do consumo de energia e aprodução dos lares. Por tanto, é possível determinar os per s característicos de carga e produção para cada consumidor eprosumidor, respetivamente. Os resultados obtidos serão de aplicação geral, especialmente, em um contexto de análiseempresarial.Códigos JEL: D19, Q41.Palavras-chave: agrupação, séries de tempo, medição inteligente.Author notesa Corresponding author. E-mail: larcogar@vub.be
Cuadernos de Administración, 2020, vol. 33, ISSN: 0120-3592 / 1900-7205IntroductionOn the way towards a low-carbon future, electricity networks are considered as enablers and one of thecritical areas to be studied under the Strategic Energy Technologies Plan. e rst European ElectricityGrid Initiative –EEGI– Roadmap 2010-2018 was approved by the European Commission and the MemberStates alongside the creation of EEGI in June 2010. e EEGI Roadmap de nes the research, developmentand demonstration challenges that both European transmission and distribution system operators shouldaddress in the next years with the aim to face the requirements linked to the evolution of power systems andto respond to different external factors. For this reason, smart-grid projects are receiving a lot of attention(Hübner & Prüggler, 2011; Giordano et al., 2011; Losa, De Nigris & Van, 2013). New perspectives emerge forenergy management. Many smart meters and sensors are being deployed and they result in a new data delugewe will have to face. With the rollout of smart metering infrastructure at scale, demand-response programsmay now be tailored based on users’ consumption and production patterns as mined from sensed data.Energy efficiency and sustainability are important factors to address in the context of smart cities. In thissense, a necessary functionality is to reveal various preferences, behaviors, and characteristics of individualconsumers and prosumers, considering the ne-grained energy consumption and production informationfrom smart meters, respectively. Smart metering and nonintrusive load monitoring play a crucial role in ghting energy the s and for optimizing the energy consumption of the home, building, city, and so forth(Fenza, Gallo & Loia, 2019; Ahmad et al., 2018). Besides, it is very important to reduce the mismatchbetween the actual and expected energy demand, which is o en due to an anomalous operation of theequipment and control systems. In this context, the characterization of energy consumption patterns overtime is of fundamental importance (Capozzoli et al., 2018).To the best of our knowledge, all approaches are still in a research phase, especially when it comes toclustering methods consumption and production data to provide clusters for each consumer and prosumerpro le (Hossain et al., 2011; Binh et al., 2010; Figueiredo et al., 2005; Mutanen et al., 2011; Lee, Haben, &Grindrod, 2014; Ardakanian et al., 2014; Lavin & Klabjan, 2014).While some authors have been working on grouping consumers considering the similarity among timeseries models, such as ARMA and ARIMA (Brockwell & Davis, 2002); others have been focusing ongrouping consumers considering the time series as feature vectors (Flath et al., 2012; Cao, Beckel, & Staake,2013). Most of the proposals model the data following only a local point of view, others only global,and others considering the original time series, which limits the analysis. e most successful approacheshave been those that combine various clustering methods (Figueiredo et al., 2005; Albert & Rajagopal,2013; Räsänen et al., 2010; Räsänen & Kolehmainen, 2009). It is even possible to nd some proposalsthat combine clustering with other machine learning techniques, such as association rules (Funde et al.,2019). Nevertheless, those hybrid approaches only exploit the combination of clustering methods in orderto mitigate the disadvantages of ones and enhance the bene ts of others. However, they do not exploit otherimportant reasons for developing hybrid time series clustering models.Due to the limitations expressed above, in this paper, we introduce a general methodology that combinesclustering methods in two stages and exploits in a hybrid way local and global patterns of the series underanalysis. Our proposal can be used to group energy consumers and prosumers according to the similarity oftheir daily and yearly consumption and production, respectively. us, characteristic load and productionpro les per time period can be determined, as we will explain later. e obtained results are generallyapplicable and will be useful in a general business analytics context.
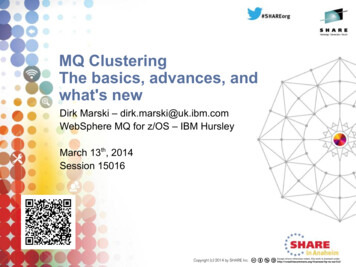
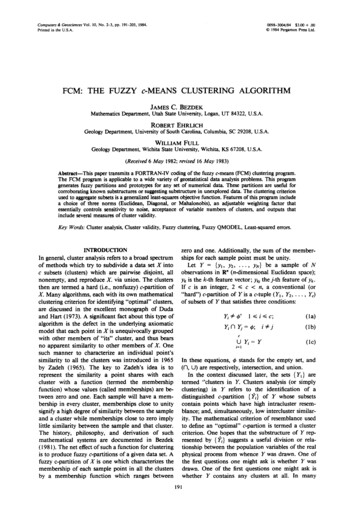
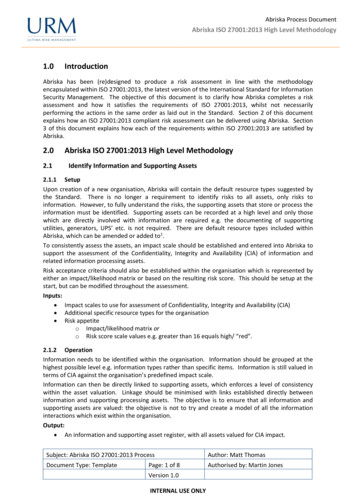
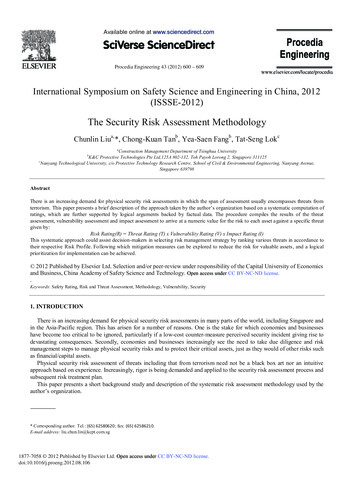
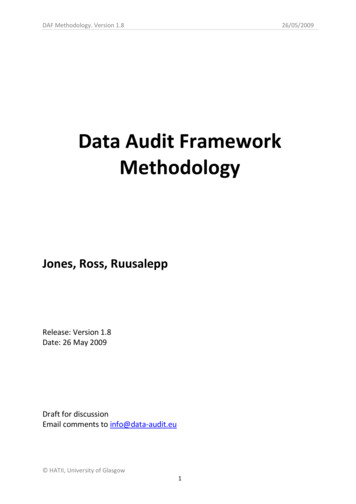
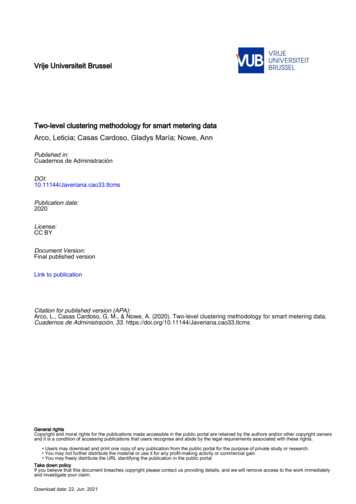
Leticia Arco García, et al. Two-level clustering methodology for smart metering dataCluster analysis of smart meter dataSmart meter data are time series; which makes the analysis quite complex. For that reason, cluster analysis ofconsumption data has been explored in some papers (Hossain et al., 2011; Binh et al., 2010; Figueiredo et al.,2005; Mutanen et al., 2011; Lee et al., 2014; Ardakanian et al., 2014; Lavin & Klabjan, 2014), not so muchthe clustering of production data. From now on we will refer to consumption data clustering approaches;however, all proposals are applicable to production data clustering as well. Most authors have been focused ongrouping consumers considering the time series as feature vectors. In literature four approaches are proposedto cope with the feature vector de nition:1.2.3.4.Consider features as interval consumption measurements (e.g., every 15 minutes) (Flath et al.,2012; Cao et al., 2013).Only use global features (e.g., mean and standard deviation of an overall day) for characterizingeach consumer (Lavin & Klabjan, 2014; Räsänen & Kolehmainen, 2009).Extend the time series data by additional global features or other external measures (Ardakanianet al., 2014).Create local patterns for characterizing the time series (Lee et al., 2014; Dent et al., 2011). e rst one follows a raw-data-based approach, the last two follow a feature-based approach and the thirdone considers an extension of the raw data including other features. e de nition of a distance measure between time series is necessary for the four approaches (Iglesias &Kastner, 2013), and it depends on the clustering objective, which can be similarity in time, similarity in shapeor similarity in change (Zhang et al., 2011): e similarity in time is to cluster together series that vary in a similar way on each time level, asshown in Figure 1 . Usually, the clustering of time series data based on similarity in time requires thecalculation of the exact distances among all the time series data in a dataset. e similarity in shape is to cluster series with common shape features together, as shown in Figure 2. is may constitute identifying common trends occurring at different times or similar sub-patternsin the data. e similarity in change is to cluster series by the similarity in how they vary from time level to timelevel, as shown in Figure 3.FIGURE 1Time series based on similarity in timeSource: Zhang et al. (2011).
Cuadernos de Administración, 2020, vol. 33, ISSN: 0120-3592 / 1900-7205FIGURE 2Time series based on similarity in shapeSource: Zhang et al. (2011).FIGURE 3Time series based on similarity in changeSource: Zhang et al. (2011).In this research, we are interested in time series clustering where the main clustering objective is thesimilarity in time because we need to cluster together series that vary in a similar way at each time interval.For this reason, in the rst approach, it is necessary to de ne a distance measure based on the speci ccharacteristics of time series data. Secondly, the arithmetic means of the single time segments are the startingpoint for the formation of global consumer behavior, but global features only do not properly represent thecustomers’ behavior. us, the second approach is not enough to segment the customers, and make groupsof households with similar consumption patterns and determine on the y the cluster membership of a givenload curve. In the third approach, the dimensionality of the time series is increased and it could be difficult tomanage different kinds of features, global and local in the same clustering process. Finally, the last approachcould be useful for detecting clusters with similar load pro les, but it could be depending on the homogeneityof the data from the global feature point of view.As we pointed out, the above approaches have some advantages and disadvantages. us, some authorsprefer to develop hybrid approaches for time series clustering in other to solve the above disadvantages(Zhang et al., 2011; Lai et al., 2010; Aghabozorgi et al., 2014; Warren, 2007; Oates, Firoiu & Cohen, 1999;Aghabozorgi, Saybani & Wah, 2012). ere are several reasons for developing hybrid time series clusteringmodels (Lai et al., 2010). For instance, we might obtain very different clustering results for the same time seriesdataset when different time granules are considered. For time series clustering, dimensionality reduction
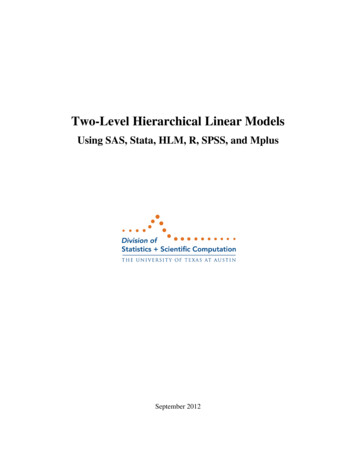
Leticia Arco García, et al. Two-level clustering methodology for smart metering datamethods are o en applied to reduce the data dimension before clustering. Consequently, the information ofsubsequence may be overlooked. erefore this might result in different clustering results a er consideringthe subsequence information. Some conventional clustering methods require prior information and domainknowledge; others do not require prior information but are too computationally expensive to be appliedon very large data sets. e combination of clustering methods can mitigate the disadvantages of some andenhance the bene ts of others. For some applications, the clustering objective might not be that apparent. e selection of the time series representation and the similarity measure depends on the clustering objective. us, different clustering approaches are required.Some hybrid clustering methods are proposed in the area of clustering analysis of smart metering data(Figueiredo et al., 2005; Albert & Rajagopal, 2013; Räsänen et al., 2010; Räsänen & Kolehmainen,2009). Most of them apply Self-Organizing Maps –SOM– (Kohonen, 1982) in the rst level and k-means(MacQueen, 1967) or hierarchical clustering algorithms (Räsänen et al., 2010) in the second level. SOM isused to obtain a reduction of the dimension of the initial dataset and k-means is used to group the weightvectors of the SOM’s units and the nal clusters are obtained (Figueiredo et al., 2015; Räsänen et al., 2010;Räsänen & Kolehmainen, 2009). Another approach applies k-means rst and uses spectral clustering tosegment a collection into classes of similar statistical properties (Albert & Rajagopal, 2013). ese hybridapproaches only exploit the combination of clustering methods in order to mitigate the disadvantages of onesand enhance the bene ts of others. However, they do not exploit other important reasons for developinghybrid time series clustering models.General ideas, stages, and schema of the proposed methodologyWe introduce a general methodology that can be used to group time series considering different time granules. e proposed methodology consists of the following stages, as shown in Figure 4.FIGURE 4General schema of the proposed methodologySource: Own elaboration.
Cuadernos de Administración, 2020, vol. 33, ISSN: 0120-3592 / 1900-7205Stage 1: Data gathering. Read time series; e.g., the time intervals of interest for data representation aretypical 1 min, 15 min or 1h in the context of smart metering applications (Chicco, 2012).Stage 2: Data stratifying. Segment the data, which separates the raw data sets into more homogeneoussubsets, in order to sustain scalability; e.g., data can be strati ed using a split between weekend andweekdays, or between summer and winter months when we are working with smart metering data (Flath etal., 2012; Cao et al., 2013).Stage 3: Data cleaning. Detect and remove errors and inconsistencies from data in order to improve thedata quality. In the smart metering domain some strategies can discard data sets showing more than onehour of recording gaps (Flath et al., 2012); check for inconsistencies in the data and remove outliers(Figueiredo et al., 2005); detect missing values and replace them using regression techniques (Figueiredo etal., 2005); remove special days (e.g., public holidays) (Cao et al., 2013); remove non-continuous data(McLoughlin, Duffy & Conlon, 2012).Stage 4: Different time granule clustering. Select the time granule before clustering. Depending on thegranularity level desired in the clustering, it is de ned all the elements that contribute to the clustering. isstage can be repeated several times depending on how much you want to refine the level of granularity inthe data analysis. This is the most important stage of our methodology. For that reason, we will explain indetail its main steps:4.1 Time granule selection4.2 Data representation4.3 Data preprocessing4.4 Distance/similarity selection4.5 Clustering algorithm selectionStage 5: Post-clustering. Apply clustering validation techniques, visualize the clustering results and obtainlabels and prototypes for each cluster. For example, a useful post-clustering result in the smart meteringapplications can be the calculation of the global power and energy information for the customer classes fortariff setting purposes (Chicco, 2012). e selection of the level of granularity is closely associated with the objective of the desired clustering, asshown in Figure 5. In this step, it is necessary to decide if the objective is the similarity in shape, in changeor in time. e selection of the time series representation (raw-data-based, feature-based or model-basedrepresentation) also depends on the clustering objective. For example, if the objective is the similarity in timethen we suggest using raw-data-based representation. On the other hand, if the objective is the similarityin change, we suggest using a model-based representation. We can change the representation in differentclustering levels.
Leticia Arco García, et al. Two-level clustering methodology for smart metering dataFIGURE 5Stage 4 schemaSource: Own elaboration. en, preprocessing is in charge of applying dimensionality reduction and normalization methods incorrespondence with the clustering objective and the selected representation. Finally, it is necessary to de nethe appropriate distance measure and apply a clustering algorithm for obtaining clusters where all the seriesgrouped in the same cluster should be coherent or homogeneous. It is important to take into accountwhich is our clustering objective for deciding which distance measure we will apply. For example, if theclustering objective is the similarity in shape, then it will be useful to apply Dynamic Time Warping –DTW–distance. e most used algorithms are k-means (Lavin & Klabjan, 2014; Flath et al., 2012; Räsänen &Kolehmainen, 2009), Self-Organizing Maps –SOM– (Figueiredo et al., 2005; McLoughlin et al., 2012),hierarchical approaches (Cao et al., 2013) and Expectation Maximization (Albert & Rajagopal, 2013); aswell as hybrid approaches (Figueiredo et al., 2005; Albert & Rajagopal, 2013; Räsänen et al., 2010; Räsänen& Kolehmainen, 2009).Stage 4 offers the possibility to design procedures for different clustering objectives using diverse granulesin the time series representation. Taking into account the smart metering domain, it could be useful in the rst clustering level to group consumption or production data considering their voltage level combined withgeneral global features; thus, a normalization process, in the second level, could be carried out inclusive asimilarity in time objective clustering. In the case of high dimensional series, it could be useful to apply a
Cuadernos de Administración, 2020, vol. 33
Cuadernos de Administración, 2020, vol. 33, ISSN: 0120-3592 / 1900-7205 FIGURE 2 Time series