Transcription
Hindawi Publishing CorporationJournal of EcosystemsVolume 2013, Article ID 532424, 16 pageshttp://dx.doi.org/10.1155/2013/532424Research ArticleComparison of Two PARAFAC Models of DissolvedOrganic Matter Fluorescence for a Mid-Atlantic ForestedWatershed in the USAShatrughan Singh,1 Shreeram Inamdar,2 and Durelle Scott31Department of Geological Sciences, University of Delaware, Newark, DE 19716, USADepartment of Plant and Soil Sciences, University of Delaware, Newark, DE 19716, USA3Biological Systems Engineering, Virginia Tech, Blacksburg, VA 24061, USA2Correspondence should be addressed to Shatrughan Singh; ssingh.udel@gmail.comReceived 14 January 2013; Revised 2 June 2013; Accepted 17 June 2013Academic Editor: Fu-Liu XuCopyright 2013 Shatrughan Singh et al. This is an open access article distributed under the Creative Commons AttributionLicense, which permits unrestricted use, distribution, and reproduction in any medium, provided the original work is properlycited.The composition of dissolved organic matter (DOM) in a mid-Atlantic forested watershed was evaluated using two fluorescencemodels—one based on previously validated model (Cory and McKnight, 2005) and the other developed specifically for ourstudy site. DOM samples for the models were collected from multiple watershed sources over a two-year period. The previouslyvalidated parallel factor analysis (PARAFAC) model had 13 DOM components whereas our site-specific model yielded six distinctcomponents including two terrestrial humic-like, two microbial-derived humic-like, and two protein-like components. The humiclike components were highest in surficial watershed sources and decreased from soil water to groundwater whereas the protein-likecomponents were highest for groundwater sources. Discriminant analyses indicated that our site-specific model was more sensitiveto subtle differences in DOM and the sum of the humic- and protein-like constituents yielded more pronounced differences amongwatershed sources as opposed to the prevalidated model. Dissolved organic carbon (DOC) and dissolved organic nitrogen (DON)concentrations and selected DOM metrics were also more strongly correlated with the site-specific model components. These resultssuggest that while the pre-validated model may capture broader trends in DOM composition and allow comparisons with otherstudy sites, a site-specific model will be more sensitive for characterizing within-site differences in DOM.1. IntroductionDissolved organic matter (typically 0.45 𝜇m) is a heterogeneous mixture of aromatic and aliphatic organic compounds,ranging from proteins, carbohydrates, polysaccharides, andlipids to humic and fulvic acids [1]. In terrestrial and aquaticecosystems, DOM does not only influence the geochemicaland photochemical reactions by participating in carbon (C)and nutrient (N, P, and S) cycles, but also control microbiallymediated reactions by serving as potential substrate. It alsoplays a key role in transport and transformation of majorcontaminants and/or pollutants and their reactivity withthe environment [2, 3]. Additionally, DOM exerts a strongcontrol in the formation of disinfection byproducts (DBPs),for example, trihalomethanes (THMs) and haloacetic acids(HAAs), during the drinking water supply treatments withdisinfectants [4]. The amount and quality of DOM in terrestrial and aquatic environments influence biological processessuch as microbial degradation [5, 6]. It is also a key player inaltering the depth of the photic zone in aquatic ecosystems bycontrolling the incident UV radiation [7]. Thus, DOM playsan ecologically important role in various biochemical andphysical processes linking terrestrial and aquatic ecosystems.In the last two decades, the availability of optical measurement techniques such as ultraviolet (UV) absorption [8, 9]and fluorescence spectroscopy [10, 11] has provided importantinsights into the character and composition of DOM. Someof the optical indices that have been implemented to characterize DOM quality include specific ultraviolet absorbance(SUVA; [9]), absorption coefficient [12, 13], spectral slope
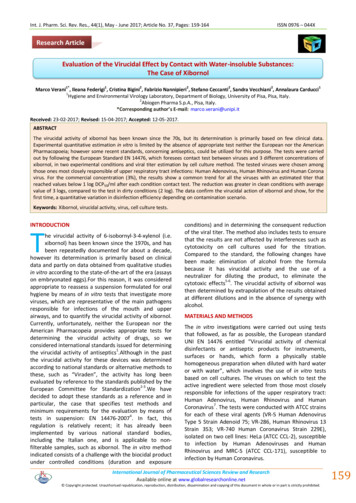
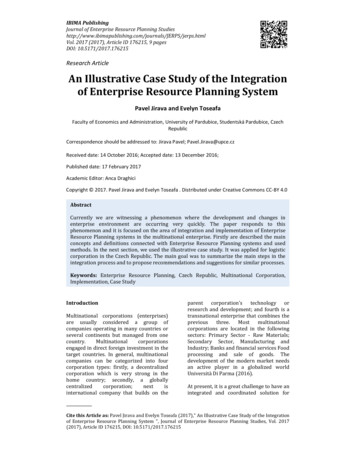
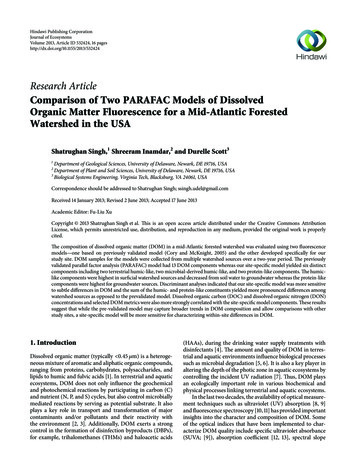
2ratio (S𝑅 ; [14, 15]), humification index (HIX; [16]), fluorescence index (FI; [17]), and %protein-like fluorescence [18]derived from absorption measurements and fluorescencebased excitation emission matrices (EEMs, [11, 17]). WhileUV absorption and fluorescence spectroscopy have providedimportant insights into DOM composition, these analysesalso yield large amounts of data with high dimensionalityand nonlinearity. To process this data and gain meaningfulinsights, a variety of multivariate statistical tools have beenemployed [19]. Boehme et al. (2004) examined the DOMfluorescence variability using EEMs coupled with principalcomponent analysis (PCA) [20]. Likewise, parallel factoranalysis in conjunction with fluorescence EEMs has beenused to identify biogeochemically meaningful componentsof DOM [19]. One fluorescent model adapted by the waterscience community is the Cory and McKnight model [17],which was developed using DOM from a wide range ofaquatic environments.Although the benefits of PARAFAC models to extractbiogeochemical information from EEMs are indisputable,there is some uncertainty on whether a new, site-specificPARAFAC model should be developed or whether a previously validated model [17] is adequate to characterize thevariability of DOM at a given site. Fellman et al. (2009)recently addressed this issue for a study site in Alaska wherethey compared a new, site-specific PARAFAC model againstthe Cory and McKnight (2005) model (hereafter referred asCM model) for EEMs derived from soil and stream waters[17, 21]. While they did not find any significant differencesbetween the two PARAFAC models, they did observe thatthe site-specific model was more sensitive to particular DOMconstituents. They found that the Cory and McKnight model[17] was unable to characterize a humic-like component thatwas specific to soil waters and that the site-specific model dida better job in characterizing the variability of the proteinlike region of DOM. Similarly, Larsen et al. (2010) reporteda limited resolving power of the Cory and McKnight (2005)model in characterizing protein-like and phenolic DOMfractions [17, 22].We recently characterized the composition of DOMfor multiple watershed sources using UV absorption andfluorescence techniques in a 12 ha forested watershed locatedin the Piedmont region of Maryland [23, 24]. WatershedDOM sources that were studied included throughfall, litterleachate, soil pore water, wetland soil water, hyporheic water,stream runoff, groundwater seeps, and riparian, shallow,and deep groundwater. EEMs for DOM samples from thesewatershed sources were fitted to the previously validatedCory and McKnight [17] PARAFAC model. In addition,multiple spectrofluorometric indices were also determinedfor the DOM samples which included absorption coefficientat 254 nm (a254 ), SUVA at 254 nm (SUVA254 ), HIX, FI, and SR .These indices revealed distinct patterns in DOM compositionacross watershed sources [23]. The surficial watershed sourceswere rich in humic and aromatic DOM constituents whileDOM in groundwater or along deeper flow paths was low inhumic-like and high in protein-like DOM [23].Using the same 714 EEMs collected from our field site,we developed a new, site-specific Fair Hill PARAFAC modelJournal of Ecosystems(hereafter referred to as the FH model). Our overall objectivehere was to investigate how this new site-specific FH modelcompared with the CM model in characterizing the DOMcomposition at our site. Specific questions that we addressedwere (a) How does the new site-specific FH model characterize the DOM composition? Is the site-specific FH model moresensitive than the CM model for characterizing DOM anddoes it allow for a greater differentiation among watershedsources? If yes, which model components and watershedsources reveal the largest differences between the FH and CMmodels? The unique aspect of this study is the availabilityof strong dataset on multiple and distinct watershed DOMsources to assess the differences between the two PARAFACmodels.2. Site Description and Methods2.1. Site Description. A detailed description of the study siteand sampling procedures has been previously reported [23,24]. Briefly, the study watershed (12 ha) is located withinthe Fair Hill Natural Resources Management Area (NRMA)(39 42 N, 75 50 W) in Cecil County, MD (Figure 1), and ispart of the Big Elk Creek drainage basin which lies withinthe Piedmont physiographic region. Big Elk Creek eventuallydrains into the Chesapeake Bay.Cecil County has a humid, continental climate with welldefined seasons and mean annual rainfall of 1221 mm [25].The study watershed predominantly is forest cover withdeciduous canopy dominated by Fagus grandifolia (Americanbeech), Liriodendron tulipifera (yellow poplar), and Acerrubrum (red maple) species [26]. The study watershed isprimarily underlain by Wissahickon formation comprised ofmetamorphosed crystalline, sedimentary, and igneous rocksincluding mica-rich schist, amphibolites, and gneiss. Thesoils are coarse loamy, mixed, mesic Lithic Dystrudepts,Oxyaquic Dystrudepts, with subhorizons indicating seasonalwater saturation.2.2. Watershed Sampling. Watershed sampling was performed at baseflow (1–3 times a month) as well as duringstorm events. Manual grab sampling during baseflow overa two-year period (2008-09) was conducted for multiplewatershed locations which included stream (ST), seeps (P),hyporheic zone (HY), wetland soil water (WSW), shallow(SGW), and deep (DGW) groundwater, soil pore water(U), and riparian groundwater (RGW). Storm samples werecollected using automated ISCO sampler (Teledyne Isco Inc.,Lincoln, NE, USA) during the events for stream water (atthe 12 ha watershed outlet), forest floor (or litter leachate,LT), throughfall (TF), and rainfall (R) (Figure 1). All watersamples were filtered through a 0.45 micron nitrocellulosemembrane filter (Millipore Corp., Billerica, MA, USA) within24 hours of collection and stored at 4 C for further analyses.Dissolved organic carbon analysis for the water sampleswas conducted at the biogeochemistry laboratory of SUNYESF, NY, using the Tekmar-Dohrmann Phoenix 8000 TOCanalyzer. Nitrate-N was determined using a Dionex IC, NH4 with an autoanalyzer using the Berthelot Reaction followedby colorimetric analysis, and total dissolved nitrogen (TDN)
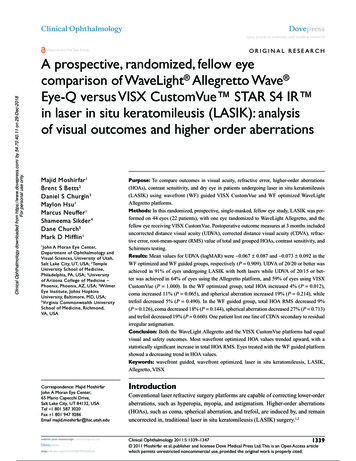
Journal of Ecosystems3PAMDRDE9590P1ST4HY1 P2105ST585TF2SW1LY1WW1 U1/U2ST1LT1 TF1LY380ST6SW5ST2 WW3 SW3LT2SW6U3/U4LY4ST3HY2 WW4SW7100(meters)0100 100200Throughfall (TF)Hyporheic water (HY)Litter leachate (LT)Groundwater seeps (seep)Tension soil water (U)Stream water (ST)Zero-tension wetlandsoil water (WSW)Riparian groundwater (RGW)Shallow groundwater (SGW)Valley-bottom wetlandsDeep groundwater (DGW)Figure 1: Location of the study site in the mid-Atlantic Piedmont region of northeastern Maryland (inset: location of catchment indicatedby filled circle) and sampling locations are marked within the 12 ha forested watershed.using the persulfate oxidation procedure [27] followed bycolorimetric analysis on an autoanalyzer. Dissolved organicnitrogen concentrations were computed as the differencebetween TDN and inorganic N (NO3 , NH4 ).2.3. UV-Vis and Fluorescence Spectroscopy. Absorption spectra (190–1100 nm) were obtained for each sample at roomtemperature at 1 nm intervals using a UVmini-1240 (Shimadzu Scientific Instruments, Columbia, MD, USA) singlebeam spectrophotometer equipped with a 1 cm path-lengthquartz cuvette (volume of 4 mL). The instrument was setup and corrected for scattering and baseline fluctuations afterrunning particle-free Nanopure Milli-Q (18.2 MΩ) water ondaily basis prior to running water samples.Water samples for fluorescence analysis were treatedin a similar manner as for absorption measurements. Toaccount for the inner filter effects (IFEs), samples reflectingabsorbance greater than 0.2 at 254 nm (A254 0.2) werediluted with particle-free Nanopure Milli-Q water (alsoused as a blank). Excitation-emission matrices (EEMs) were
4generated using a Horiba Jobin Yvon Fluoromax-3P (HoribaScientific, Edison, NJ, USA) spectrofluorometer equippedwith a 150 W ozone-free xenon arc lamp. The spectrofluorometer was set to collect the signal in ratio mode (S/Rmode) with dark offsets using a 5 nm bandpass on the excitation as well as emission monochromators. Factory-suppliedcorrection factors were applied to the scans to correct forinstrument configuration. The EEM spectra were recordedfor excitation spectra from 240 to 450 nm at every 10 nmintervals while the emission spectra ranged between 300 and550 nm, with data saved for every 2 nm over an integrationtime of 0.25 s. Absorption corrections were applied to accountfor inner filter effects in “Blank” and sample EEMs. Then,corrected Milli-Q water (Blank) EEMs were subtracted fromthe sample EEMs to eliminate any influence of Raman peaks.Subsequently, EEMs were normalized to daily determinedwater Raman integrated area under maximum fluorescenceintensity (350 ex/397 em, 5 nm bandpass) as suggested byLawaetz and Stedmon [28]. Using this approach, EEMs datawere normalized and reported in Raman Units (R.U.) whichin turn are quantitatively independent from any instrumentalparameters provided spectrally corrected data used. Finally,the EEMs were multiplied with dilution factor (if sampleswere diluted) to obtain the fluorescence intensity for theoriginal undiluted sample [5]. Consequently, the correctedEEMs were exported in MATLAB 7.12 (MathWorks Inc.,Natick, MA, USA) for premodel run steps.2.4. DOM Characterization Using FH and CM PARAFACModels. Following EEMs exported in MATLAB, a premodelstep involves a mean centering across the samples to reduceany offsets [29]. Then, each EEM scan was normalized to1.0 by dividing the whole EEM by the maximum recordedfluorescence intensity value for the sample to ensure
U1/U2 U3/U4 LY3 SW3 WW3 SW6 ST6 SW7 LY4 WW4 HY2 100 0 100 200 (meters) Zero-tension wetland soil water (WSW) Valley-bottom wetlands F : Location of the study site in the mid-Atlantic Piedmont region of northeastern Maryland (inset: location of catchment indicated by lled circle) and sampling locations are marked within the ha forested watershed. using the persulfate oxidation