Transcription
Exploring Online Video Watching BehaviorsFrank BentleyYahoo/Verizon MediaSunnyvale, CAfbentley@verizonmedia.comMax SilvermanYahoo/Verizon MediaSunnyvale, CAmaxsilverman@verizonmedia.comABSTRACTLaptop and desktop computers are frequently used to watchonline videos from a wide variety of services. From shortYouTube clips, to television programming, to full-lengthfilms, users are increasingly moving much of their videoviewing away from television sets towards computers. Butwhat are they watching, and when? We set out to understand current video use on computers through analyzing fullbrowsing histories from a diverse set of online Americans,finding some temporal differences in genres watched, yet fewdifferences in the length of videos watched by hour. We alsoexplore topics of videos, how users arrive at online videosthrough referral links, and conclude with several implications for the design of online video services that focus onthe types of content people are actually watching online.CCS CONCEPTS Information systems Multimedia streaming; Videosearch; Human-centered computing Empirical studies in HCI .KEYWORDSVideo; Streaming; Mid-Scale Studies; YouTube; NetflixACM Reference Format:Frank Bentley, Max Silverman, and Melissa Bica. 2019. ExploringOnline Video Watching Behaviors. In Proceedings of ACM International Conference on Interactive Experiences for TV and Online Video(TVX 2019), June 4–6, 2019, Manchester, UK. ACM, New York, NY,USA, 10 pages.1Melissa BicaUniversity of Colorado, BoulderBoulder, COmelissa.bica@colorado.eduor CBS), from websites of cable providers (such as ComcastXfinity or Verizon Fios), or from over the top (OTT) solutionsthat go around networks and carriers (such as Netflix andHulu). In addition, vast video content libraries are availableto stream from online video sites such as YouTube or Vimeo.This gives users a great deal of content choice, comparedto watching traditional linear television, yet little work hasexplored how users engage with all of these different siteson their computers.Existing work has identified laptop and desktop computers as devices frequently used for video streaming [10] andrewatching [2]. Mann et al. [10] found that overall the computer is the second most preferred device (after the televisionset) for watching video content, with 38% preferring it overall other devices to watch TV and movies, 23% preferring itfor watching sports events, and the majority (54%) preferring it to watch short video clips, such as YouTube. Usersfrequently watch content on computers from their beds orwhile another person in the home is watching something onthe main television set [12].However the existing literature mainly focuses on specificstreaming sites, studying Netflix use or YouTube watching,and does not explore how users engage with the wide varietyof video streaming sites that are available at once, includingtemporal differences in use or how multiple sites are usedtogether or separately within a session. Despite the common nature of this activity, there is much we do not knowabout user behavior with online video on desktop and laptopcomputers.We began this work with several research questions:INTRODUCTIONThere are currently many ways that users can stream videocontent to their computers. Professional television content isavailable on websites from individual networks (such as HBOPermission to make digital or hard copies of all or part of this work forpersonal or classroom use is granted without fee provided that copies are notmade or distributed for profit or commercial advantage and that copies bearthis notice and the full citation on the first page. Copyrights for componentsof this work owned by others than ACM must be honored. Abstracting withcredit is permitted. To copy otherwise, or republish, to post on servers or toredistribute to lists, requires prior specific permission and/or a fee. Requestpermissions from permissions@acm.org.TVX 2019, June 4–6, 2019, Manchester, UK 2019 Association for Computing Machinery.(1) How many different video services are users engagingwith on their computers? Do people stick mostly toone service, or do they subscribe to a many differentones? Are these primarily networks or online-onlystreaming sites?(2) What types of video content do users watch on theircomputers, in terms of length and topic/genre?(3) What temporal patterns exist in watching video oncomputers? Are there differences by hour of day orday of week in the types or durations of content thatpeople watch?(4) How do users arrive at specific video content that theywant to watch? Is it through links from other sites or
TVX 2019, June 4–6, 2019, Manchester, UKthrough browsing on a video portal. Does this vary byservice?To answer these questions, we gathered full web browserlogs from 174 diverse American participants, averaging 138days of use per participant. We then explored the use of 20different video sites in these logs to more broadly understandonline video watching behaviors in the US population. Wewill set this work in the context of previous studies, then explain our research methods, explore answers to our researchquestions, and then discuss what this means for online videoservices and implications for the design of new services orfeatures for desktop video streaming.2RELATED WORKWatching online video has been increasing in popularityover the years, compared to traditional means of watchinglinear broadcast content. As of June 2018, 66% of U.S. households had purchased access to a subscription-based videoon demand service (e.g. Netflix, Hulu, Amazon Prime) [15].In addition to having large libraries of video content available, users have highly positive perceptions of these onlineservices due to the added convenience of choosing whenand where content is watched [19], not being restricted to atraditional television set and fixed-line, wired connection.Watching Video on ComputersGiven this new freedom of device for watching professionalvideo content, surveys have shown that laptop and desktop computers are commonly used [10], and also preferredamong many users compared to using a mobile phone towatch video [18]. Computers are also frequently used overtelevision sets due to having greater access to various contentthrough a web browser with fewer DRM or device restrictions and the ability to consume such content on demand atany time [11].Rigby et al. [18] asked users in a lab to choose a Netflixmovie to watch, which was split into multiple sessions thatwere randomized across devices (4.5 inch phone, 12-inch laptop, and 30-inch monitor). They found that watching a movieon a laptop or monitor resulted in greater immersion withthe movie than watching on a smartphone, but there was nodifference in immersion between the laptop and the largermonitor. Similarly, a diary study conducted with householdsin the UK that watched more than five hours of video aweek [19] found that mobile viewing of video content wasregularly seen as not enjoyable and avoided if the situationallowed it. Additionally, they found that while users hada stated preference for watching on-demand content on atelevision, a computer was still the most common deviceused.Frank Bentley, Max Silverman, and Melissa BicaSeparate analysis from Rigby et al. indicated that the mostcommon time to start watching on-demand video was late atnight between 9-11PM [17]. Additionally, among this sample,the majority (69%) of viewing sessions were less than onehour, with only 12% of sessions over two hours in length.However, other research has shown [19] the length of viewing sessions differs based on whether the on-demand servicetypically hosts short- (e.g. YouTube, Vimeo) or long-formcontent (e.g. Amazon, Netflix). Sessions on short-form sitesaveraged about 42 minutes whereas sessions on long-formsites averaged 1 hour and 21 minutes.Watching YouTube VideosCheng et al. [9] scraped over three million unique YouTubevideos in 2007 and analyzed these videos on various dimensions, including the category assigned to the video onYouTube. They found that the three most common categoriesof videos were music (23%), entertainment (18%) and comedy (12%). In 2013, a similar process of data collection wasconducted by Che et al. [8]. They found in 2013 that themusic (23%) and entertainment (16%) remained the two mostcommon categories, followed by gaming (8.5%) due to thedecrease in comedy videos (12% in 2007 to 6% in 2013).A separate 10-year analysis from 2006 to 2016 [6] focusedon YouTube channels versus videos found that over this period, the number of music and entertainment channels thatwere created decreased (Music from 18% to 2%, Entertainment from 14% to 2% in 2016). On the other hand, the numberof People & Blogs channels created rose dramatically from13% of new channels in 2006 to 74% of new channel creationin 2016. Gaming channels saw a similar increase from 6% in2006 to 12% in 2016. Additionally, this analysis found that thetop 3% of YouTube channels from 2006 to 2016 accounted for85% of all video views. These changes were quite dramatic,and we were interested to see if these trends continued orchanged since 2016.Bartl [6] found that that older videos had significantlymore video views than more recently uploaded videos onYouTube. In 2006, it was found that the median number ofviews per video was over ten thousand, which became lessthan one thousand views in 2012, and less than one hundredmedian views in 2016[6]. As more YouTube content wasposted each year, each new video was viewed less often.In 2007, 98% of YouTube video lengths were 10 minutesor shorter in duration, due to YouTube’s strict restriction onlength [9]. In 2010, YouTube’s default video upload lengthbecame 15 minutes [13]. A few months later, YouTube beganto offer easy-to-follow verification instructions to increasethe limit to 12 hours [20]. In 2013, Che, Ip and Lin [8] foundthat only 2.6% of all videos fell beyond 11.7 minutes, withGaming and People & Blog videos leading to part of thatincrease. With the finding that both Gaming and People &
Exploring Online Video Watching BehaviorsBlogs channels continued to increase as of 2016, it is alsoimportant to understand whether that has resulted in users’watching longer YouTube videos.Binging Video ContentAcross all of these video platforms, the concept of bingingvideo is common. While there is no universally agreed upondefinition of binge-watching, a Netflix survey indicated thatthe majority of consumers define binge-watching as watching the same show for 2-6 episodes within a single sitting [14].Binging on-demand video, as referred to in the present day,has its roots in Netflix’s choice to release entire seasons oftheir original content at once. In 2013, when Netflix releasedthe 4th season of Arrested Development, it was found that10% of the show’s viewers watched all 15 episodes withintwenty-four hours of its launch [1]. As binging TV or related video content has become more common across users,a number of researchers have attempted to understand themotivations behind such behavior.Pittman and Sheehan [16] conducted a factor analysisto understand these motivations, both in the moment andwhen planning ahead to binge watch a show. Through afactor analysis of 27 potential statements grouped into fivefactors, a user’s level of engagement was the greatest factor inpredicting both current and future binge-watching behaviorsand the only factor that predicted the amount a user watcheda show [16]. The statements within the engagement factorincluded that the show was more interesting to binge, theshow being very entertaining, feeling more engaged with theshow and characters when binge-watching, and being ableto follow the less prominent story lines within such show.With the growth of these large online content libraries,and series syndicated from cable to online streaming, rewatching older videos has become more common Bentleyand Murray [2] found that 79% of users in their sample rewatched videos in the past week, and 92% did so in the priormonth. Some of the main motivations for doing so includedrewatching the video content with others to share or see others’ reactions, rewatching to change or replicate a mood, orfor nostalgia purposes. Additionally, they found that only 26%of the top rewatched content matched the types of contentthat users most frequently watch on television (e.g. reality,sports, news, music). For shows with in-depth stories andcharacters, 41% were re-watched on a computer versus only8% on a mobile phone.This related work has shown how online video behaviorshave quickly changed in the past and highlighted the needfor updated work in this area. While many studies have beenperformed on particular services in the past, we were unableto find a study that focused comprehensively across videoservices watched on computers. With this desire to exploreTVX 2019, June 4–6, 2019, Manchester, UKcross-service viewing and identify changes since much ofthis prior work was conducted, we set out on our study.3METHODSIn order to broadly understand how people are consumingvideo content on the web, we collected a set of complete webbrowser histories from the personal computers of a diverseset of Americans. Participants were recruited on AmazonMechanical Turk. After agreeing to participate, users weredirected to an online survey which provided a detailed explanation of the data we were collecting and why, followedby instructions for how to find one’s own browser historyfile (for either Chrome or Firefox) stored locally on theircomputer. The files contained a timestamped entry for eachwebpage viewed in either the last 3 months (Chrome) orsince the user first started using the browser (Firefox), inaddition to the URL and page title.We paid participants 5 for their browser history files, andreceived valid data from 174 participants, totaling nearly 9.5million unique page views over an average of 138 days ofhistory per participant. Our incentive amounted to an average 60/hour wage and is in line with existing research thatshows browsing history being valued at about the price of aBig Mac [7]. These participants are representative of the general US adult population in terms of age (18-72), gender (49%female), and household income (median 50k), and residein 39 distinct US states. Previous studies have shown thatMTurk samples can be quite accurate when studying technology use in the broader American population [3]. All datawas stored on encrypted drives and only two researchershad access to the raw data.We then created a list of top domains for online videowatching in America. This included online TV streamingsites such as Netflix and Hulu, premium content sites such asHBO and Showtime; broadcast networks such as CBS, NBC,ABC, and Fox; cable providers such as Comcast Xfinity, AT&TDirecTV, Verizon Fios, and Spectrum; and online video platforms such as YouTube, Vimeo, Vevo, Twitch, and Crackle.From these 22 domains, we captured 286,409 page views tothese video sites. Unfortunately, this misses videos embedded in other platforms, such as YouTube videos embedded inFacebook streams, which are not captured in web histories asdistinct page views. We also do not address any video viewsto pornographic content. Yet this is the most comprehensive look at video viewing on the desktop web that we areaware of, and we believe is important as a first step towardsunderstanding cross-site video use on computers.For each site, we manually explored the URL pattern forthat site to determine which types of URLs matched videoplayback (vs. search, browsing, login or other activities). Wealso wrote scripts to gather additional metadata for eachvideo, using the YouTube API or accessing IMDB data for
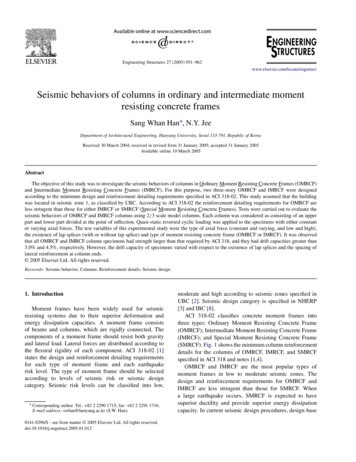
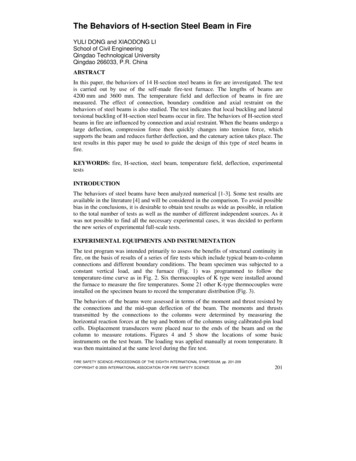
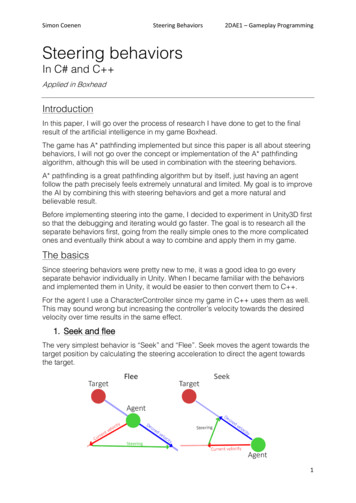
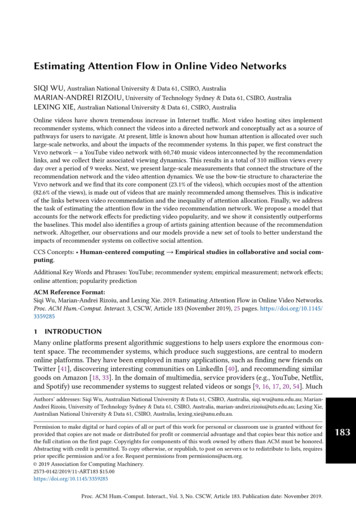
TVX 2019, June 4–6, 2019, Manchester, UKFigure 1: Video views per session on the top four video domains.Frank Bentley, Max Silverman, and Melissa BicaDomainYouTubeNetflixVimeoHuluHBOFacebook WatchAmazon 55211174Page 7163103974129286,409Video 21149,095Table 1: Overall use of video sites in our dataset.shows watched on other sites. For each video we collectedthe duration, genre/category, title, year produced, and description of the show.All research was approved by our institutional processesfor conducting work with human subjects and log data. Participants were clearly informed about our institutional identity, the exact data that was being collected, and our dataretention policies.4Figure 2: Length of videos watched for each of the top videoservices.FINDINGSOur dataset contained 9,487,564 total page views from our174 participants. The 286,299 video page views that we observed made up 3% of all web browsing activity. Using onehour idle session delimiters, there were 43,415 total webbrowsing sessions in this dataset, 12,894 (30%) includingpage views to our list of video domains. While video viewingrepresents a very small percentage of total page views, wefind it quite interesting that it occurs in almost one third ofweb sessions.Sites VisitedOur participants visited a wide variety of video sites in theirdatasets. YouTube was by far the most popular with 173 ofthe 174 users visiting a YouTube page, 246,603 total YouTubepageviews, and 89,581 unique videos played. As shown inTable 1, Netflix, Vimeo, Hulu, HBO, Facebook Watch, andAmazon Prime were visited by the highest number of usersoverall. The median user visited three unique video domains(of the 20 we analyzed) in their logs, with 25% of users visitingfour or more.Within a session, 90% of the time our participants onlyvisited one video site. An additional 8% of the time, they onlyvisited two domains, with less than 2% of sessions consistingof visits to more than two video domains. This is quite different from how users browse other types of content, such asnews. Previous research has shown that 40% of news sessionscontain visits to multiple news domains [5].Next we were interested in the number of videos that auser watches in a given session, specifically if this variedamong sites. Are some sites more “bingeworthy” than others?
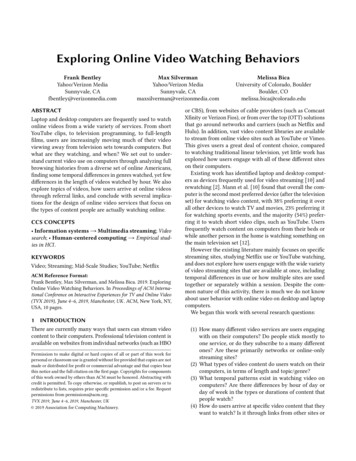
Exploring Online Video Watching BehaviorsThe median session that included video watching (hereafterreferred to as a “video session”) had four video views in it.When looking at specific domains, as shown in Figure 1 forthe top four video sites, we can see that certain sites invitewatching additional videos within a session. The mediansession including YouTube videos had four YouTube videosplayed, compared to sessions with Netflix and Hulu at twovideos each, and HBO at only one video per session that included an HBO video. Interestingly, 25% of YouTube sessionshad 11 or more videos played, compared to just two for HBO,three for Hulu and four for Netflix. We will return to thisdata when we explore content length in the next section inaddressing the total length of video played on each site.TVX 2019, June 4–6, 2019, Manchester, UKFigure 3: YouTube videos watched by year of production.Content of Videos WatchedWe will now move on to explore the content of the videosthat our participants watched. Using the YouTube API anddata from IMDB for other sources, we captured the category,year produced, and duration of each video. The categoriesare shown in Figure 5, with Music, Entertainment, People& Blogs, Gaming, and Comedy being the top-watched categories/genres.We found it interesting that distinctly user-generated content categories (such as People & Blogs and How To & Style)were vastly more popular than traditional TV and Moviegenres (such as Drama, Sports, and Reality). Twelve percentof all videos watched were in the People & Blogs category,compared to only 7% in Comedy, and 2% each in Drama andSports.Within a session, users often watched videos from different categories/genres. The median session in
views per video was over ten thousand, which became less than one thousand views in 2012, and less than one hundred median views in 2016[6]. As more YouTube content was posted each year, each new video was viewed less often. In 2007, 98% of YouTube video lengths were 10 minutes or shorter in duration, due to YouTube’s strict restriction on .