Transcription
Estimating Attention Flow in Online Video NetworksSIQI WU, Australian National University & Data 61, CSIRO, AustraliaMARIAN-ANDREI RIZOIU, University of Technology Sydney & Data 61, CSIRO, AustraliaLEXING XIE, Australian National University & Data 61, CSIRO, AustraliaOnline videos have shown tremendous increase in Internet traffic. Most video hosting sites implementrecommender systems, which connect the videos into a directed network and conceptually act as a source ofpathways for users to navigate. At present, little is known about how human attention is allocated over suchlarge-scale networks, and about the impacts of the recommender systems. In this paper, we first construct theVevo network — a YouTube video network with 60,740 music videos interconnected by the recommendationlinks, and we collect their associated viewing dynamics. This results in a total of 310 million views everyday over a period of 9 weeks. Next, we present large-scale measurements that connect the structure of therecommendation network and the video attention dynamics. We use the bow-tie structure to characterize theVevo network and we find that its core component (23.1% of the videos), which occupies most of the attention(82.6% of the views), is made out of videos that are mainly recommended among themselves. This is indicativeof the links between video recommendation and the inequality of attention allocation. Finally, we addressthe task of estimating the attention flow in the video recommendation network. We propose a model thataccounts for the network effects for predicting video popularity, and we show it consistently outperformsthe baselines. This model also identifies a group of artists gaining attention because of the recommendationnetwork. Altogether, our observations and our models provide a new set of tools to better understand theimpacts of recommender systems on collective social attention.CCS Concepts: Human-centered computing Empirical studies in collaborative and social computing.Additional Key Words and Phrases: YouTube; recommender system; empirical measurement; network effects;online attention; popularity predictionACM Reference Format:Siqi Wu, Marian-Andrei Rizoiu, and Lexing Xie. 2019. Estimating Attention Flow in Online Video Networks.Proc. ACM Hum.-Comput. Interact. 3, CSCW, Article 183 (November 2019), 25 pages. https://doi.org/10.1145/33592851INTRODUCTIONMany online platforms present algorithmic suggestions to help users explore the enormous content space. The recommender systems, which produce such suggestions, are central to modernonline platforms. They have been employed in many applications, such as finding new friends onTwitter [41], discovering interesting communities on LinkedIn [40], and recommending similargoods on Amazon [18, 33]. In the domain of multimedia, service providers (e.g., YouTube, Netflix,and Spotify) use recommender systems to suggest related videos or songs [9, 16, 17, 20, 54]. MuchAuthors’ addresses: Siqi Wu, Australian National University & Data 61, CSIRO, Australia, siqi.wu@anu.edu.au; MarianAndrei Rizoiu, University of Technology Sydney & Data 61, CSIRO, Australia, marian-andrei.rizoiu@uts.edu.au; Lexing Xie,Australian National University & Data 61, CSIRO, Australia, lexing.xie@anu.edu.au.Permission to make digital or hard copies of all or part of this work for personal or classroom use is granted without feeprovided that copies are not made or distributed for profit or commercial advantage and that copies bear this notice andthe full citation on the first page. Copyrights for components of this work owned by others than ACM must be honored.Abstracting with credit is permitted. To copy otherwise, or republish, to post on servers or to redistribute to lists, requiresprior specific permission and/or a fee. Request permissions from permissions@acm.org. 2019 Association for Computing Machinery.2573-0142/2019/11-ART183 15.00https://doi.org/10.1145/3359285Proc. ACM Hum.-Comput. Interact., Vol. 3, No. CSCW, Article 183. Publication date: November 2019.183
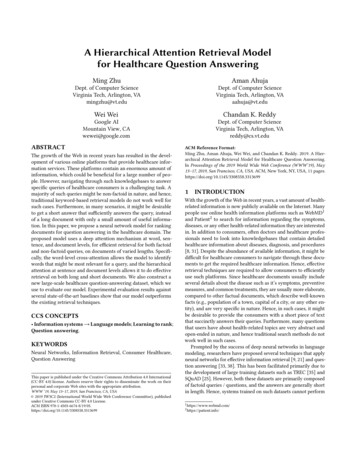
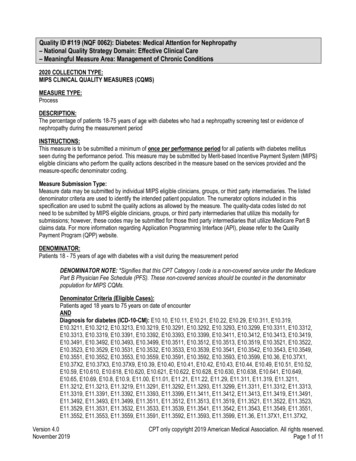
183:2Siqi Wu, Marian-Andrei Rizoiu, & Lexing XieHelloSomeone like you500K0daily viewsRolling in the deepRolling in the deepSkyfall1.0M1.0M001.0MSet fire to the rain400K500KSet fire to the rain(a)Someone like you1.0M10MHelloHometown glory1.5M20MSkyfall0Hometown glory200K0'11'12'13'14'15'16'17'18'19'10 '11 '12 '13 '14 '15 '16 '17 '18 '19(b)Fig. 1. Observing the effects of recommendation network on video popularity. (a) A directed network consistsof six videos by the artist Adele. The node size is proportional to the video’s cumulative view counts till Nov02, 2018. The red arrow highlights one possible route that users visit “Skyfall” from “Hello” in 2 hops. (b)View series for the six videos shown in (a). Visually we observe a simultaneous spike across all videos when“Hello” was uploaded on Oct 22, 2015, denoted by red dashed vertical line.effort has been on generating more accurate recommendations, but relatively little is said aboutthe effects of recommender systems on overall attention, such as their effects on item popularityranking, the estimated strength of item-to-item links, and global patterns on the attention gaineddue to being recommended. This work aims to answer such questions for online videos, usingpublicly available recommendation networks and attention time series.We use the term attention to refer to a broad range of user activities with respect to an onlineitem, such as clicks, views, likes, comments, shares, or time spent watching. The term popularity,however, is used to denote observed attention statistics that are often used to rank online itemsagainst each other. In this work, our measurement and estimation are carried out on the largestonline video platform YouTube (as of 2019), and we specifically quantify popularity using thenumber of daily views for each video. The outlined methods may well apply to other deeper formsof user engagement such as watch time. Due to data availability constraints, the validation in thiswork is limited to popularity.We illustrate the goals of this work through an example. Fig. 1(a) shows the recommendationnetwork for six videos from the artist Adele. It is a directed network and the directions implyhow users can navigate between videos by following the recommendation links. Some videosare not directly connected but reachable within a few hops. For example, “Skyfall” is not on therecommended list of “Hello”, but a user can visit “Skyfall” from “Hello” by first visiting “Rollingin the deep”. Fig. 1(b) plots the daily view series since the upload of each of the six videos. When“Hello” was released, it broke the YouTube debut records by attracting 28M views in the first 24hours [6]. Simultaneously, we observe a traffic spike in all of her other videos, even in three videosthat were not directly pointed by “Hello”. This example illustrates that the viewing dynamics ofvideos connected directly or indirectly through recommendation links may correlate, and it promptsus to investigate the patterns of attention flowing between them.This work bridges two gaps in the current literature. The first gap measures and estimates theeffects of recommender systems in complex social systems. The main goals of recommender systemsare maximizing the chance that a user clicks on an item in the next step [4, 16, 17, 48] or in a longertime horizon [5, 10, 23]. However, recommendation in social systems remains as an open problemfor two reasons: (1) a limited conceptual understanding of how finite human attention is allocatedProc. ACM Hum.-Comput. Interact., Vol. 3, No. CSCW, Article 183. Publication date: November 2019.
Estimating Attention Flow in Online Video Networks183:3over the network of content, in which some items gain popularity at the expense of, or with theassistance of others; (2) the computational challenge of jointly recommending a large collection ofitems. The second gap comes from a lack of fine-grained measurements on the attention capturedby items structured as a network. There are recent measurements on the YouTube recommendationnetworks [2, 13], but their measurements are not connected to the attention patterns on content.Similarly, measurement studies on YouTube attention [55] quantify the overall volume of viewsdirected from recommended links. However, no measurement that accounts for both the networkstructure and the attention flow is available for online videos.This paper tackles three research questions:RQ1: How to measure video recommendation network from publicly available information?RQ2: What are the characteristics of the video recommendation network?RQ3: Can we estimate the attention flow in the video recommendation network?We address the first question by curating a new YouTube dataset consisting of a large set of Vevoartists. This is the first dataset that records both the temporal network snapshots of a recommendersystem, and the attention dynamics for items in it. Our observation window lasts 9 weeks. Wepresent two means to construct the non-personalized recommendation network, and we discussthe relation between them in detail (Section 3).Addressing the second question, we conceptualize the global structure of the network as abow-tie [7] and we find that the largest strongly connected component accounts for 23.11% ofthe videos while occupying 82.6% of the attention. Surprisingly, videos with high indegree aremostly songs with sustained interests, but not the latest released songs with high view counts. Wefurther find that the network structure is temporally consistent on the macroscopic level, however,there is a significant link turnover on the microscopic level. For example, 50% of the videos with anindegree of 100 on a particular day will gain or lose at least 10 links on the next day, and 25% linksappear only once during our 9-week observation window (Section 4).Answering the third question, we build a model which employs both the temporal and networkfeatures to predict video popularity, and we estimate the amount of views flowing over each link.Our networked model consistently outperforms the autoregressive and neural network baselinemethods. For an average video in our dataset, we estimate that 31.4% of its views are contributed bythe recommendation network. We also find the evidence of YouTube recommender system boostingthe popularity of some niche artists (Section 5).The new methods and observations in this work can be used by content owners, hosting sites,and online users alike. For content owners, the understanding of how much traffic is driven amongtheir own content or from/to other content can lead to better production and promotion strategies.For hosting sites, such understanding can help avoid social optimization, and shed light on buildinga fair and transparent content recommender systems. For online users, understanding how humanattention is shaped by the algorithmic recommendation can help them be conscious of the relevance,novelty and diversity trade-offs in the content they are recommended to.The main contributions of this work include: We curate a new YouTube dataset, called Vevo Music Graph dataset1 , which contains the dailysnapshots of the video recommendation network over a span of 9 weeks, and the associated dailyview series for each video since upload. We perform, to our knowledge, the first large-scale measurement study that connects the structureof the recommendation network with video attention dynamics. We propose an effective model that accounts for the network structure to predict video popularityand to estimate the attention flow over each recommendation link.1 Thecode and datasets are publicly available at ityProc. ACM Hum.-Comput. Interact., Vol. 3, No. CSCW, Article 183. Publication date: November 2019.
183:42Siqi Wu, Marian-Andrei Rizoiu, & Lexing XieRELATED WORKIn this section, we discuss three lines of research: design of (video) recommender systems, measurements on recommender systems, and studies on user attention towards online items.2.1Recommender systems and video recommendationThe goals of recommender systems can be summarized as two related yet distinct tasks. The first taskis user-centric, i.e., given users’ profiles and past activities, finding a collection of items that mightinterest them [16, 25]. The resulting recommendations, often shown in user homepage feed, can beregarded as the entry point for the user action sequence. The second task is item-centric, i.e., giventhe currently visited item, finding a ranked list of relevant items [17, 20, 54]. This can be regardedas recommending the next item in a sequence of actions. In the same vein, we conceptualize andexplain the behaviors on YouTube — users start the action sequences by latent interests, and theirsubsequent actions are driven by network effects (see Section 5.2).Recommender systems on YouTube. Recommender systems, along with YouTube search, havebeen shown as the two dominant factors driving user attention on YouTube [55]. In 2010, Davidsonet al. [17] reported the usage of a collaborative filtering method in the YouTube recommendersystems, i.e., videos are recommended by counting the number of co-watches. This approach workswell for videos with many views, however, it is less applicable for newly uploaded videos or leastwatched videos. Bendersky et al. [4] proposed two methods to enhance the collaborative filteringapproach by embedding the video topic representation into the recommender. Covington et al.[16] applied deep neural networks and indicated that the final recommendation is a top-K samplefrom a large candidate set generated by taking into the account content relevance, past watch andsearch activities, etc. Other enhancements include incorporating contextual data [5]. Most recently,Chen et al. [10] and Ie et al. [23] showed success in applying reinforcement learning techniques inYouTube recommender systems.Our work
work is limited to popularity. We illustrate the goals of this work through an example.Fig. 1(a) shows the recommendation network for six videos from the artist Adele. It is a directed network and the directions imply how users can navigate between videos by following the recommendation links. Some videos