Transcription
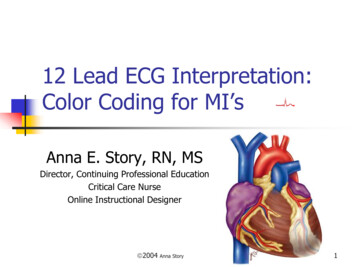
ECG InterpretationIntroduction to Cardiac TelemetryMichael Peters, RN, CCRN, CFRN – CALSTAR Air Medical Services
Disclosures Nothing to disclose
Objectives Describe the electrical conduction pathway in the heart Interpret a rhythm strip and identify life threateningdysrhythmias Anticipate common dysrhythmia treatment plans Identify presence of a pacemaker and its proper operation Apply skills toward the introduction of 12-lead EKG analysis
Cardiac Anatomy & Physiology
Cardiac Anatomy & Physiology
Einthoven’s Triangle
Precordial Leads
ECG monitor lead placement“White on Right”“Smoke over Fire”“Snow over Trees”“Chocolate lies close tothe heart”
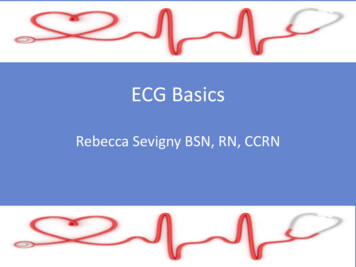
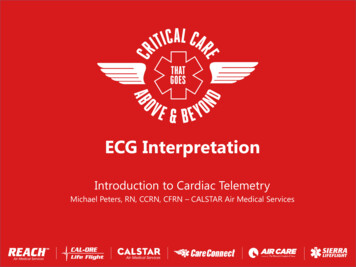
Anatomy of the ECGP wave Precedes QRS Usually rounded andupright 2-3mm amplitude 0.06 - 0.12 second durationAbnormalities Notched, peaked, enlarged– atrial hypertrophy Inverted – retrograde( junctional) conduction Varying – wanderingpacemaker rhythm
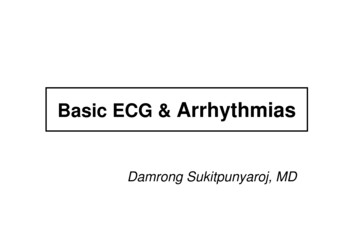
Anatomy of the ECGPR Interval Measured from thebeginning of the P-wave tothe beginning of the QRS. Tracks atrial impulse fromSA node through AV node,bundle branches. 0.12 – 0.20 second duration
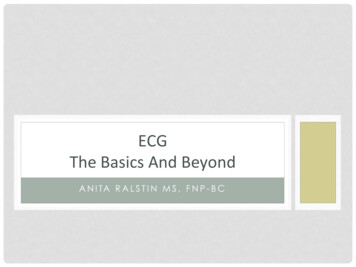
Anatomy of the ECGQRS Complex Depolarization of theventricles 5 – 30mm amplitude 0.06 – 0.10 second duration May not see all 3 waves or – deflectiondepending on leadWide QRS ( 0.12 sec) maysignify ventricular conductiondelay or origin. Notched R wave – BBB Deep Q wave – prior MI
Anatomy of the ECGST Segment Beginning of ventricularrepolarization S to beginning of T Usually isoelectricST depression 0.5mm below baseline Myocardial ischemia,electrolyte imbalanceST elevation 1mm above baseline Myocardial injury (STEMI)
Anatomy of the ECGT wave Ventricular repolarization Follows S wave 0.5-10mm amplitude Round and smooth Upright I, II, V3-V6,inverted aVR
Anatomy of the ECGT waveTall, peaked or tented –myocardial injury orhyperkalemiaInverted (I, II, V3-V6) –myocardial ischemiaNotched or pointed (adult) pericarditis
Anatomy of the ECGQT interval Represents ventricularpolarization/depolarization Beginning of QRS to end T Varies with age, gender,heart rate (0.36 – 0.44 sec)Prolonged QT Congenital defect Caused by certainmedications Risk for torsades de pointes
QT Prolongation Drugs
Analyzing a Rhythm StripBarill, T. (2012). The Six Second ECG, A Practical Guide to Basic and 12 Lead ECG Interpretation. SkillStat Learning Inc.
Analyzing a Rhythm StripHeart Rate – Methods of calculation1. Six second countBarill, T. (2012). The Six Second ECG, A Practical Guide to Basic and 12 Lead ECG Interpretation. SkillStat Learning Inc.
Analyzing a Rhythm StripHeart Rate – Methods of calculation2. Countdown MethodBarill, T. (2012). The Six Second ECG, A Practical Guide to Basic and 12 Lead ECG Interpretation. SkillStat Learning Inc.
Analyzing a Rhythm StripHeart Rate – Methods of calculation3. Caliper Method (1,500 Method)– Use calipers to measure the number of 1mm (small)boxes between R-R interval. Divide 1500 by this #.Example:1500 / 19 QRS complexes per minuteHeart Rate 79 beats per minute
Artifact and WanderingBaseline
Interpreting a Rhythm Strip1. Rate – Too fast or slow?2. Rhythm – Regular or Irregular?3. QRS wide or narrow?4. P-wave for every QRS?5. ST segment/T-wave abnormalities, ectopy,pacemaker spikes, etc.
Normal Sinus RhythmRate: 60-100 bpmP wave for every QRSRhythm: RegularT wave rounded, uprightQRS: Narrow ( 0.12 sec)No ectopic beats (PVC/PAC)
Sinus BradycardiaRate: Less than 60 bpmRhythm: RegularQRS: Narrow ( 0.12 sec)P wave for every QRST wave rounded, uprightNo Ectopic beats
Sinus TachycardiaRate: Greater than 100bpm P wave for every QRSRhythm: RegularT wave rounded, uprightQRS: Narrow ( 0.12 sec)No Ectopic beats
Sinus ArrhythmiaUsually regular sinus rate (60-100) with irregularrhythm that corresponds with respirations. Common inpediatrics.
Sinus Arrest/PauseSA node fails to discharge and then resumes.
Atrial Arrhythmias Premature Atrial Contraction (PAC)– Conducted (QRS complex following) or non-conducted.– P-P interval shorter than prior beats.– P wave may be hidden in prior T wave.
Atrial Arrhythmias Premature Atrial Contraction (PAC)– Conducted (QRS complex following) or non-conducted.– P-P interval shorter than prior beats.– P wave may be hidden in prior T wave.
Atrial Arrhythmias Multifocal Atrial Tachycardia (MAT)– Irregular rhythm, rate 100, varying P waves
Atrial Arrhythmias Wandering Atrial Pacemaker– Irregular rhythm resulting from multiple pacemaker sitesinitiating beats.http://www.ekgstripsearch.com/WAP.htm
Atrial Arrhythmias Paroxysmal Atrial Tachycardia (PAT)– Brief periods of tachycardia that alternate with periods ofnormal sinus rhythmhttps://aneskey.com/atrial-arrhythmias/
SUPRAVENTRICULARTACHYCARDIA (SVT)Rate: 150–250 bpmRhythm: RegularP Waves: Frequently buried inQRS: Normal (0.06–0.10preceding T waves and difficult to sec)but may be wide if abnormallyseeconducted through ventriclesPR Interval: Usually not possible tomeasure
Atrial FibrillationChaotic, asynchronous, electrical activity in atrial tissue. Leads to loss of atrial kick (30% of cardiac output) Absence of P waves and irregular ventricularresponse (Irregularly irregular)
Atrial Flutter Atrial rate approx. 300 bpm with characteristic“sawtooth” pattern (flutter waves). Ventricular rate dependent on conduction ratio. Symptoms dependent on cardiac output.
Atrial Flutter Atrial rate approx. 300 bpm with characteristic“sawtooth” pattern (flutter waves). Ventricular rate dependent on conduction ratio. Symptoms dependent on cardiac output.
Junctional Rhythms
Junctional Rhythms Originates from AV junction if SA node fails Atria depolarize but impulse is retrograde (reverse) Junctional escape rate 40-60bpm
Junctional RhythmsAccelerated Junctional (60-100 bpm)Junctional Tachycardia ( 100 bpm)
First Degree AV Block*Characterized by PR interval 0.2 sec*Rate: Normal (not affected) P wave for every QRSRhythm: RegularNarrow QRS, normal T
2nd Degree AV Block Type I*AKA Wenckebach or Mobitz I*Rate: Normal (A V)P wave for every QRS butRhythm: Atrial – regularQRS dropsVentricular – Irregular Gradual PR increase
2nd Degree AV Block Type II*AKA Mobitz II*Rate: Normal (A V)P wave for every QRS butRhythm: Atrial – regularQRS drops SUDDENLYVentricular – Irregular PR remains constant
3rd Degree AV Block(Complete)*Potential LIFE THREATENING Rhythm*Rate: Slow (20-60)QRS: normal or wideRhythm: Atrial – regular; Ventricular – regularAtria and ventricles operating independently, norelation between P and QRS.
3rd Degree AV Block (Complete)https://www.unm.edu/ lkravitz/EKG/avblocks.html
Bundle Branch Block
Bundle Branch Blocks QRS 0.12 Assess V1 for QRS morphology Patients with a prolonged QRS( 0.15) may require apacemaker
Practice with Heart Blocks
More Practice
Ventricular Dysrhythmias QRS 0.12Wide and BizarreHidden P waves20-40 BPM
Premature VentricularContraction (PVC)
Premature VentricularContraction (PVC) Patient Assessment? Treatment?
Ventricular Tachycardia Life-threatening dysrhythmia! Wide and bizarre Rate of 101-250 impulses/min Pulses vs. pulseless
Torsades De Pointes Lethal dysrhythmia! Wide and bizarre Often 150 impulses/min Pulses vs. pulseless
Torsades De Pointes Lethal dysrhythmia! Wide and bizarre Often 150 impulses/min Pulses vs. pulseless
Ventricular FibrillationPulseless!!! Lethal dysrhythmia
Idioventricular/Agonal Dysrhythmia Lethal! Last attempt!
AsystoleLethal!Immediate Treatment Required!
Pulseless Electrical Activity (PEA)
Pulseless Electrical Activity (PEA)
Pacemakers Power source generates an impulse, which istransmitted to the heart tissue, w-pacemakers-work.html
PacemakersTypes of temporary pacing Epicardial – wires attached directly to the heart wall duringcardiac surgery. (A/V)
PacemakersTypes of temporary pacing Transvenous – Placed percutaneously and advanced to theventricle via the IJ or subclavian vein. (V)
PacemakersTypes of temporary pacing Transcutaneous – Pads placedon the patient’s bare skin.
Pacemakers
Pacemaker TroubleshootingFailure to Capture Check connections, patient position, increasemA.
Pacemaker TroubleshootingFailure to Pace Check connections, change battery, change pulsegenerator Over sensing? – mistakes other impulses ormuscle activity for intrinsic activity
Pacemaker TroubleshootingFailure to Sense Increase sensitivity Decrease demand rate
Recognizing Cardiac Tissue Damage
Recognizing Cardiac Tissue DamageMore than just ST-elevationIschemia– Interrupted oxygen (blood)supply.– Tissue is still viable– Repolarization temporarilyimpaired (inverted T-waves)
Recognizing Cardiac Tissue DamageMore than just ST-elevationInjury– Prolonged lack of oxygen(blood) supply.– Tissue is still viable (for now)– Cells do not fully repolarizebecause of deficient bloodsupply (ST elevation)
Recognizing Cardiac Tissue DamageMore than just ST-elevationInfarction– Areas of necrosis (deadtissue).– Cells do not depolarize,causing new pathological Qwaves to appear.– Tissue is eventually replacedby scar tissue.
Zones of InjuryIschemia: T-waveinversionInjury: ST-elevationInfarction (necrosis):pathological Q-waveReciprocal Changes(opposite side of heart)
A Look at 12-Leads
Where is the MI?
Where is the MI?
Location MattersAnterior, Septal, Lateral – Involve Left AnteriorDescending and Circumflex Left sided Heart Failure (Pump problem)––––––Dyspnea (w/wo exertion)Pulomanry Edema (rales, crackles)OrthopneaCool extremities, weak pulses, cyanosisLethargy, fatigue, confusionRestlessness Treatment – ASA, O2, analgesia, NTG, inotrope
Location MattersInferior, RV, Posterior – Right Coronary Artery(possibly L Circumflex) RV failure (Preload problem)–––––JVD, Edema, SwellingAnorexia, Nausea, AscitesConfusion, LethargyHypotensionHeart Block (be prepared to PACE!) Treatment – ASA, O2, analgesia, VOLUME
Location Matters R sided MI: Why not NTG?– Nitro vasodilates, causing further loss of preload (i.e.blood, O2), worsening the problem.
R sided MI after NTG
Putting It All Together Always assess your patient first!– Treat the patient not the monitor! Determine the situationInvestigate the causeIntervene/TreatmentReassessGet to definitive care
ReferencesBarill, T. P. (2012). The Six Second ECG: A Practical Guide to Basic and 12 LeadECG Interpretation. Palm Springs, CA: SkillStat Learning Inc.http://www.skillstat.comDubin MD, D. (2009, May). Reference Sheets from Rapid Interpretation of EKG’s.Retrieved from http://www.cardiacmonitors.com/personal reference.phpSlate, M. K. (2017, August). EKG Interpretation. Retrieved dfWolters Kluwer Health. (2011). ECG Interpretation Made Incredibly Easy! (5thEd.). Ambler, PA: Lippincott Williams & Wilkins.
Practice Strips
Practice Strips
Practice Strips
Practice Strips
Practice Strips
ECG simulator
Apply skills toward the introduction of 12-lead EKG analysis. Cardiac Anatomy & Physiology. Cardiac Anatomy & Physiology . Einthoven’s Triangle. Precordial Leads. ECG monitor lead placement “Whiteon Right” “Smokeover Fire” “Snowover Trees” “Chocolatelies close to the heart” Anatomy of the ECG P wave Precedes QRS Usually rounded and upright 2-3mm amplitude .