Transcription
Jahangiry et al. BMC Oral Health(2020) EARCH ARTICLEOpen AccessOral health status and associated lifestylebehaviors in a sample of Iranian adults: anexploratory household surveyLeila Jahangiry1,2*, Raziollah Bagheri1, Fatemeh Darabi3, Parvin Sarbakhsh4, Mohammad Mehdi Naghibi Sistani5 andKoen Ponnet6AbstractBackground: Poor oral hygiene can lead to serious diseases, such as periodontitis, tooth decay, pain and discomfort inteeth or gums, infections, and loss of teeth. In Iran, adults aged 50 y and older are a high-risk group for oral healthproblems, and this age group will grow in the coming decades. Despite increasing attention on healthy aging, there isrelatively less emphasis on oral hygiene and health-related problems. The present study investigated the oral healthstatus of Iranian adults using the oral health self-assessment questionnaire (OHQ) developed by the World HealthOrganization (WHO).Methods: A population-based household survey of a sample of adults aged 18–65 y was conducted. In this study, theparticipants were recruited between May and October 2016 in Tabriz, Iran, and the study population was sampledusing a multi-stage cluster sampling design. The WHO’s OHQ for adults was used for measuring oral health status andoral hygiene behavior.Results: In total, 2310 respondents completed the survey. The mean age (SD) of the participants was 41.6(23.4) y.Males accounted for 48.8% of the participants. Of the 2310 respondents,187 (8.1%) individuals were edentulous,152(20.7%) of whom were aged 51–65 y. Furthermore, 72.3% of those aged 51–65 y were dentate, and 50% of adultsaged 51–65 y said they had 20 or more teeth. About one-third of the participants reported that they did not brushtheir teeth daily (23% of those aged 18–35 y,35.9% of those aged 36–50 y, and 44.6% for those aged 51–65 y). In thesample, 39.4% of individuals aged 18–35 y,34.1% of individuals aged 36–50 y, and 26.6% of individuals aged 51–65 yhad visited a dentist less than 6 month ago. One-third of the participants consumed sweets and sugary drinks daily.Conclusions: Although the majority of Iranian adults considered their oral health status good, only a small percentageof the sample visited their dentist regularly. Furthermore, visits to the dentist declined in accordance with increasingage, a time when the incidence of oral health problems may increase. Poor oral health may increase the risk of adversehealth outcomes, particularly among the aging population.Keywords: Oral health status, Household survey, Adults, Older population* Correspondence: jahangiry@razi.tums.ac.ir1Health Education and Health Promotion Department, School of PublicHealth, Tabriz University of Medical Sciences, Tabriz, Iran2Tabriz Health Services Management Research Center, Tabriz University ofMedical Sciences, Tabriz, IranFull list of author information is available at the end of the article The Author(s). 2020 Open Access This article is licensed under a Creative Commons Attribution 4.0 International License,which permits use, sharing, adaptation, distribution and reproduction in any medium or format, as long as you giveappropriate credit to the original author(s) and the source, provide a link to the Creative Commons licence, and indicate ifchanges were made. The images or other third party material in this article are included in the article's Creative Commonslicence, unless indicated otherwise in a credit line to the material. If material is not included in the article's Creative Commonslicence and your intended use is not permitted by statutory regulation or exceeds the permitted use, you will need to obtainpermission directly from the copyright holder. To view a copy of this licence, visit http://creativecommons.org/licenses/by/4.0/.The Creative Commons Public Domain Dedication waiver ) applies to thedata made available in this article, unless otherwise stated in a credit line to the data.
Jahangiry et al. BMC Oral Health(2020) 20:82IntroductionPoor oral hygiene has a significant impact on oral healthand can give rise to various problems, such as periodontitis, tooth decay, tooth or gum pain and discomfort, andinfection and loss of teeth. Current evidences show thatpoor oral hygiene is cause of biofilm accumulation andthat relatively specific group of indigenous oral bacteriais cause of plaque-induced inflammatory periodontal diseases [1]. Poor oral health can result in additional complications, included swallowing, chewing, and speechdifficulties, and these, in turn, can affect sleep qualityand work productivity [2, 3].There is strong evidence that untreated oral diseases anddisorders not only negatively affect general health but alsoincrease the probability of diabetes and cardiovascular diseases [4, 5]. A meta-analysis of follow-up studies estimatedthat poor oral health and periodontal diseases may increasethe risk of such diseases by approximately 20% [6]. Otherstudies indicated that periodontal diseases significantly increased the risk of myocardial infarctions [6, 7].Natural tooth loss, dental plaque accumulation, and inflammation of gingival tissues increase with age [8]. Theaging population in Iran is set to increase dramatically in thecoming decades [9]. According to the World HealthOrganization (WHO), nearly 10% of the Iranian populationis older than 60 y, and this will rise to 21.7% by 2050 [10–12]. As a result of this aging population, the prevalence ofchronic diseases, especially health and oral health problems,will increase, which has implications for health care serviceuse and costs [13, 14]. Although increasing attention is paidto healthy aging, there is relatively little emphasis on oralhealth. Some years ago, the WHO recommended conductinghousehold surveys of adults to gather epidemiological information on the oral health status and dental caries patterns ofdifferent age groups, with the findings utilized to draw up appropriate and tailored oral health care [15].The aim of this study was to investigate the oral health status (the number of natural teeth, pain or discomfort on teeth,having dentures) and oral health behaviors (e.g., using toothbrush, dental flossing, and toothpaste containing fluoride) ofpeople living in urban areas in Tabriz, Iran, and to determinedemographic (age and gender) differnces between themthrough a houshold survey. Such information is essential forfuture prevention programs and oral health interventions. Inthe present study, we conducted a household survey to investigate the oral health status of adults in Tabriz, Iran. Specifically, we administered the WHO’s oral health self-assessmentquestionnaire (OHQ) to a sample of Iranian adults of different ages.MethodsStudy design and populationThis cross-sectional study focused on adults aged 18–65y who were recruited between May and October 2016 inPage 2 of 9Tabriz. A population-based household survey was conducted to recruit a sample of adults from the community. The eligibility criteria were as follows: a) living inthe study area and being at home at the time of data collection and (b) not having a diagnosis of mental or cognitive disorders. Written informed consent was obtainedfrom each participant.Sampling and sample sizeThe population of Tabriz was estimated to be 980,000(aged 18–65 y) in 2016 [16]. To estimate the oral healthstatus of 50% (edentulous) of the population, accordingto the study [9] a likely sample proportion was considered 50%, then, with a 95% confidence, an error of 1.8%and finite population number (980,000), the sample sizewas estimated (n 2956). We rounded it to 3000 inpractice. For sampling, the study population was sampled using a multi-stage cluster sampling design [17]. Inthe first sampling stage, the city was divided into fourareas (West North, West South, East North, and Eastsouth) based on socio-economic status. In the nextstage, one health care centers (HCC) was randomly selected from each area (in total four HCCs from 16HCCs). Because all people’s health records were available in the HCCs, they are used in the sampling as firstsampling units. In the next stage, 25% of street blocks inthe area of the selected four HCCs were randomly selected. Determined sample size (3000 persons) was proportionally divided into four area. For each block, every11th household in the block was then contacted, and thesuitability of the household members for inclusion in thestudy was assessed. Finally, in each household, eligibleindividuals were asked to participate in the study. Intotal, 690 people refused to participate in the study.Sampling in the blocks was continued until the requiredsample size specified for that block was reached. Fourtrained researchers conducted the interviews. Interviewers were public health students working as publichealth researchers and having at least 2 years of experience as an interviewer in survey-based health researches.They received three 90- min training sessions onsuccessful performance of completing the study questionnaire. Their first ten interviews were qualitativelyevaluated by 4 experienced researchers, to guarantee thequality of the interviews. In total, 2310 respondentscompleted the survey (a 77% response rate).Data collection and questionnaireThe WHO’s OHQ for adults was used for measuring theoral health status and oral health behaviors of the participants [17]. The WHO’s OHQ consists of 16 variables.Four questions are used to assess oral health status: (a)self-reported number of teeth present (0 no naturalteeth, 1 1–9 natural teeth, 2 10–19 natural teeth, and
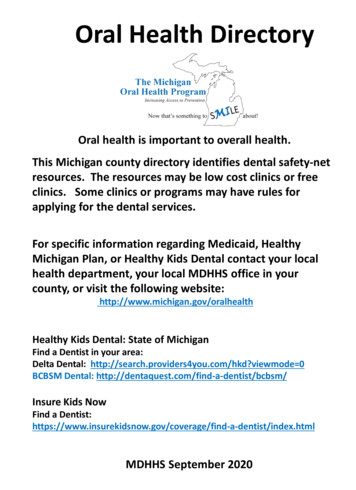
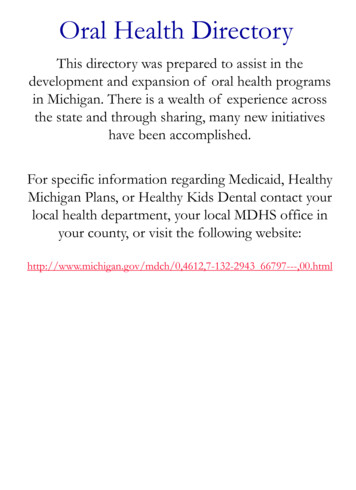
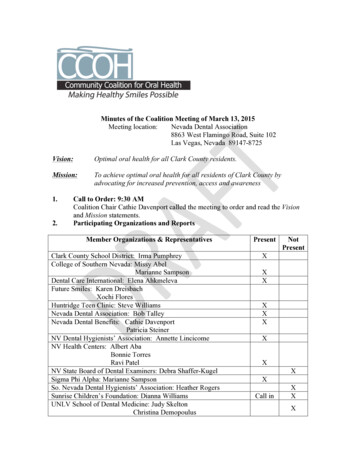
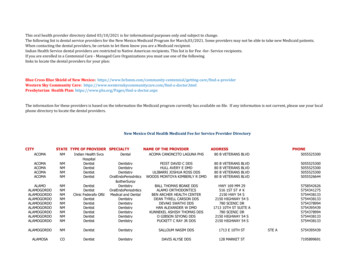
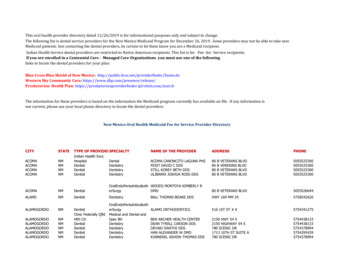
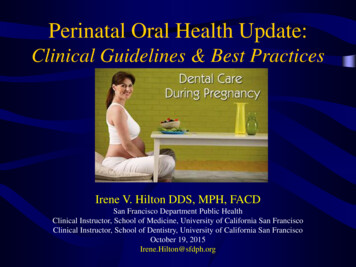
Jahangiry et al. BMC Oral Health(2020) 20:823 20 natural teeth or more),; (b) experience of oral/dental pain/discomfort (yes/no); (c) wearing of removable dentures (partial/full upper/full lower; yes/no); and(d) self-assessment of the status of teeth and gums (ranging from 1 excellent to 6 very poor). Three itemsare used to assess oral health related behaviors: (a) frequency of perform oral hygiene (ranging from 1 neverto 6 once a day); (b) use of aids/tools for oral hygiene(e.g., toothbrush, wooden toothpick, dental floss; yes/no); and (c) use of a fluoride- or nonfluoride toothpaste(yes/no). Two questions are related to the frequency ofdental visits, with scores ranging from 1 (less than 6 moago) to 5 (5 y ago or longer), and the reasons for thedental visit(s) (e.g. consultation/advice, treatment/follow-up treatment, and dental or oral pain/discomfort).One question assesses reduced quality of life (QoL) dueto 12 oral problems (e.g., difficulty biting or chewingfood), with the responses scored as 0 don’t know, 1 no, 2 sometimes, 3 fairly often, and 4 very often.One question examines the consumption of sugary foods(e.g., biscuits and cream cakes) and drinks (e.g., tea withsugar) and fresh fruit consumption, with the answersscored as follows: 1 never/seldom, 2 several times amonth, 3 once a week, 4 several times a week, 5 every day, and 6 several times a day. One item assessestobacco use (cigarettes, pipe, cigar, snuff, and tobaccochewing) and frequency (1 never/seldom, 2 severaltimes a month, 3 once a week, 4 several times a week,5 every day, and 6 several times a day). The last question assesses the consumption of alcohol (usually thenumber of drinks per day) during the past 30 d (rangingfrom 0 less than 1 drink to 5 5 or more drinks). Theremaining questions relate to the socio-demographiccharacteristics of the sample in terms of age (18–35, 36–50, and 51–65 y) and sex (male or female).The validity and reliability of the WHO’s OHQ wasassessed based on standardized cross-cultural translationguidelines [18]. The English version of the WHO’s OHQwas translated into Persian. Two native Persian translators unrelated to the study translated the OHQ. Any disputes were resolved by consensus. Two professionaltranslators then back translated the OHQ from Persianto English. The translators and researchers checked andagreed on the final Persian version. Content validity wasdetermined in a pilot study of 20 individuals [19]. Following feedback on the scale, changes were made to thewording of some items. The Persian version of theWHO’s OHQ was then evaluated by an expert panel(three health educationists and two dentists).Statistical analysisStatistical analyses were performed using the StatisticalPackage for Social Science, Version 18 for Windows(SPSS Inc., Chicago, IL, USA). Normality of the data wasPage 3 of 9analyzed using the Kolmogorov–Smirnov test. Discretevariables are presented with numbers and percentages.According to the sampling design, weight of each observation was determined and this weight was used in dataanalysis. Chi square test was used to assess relationshipbetween categorical variables. In all tests, a value of p 0.05 was considered statistically significant.ResultsDemographic characteristics and oral health statusThe mean age (SD) of the 2310 participants was 41.6(23.4) y. Males accounted for 48.8% of the study population. In the sample, 187 (8.1%) participants were edentulous, and 152 (20.7%) of these participants were aged51–65 y. In addition, 72.3% of the participants were dentate (i.e. 20 or more teeth). The rate was 92.7% for adultsaged 18–35 y, 71.3% for adults aged 36–50 y, and 49.4%for adults aged 51–65 y.In the study, 61.2% of all participants reported experiencing dental and oral pain or discomfort in the previous 12 mo. Table 1 presents an overview of the oralhealth status of the participants in the different agegroups (18–35 y, 36–50 y, and 51–65 y). The results revealed significant between-group differences, with thoseaged 18–35 y (71.2%) reporting significantly more dental/oral pain or discomfort as compared with that of theindividuals aged 36–50 y (55.8%) and 51–65 y (54.8%).In total, 359 participants (15.5%) had a removable partialdenture, of whom 9% were aged 18–35 y, 16.6% wereaged 36–50 y, and 21.8% were aged 51–65 y.With regard to self-reported dental health status,63.5% (n 1425) reported good dental health. There wasno significant difference among the three age groups interms of self-reported health status.The tooth brushing and cleaning habits of the threeage groups are shown in Table 2. About one-third of theparticipants reported that they did not brush their teethdaily (23% in the 18- to 35 y -old age group, 35.9% inthe 36- to 50 y-old age group, and 44.6% in the 51- to65 y-old age group). In terms of tooth cleaning habits,62% reported using a toothbrush, 24% reported usingdental floss, and 62% reported using toothpaste.Table 3 provides information on dental care visitsamong the three age groups and the reasons for thesevisits. In the study, 39.4, 34.1, and 26.6% of adults aged18–35 y, 36–50 y, and 51–65 y, respectively, had visiteda dentist less than 6 mo. The most frequent reason(50.9%) for visiting the dentist was dental or oral pain ordiscomfort.Table 4 provides an overview of the oral health problems of the study population during the last year. Themost frequent oral health issues reported by adults aged18–35 y were cosmetic concerns related to the appearance of teeth. In contrast, the most frequent oral health
Jahangiry et al. BMC Oral Health(2020) 20:82Page 4 of 9Table 1 Dental health status of the participantsVariablesAge (y); n (%)Number of natural teeth18–3536–5051–65No natural teeth0 (0)35 (4.9)152 (20.7)1–90 (0)21 (2.9)10–1963 (7.3)150 (20.9)20 teeth or more795 (92.7)513 (71.3)362 (49.4)611 (71.2)401 (55.8)402 (54.8) 0.0001Partial removable denture80 (9.3)119 (16.6)160 (21.8)Full upper denture9 (1)57 (7.9)Full lower denture4 (0.5)44 (6.1)Good526(60.8)475 (66.2)424 (57.8)Average265 (30.5)138 (19.1)188 (31.8)275 (46.5)53.5 (316)Poor49 (5.7)94 (13.1)88 (38.1)106 (45.9)125 (54.1)Good310 (39.2)292 (46.6)258 (40.0)417 (48.5)443 (51.5)Average126 (16.0)79 (12.5)96 (14.2)137 (45.5)164 (54.5)Poor354 (44.7)256 (40.9)289 (44.8)460 (51.2)439 (48.8)Dental/oral pain or discomfort during the last 12 mo (yes) (yes)p-valueTotal 0.0001Malefemalep-value93 (49.7)94 (50.3)155 (21.1)87 (49.4)89 (50.6)64 (8.7)124 (44.8)153 (55.2)824 (49.3)846 (50.7)657 (46.5)757 (53.5)0.004 0.0001174 (48.5)185 (51.5)0.881187 (25.5) 0.0001127 (50.2)126 (49.8)0.645157 (21.4) 0.0001103 (50.2)102 (49.8)0.672722 (50.7)703 (49.3)0.553Presence of removable denturesStatus of dental health0.061Status of gum health0.1410.050problem among adults aged 36–50 y and 51–65 y wasmastication difficulty (43.5 and 54%, respectively).Information on lifestyle behaviors, including dietary habits(e.g., the consumption of fresh fruit, sweets [biscuits andcakes], and sugary drinks) and tobacco and alcohol consumption, is provided in Table 5. Only 5.7% of the participants consumed fresh fruits several times a day, and 85% of theparticipants consumed fresh fruits several times a week. Aboutone-third (35%) of the participants consumed biscuits, 57.1%consumed cakes, 38% consumed jam or honey every day, andhalf of them consumed tea with sugar each day. In the sample,88% of the participants reported never or seldom smoking,and 6% reported consuming alcohol several times a week.0.202DiscussionThis household survey aimed to determine the oralhealth status of adults living in Tabriz, Iran. This oralhealth survey revealed that about 72% of the study population had 20 or more teeth but that only 50% of thoseaged 51–65 y had 20 teeth or more. A similar study conducted in Iran among adults aged 35–44 y reported thatalmost all the participants had a substantial number ofdental and periodontal problems [20]. The same studyalso reported that 6.6% of the sample had missing teethAccording to the WHO’s worldwide map of oral health,Iranian adults aged 35–44 y have a moderate level ofdental caries [21]. The current study revealed that 8% ofTable 2 Frequency and percentage of dental hygiene habits (tooth cleaning) of the study sampleVariablesAge (y), n (%)18–35p-value36–5051–65Tooth cleaningLess than once a dayOnce a day or morep-valueTotalMalefemale404 (51.2)385 (48.8)0.055202 (23.6)259 (35.9)328 (44.6)0.104656 (76.4)460 (64.1)405 (55.4)Toothbrush527 (61.4)460 (62.7)405 (62.3)Wooden toothpicks146 (17)155 (21.6)158 (21.6)0.03222 (48.4)237 (51.6)0.824Plastic toothpicks6 (0.7)7 (1)21 (2.9)0.0115 (44.1)19 (55.9)0.580Dental floss213 (24.8)175 (24.3)164 (22.4)0.01243 (44.0)309 (56.0)0.010Nonfluoride toothpaste527 (61.4)460 (62.7)405 (62.3)0.5701020 (48.8)1071 (51.2)0.880Fluoride-containing toothpaste315 (36.4)241 (33.4)245 (32.7)0.068823 (48.8)864 (51.2)0.0680.835724 (47.6)797 (52.4)673 (46.9)763 (53.1)0.015
Jahangiry et al. BMC Oral Health(2020) 20:82Page 5 of 9Table 3 Frequency of dental visits and the reasons for these visitsp-valueVariableAge (y), n al visit 0.0010.517Less than 6 mo ago274 (32.0)237 (33.3)185 (26.0)347 (49.9)349 (50.1)More than 6 mo ago584 (68.0)482 (66.7)548 (74.0)781 (48.4)833 (51.6)36 (4.2)41 (5.7)28 (3.8)68 (64.8)37 (35.2)Reason of last visit to the dentistConsultation/advice 0.0010.002Dental/oral pain (teeth, gums/mouth)433 (50.5)291 (40.5)451 (61.5)581 (49.4)594 (50.6)Treatment291 (33.9)247 (34.4)186 (25.4)351 (48.5)373 (51.5)Routine check-up92 (10.7)133 (18.5)63 (8.6)119 (41.3)169 (58.7)the participants were edentulous (no natural teeth),15.5% had a removable partial denture, and 10% had afull (lower or upper) denture. The prevalence of edentulism among adults aged 51–65 y was 20.7%. A similarprevalence of edentulism among males aged 71–92 ywas reported in a U.K. study [22]. However, there weresome methodological differences between our studiesand mentioned study in the field of gathering information and measurements where in that study physicalexamination of participants and brief oral health assessment were included [22].In systematic review, a Chinese population aged 65 yhad an average of 20 teeth [23]. In a Swiss health survey,by using self-report questionnair
dental visits, with scores ranging from 1 (less than 6 mo ago) to 5 (5 y ago or longer), and the reasons for the dental visit(s) (e.g. consultation/advice, treatment/fol-low-up treatment, and dental or oral pain/discomfort). One question assesses reduced quality of life (QoL) du