Transcription
2020 FULL-TIME MBAEMPLOYMENT REPORT2020 Full-time MBA Employment Report Johns Hopkins Carey Business School 1
WELCOMEThis year, the already complex and competitive marketplace was thrown into upheaval bya pandemic. Both newly minted MBA students and our first-year students seeking summerinternships faced many unknowns in their job searches. But the economic uncertainty did notdefine our graduates’ success.Carey built upon our already strong global and local employer partnerships and forged newrelationships with employers. And our graduates truly showed the value of their degrees. Despitethe pandemic, we saw an increase in average salaries and bonuses and an almost 10 percentincrease in the number of students who accepted job offers by graduation— with over half ofour students reporting that the primary sources of their job offers were facilitated by the JohnsHopkins Carey Business School network.Not only did our graduates secure jobs, they found jobs at top employers including Amazon,Cigna, Deloitte, EY, and Siemens. These top-tier companies continue to hire Carey talent year afteryear. Amazon and Siemens have hired Carey graduates since 2012 and continue to hire multipleCarey graduates each year.In the face of uncertainty, our graduates used the analytic and leadership skills learned in theirMBA to find their niche and excel. Explore our 2020 full-time MBA employment data to see theJohns Hopkins difference.Christy MurrayAssistant Dean, Career DevelopmentNote: This report conforms to the MBA Career Services & EmployerAlliance Standards for Reporting MBA Employment Statistics.
2020 Full-time MBA Employment ReportOverview92.9%ACCEPTED FULL-TIMEOFFERS**120 days after graduation. 114,812AVERAGE BASE SALARYPLUS SIGNING BONUS* 9 5 , 9 8 8 AV E R A G E S A L A R Y 1 8 , 8 2 4 AV E R A G E S I G N I N G B O N U S*Values have been rounded to the nearest whole dollar amount. 25,98480%AVERAGE ADDITIONALGUARANTEED COMPENSATIONACCEPTED NEWEMPLOYMENT INNORTH AMERICA
2020 Full-time MBA Employment ReportDemographics and EmploymentDEMOGRAPHICS:29.2MEDIAN AGEAT GRADUATION92.9%E M P L O Y M E N T S TAT I S T I C S esidentU.S. Citizen orPermanent ntNot Seeking Employment1220%931%39.7%Continuing Education433.3%333.3%133.3%Starting New Business216.7%222.2%00%Other Reason650%444.4%266.6%Seeking Employment4270%1655.2%2683.9%Full-time Offer Accepted3583.3%1275%2388.5%Full-time Offer Extended24.8%16.3%13.8%Part-time Offer Accepted12.4%16.3%00%Still Seeking Employment49.5%212.5%27.7%No Information610%413.8%26.5%Total Graduates60100%29100%31100%*Within 120 days after graduation. 83.3% accepted offers within 90 days after graduation.2020 Full-time MBA Employment Report Johns Hopkins Carey Business School 4
2020 Full-time MBA Employment ReportCompensation 114,812AVERAGE BASE SALARYPLUS SIGNINGBONUS*BA S E S A L A RY :Graduates ReportingBase SalaryCitizenshipCountPercentMeanMedianLowHighU.S. Citizen orPermanent Resident2296% 91,767 82,500 52,000 190,000Non-Permanent Resident975% 106,306 100,000 70,000 156,000Total Graduates3189% 95,988 90,000 52,000 190,000SIGNING BONUS:Graduates ReportingSigning BonusCitizenshipCountPercentMeanMedianLowHighU.S. Citizen orPermanent Resident1043% 18,000 15,000 5,000 40,000Non-Permanent Resident758% 20,000 10,000 5,000 70,000Total Graduates1749% 18,824 10,000 5,000 70,000O T H E R G U A R A N T E E D C O M P E N S AT I O N :Graduates ReportingOther Guaranteed ghU.S. Citizen orPermanent Resident313% 19,364 20,000 14,091 24,000Non-Permanent Resident433% 30,950 9,400 5,000 100,000Total Graduates720% 25,984 14,091 5,000 100,000*Values have been rounded to the nearest whole dollar amount.2020 Full-time MBA Employment Report Johns Hopkins Carey Business School 5
2020 Full-time MBA Employment Report29%ACCEPTED NEWEMPLOYMENT INMANAGEMENTSalary by Function and IndustryBA S E S A L A RY BYPROFESSIONAL FUNCTION:Graduates AcceptingNew EmploymentProfessional % 102,118 96,971 55,000 155,000Finance/Accounting39% 101,667 100,000 90,000 115,000General Management1029% 89,080 71,400 52,000 156,000Human Resources13%----Information Technology26%----Marketing/Sales514% 95,688 91,375 80,000120,000Not Specified39%----Other39%----Total Graduates35100% 95,988 90,000 52,000 190,000*Because fewer than three graduates reported salary information in Human Resources, IT, and other functions, those salaries are not included.BA S E S A L A RY BY I N D USTRY :Graduates AcceptingNew sulting411% 97,000 94,000 85,000 115,000Energy39% 88,500 90,000 70,500 105,000Financial Services39% 100,000 90,000 55,000 155,000Government26%----Health Care1131% 91,875 80,000 59,000 ---Non-Profit13%----Other13%----Technology514% 95,348 93,942 65,000130,000Transportation and Logistics13----Total Graduates35100% 95,988 90,000 52,000 190,000(Including Products and Services)*Because fewer than three graduates reported salary information in the Government, Manufacturing, Other, and Transportation and Logistics industries,those salaries are not included.2020 Full-time MBA Employment Report Johns Hopkins Carey Business School 6
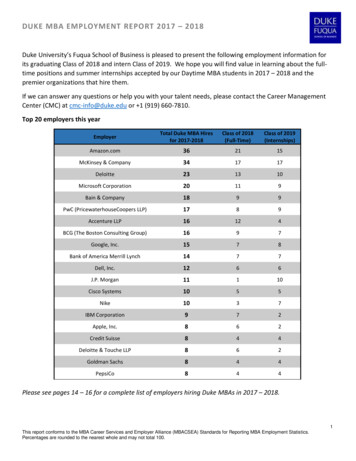
2020 Full-time MBA Employment ReportEmployersO R G A N I Z AT I O N S H I R I N G F U L L-T I M E M B A G R A D U AT E SBaltimore anaherDeloitteErnst & YoungExelon CorporationExxonMobile CorporationFedExGoogleHighmark HealthGuidehouseKaiser PermanenteMedifastOptumU.S. Agency for International Development(USAID)2020 Full-time MBA Employment Report Johns Hopkins Carey Business School 7Lifebridge HealthSiemens Healthineers
2020 Full-time MBA Employment ReportBase Salary by Region3%50%80%Accepted newemploymentin AsiaACCEPTED NEWEMPLOYMENT INMID-ATLANTICAccepted newemployment inNorth AmericaBA S E S A L A RY BY W O R LD R EG I O N :Graduates AcceptingNew EmploymentWorld h America2880% 95,409 90,000 52,000 190,000Unknown617% 101,877 115,630 60,000 130,000Total Graduates35100% 95,988 90,000 52,000 190,000*Because fewer than three graduates reported salary information in the Asia world region, those salaries are not included.BA S E S A L A RY BY N O RTH A M ER I C A N G EO G R A P H I C R EG I O N :Graduates AcceptingNew EmploymentNorth American ited States2796% 95,233 89,000 52,000 190,000Mid-Atlantic1450% 92,254 85,000 52,000 155,000Northeast414% 106,250 85,000 65,000 190,000South27%----Southwest27%----West518% 109,800 115,000 70,000 156,000Total Graduates28100% 95,409 90,000 52,000 190,000*Because fewer than three graduates reported salary information in the Canada, South, and Southwest geographic regions, those salaries arenot included.2020 Full-time MBA Employment Report Johns Hopkins Carey Business School 8
2020 Full-time MBA Employment ReportSource of Job Offers51%ACCEPTED A JOBTHROUGH ASCHOOL-FACILITATEDACTIVITYS C H O O L- FA C I L I TAT E DACTIVITIES:School-FacilitatedCountPercentCareer Center Activity411%Career Center Job Posting39%Other13%Scheduled Interview13%Conversion to Internship39%School Network/Resources617%Total on of Internship39%Online Posting13%Other39%Personal Contact411%Total Graduates1131%*17% of graduates did not report a source.S E L F - FA C I L I TAT E DACTIVITIES:*17% of graduates did not report a source.2020 Full-time MBA Employment Report Johns Hopkins Carey Business School 9
2020 Full-time MBA Employment ReportClass of 2021 Full-Time MBA Internships(Summer 2020)O R G A N I Z AT I O N S T H AT H I R E DF U L L-T I M E M B A S U M M E R I N T E R N S :90%OF STUDENTS SEEKINGAN INTERNSHIPRECEIVED ONE* 25.77/HR» ARP» IBM» Abbott» Johns Hopkins University & Health System» Amazon» McKinsey & Company» Collectiv» Municipal Acquisitions» Eli Lilly and Company» NovuGens LLC» EY LLP» PayPal» Frontdoor» Raytheon Technologies» FutureFirst» Schrodinger» GL Capital» Siemens Healthineers» Highmark Health» T-Mobile USA, Inc.I NTERNSH I P BY FUNCTION:I NTER N SH I P BY I N D USTRY :Average rate of pay**INDUSTRIESWITHAVERAGEHOURLYRATE OF ulting6%Data and Analytics3%Financial Services3%General Management6%Health Care35%Marketing18%Information hnology: 50Health Care: 27.50Non-Profit: 11.68*Values have been rounded to the nearest whole percentage amount.**98% of students reported the internship data shown on this page. 30% of these students reported salary information.2020 Full-time MBA Employment Report Johns Hopkins Carey Business School 10
FOR M OR E I N FOR MATION :Career Development development@jhu.edu410-234-92702020 Full-time MBA Employment Report Johns Hopkins Carey Business School 11
MBA to find their niche and excel. Explore our 2020 full-time MBA employment data to see the Johns Hopkins difference. Christy Murray. Assistant Dean, Career Development. Note: This report conforms to the MBA Career Services & Employer Alliance Standards


