Transcription
MBAEMPLOYMENT REPORT2018-2019MIT SLOAN CAREER DEVELOPMENT OFFICEMIT SLOAN MBA 2018-2019 EMPLOYMENT REPORT 1
EMPLOYERS HIRING MEMBERS OF THE MBA CLASSES OF 2018 AND 2019Abac CapitalAccion SystemsAcquiaACS Infrastructure DevelopmentActivision BlizzardAdobe SystemsAeris PartnersAir Products and ChemicalsAltman Vilandrie & CompanyAmazon*American Express CompanyAmerican Industrial Partners*AmgenAmplifyAnalysis GroupAnheuser-Busch InBevAppleApplied MaterialsAppNexusAspen Institute, TheBain & CompanyBank of America Merrill LynchBarclays CapitalBCG Digital VenturesBeacon Capital PartnersBeautycounterBechtel EnterprisesBell Helicopters*Bigfoot BiomedicalBill & Melinda Gates FoundationBimbo GroupBiobot AnlyticsBlackRockBlue Like an Orange SustainableCapitalBlue OriginBoeing*Boston Children's HospitalBoston Consulting Group, TheBrandes Investment PartnersBrattle Group, TheBrava HomeBridgespan Group, TheBridgewater AssociatesBristol-Myers SquibbC3 IoTCapital Group Companies, TheCarabao TawandangCarbonCarGurusCarlyle GroupCasa Verde CapitalCatalia HealthCatchCencosud SACFLD InternationalClimate Corporation, TheCisco SystemsClarifaiClarion HealthcareClark Construction GroupCMA CGMCoinFundCoinListCommunity Investment ManagementCoolship.ioCornerstone ResearchCorningCredit SuisseCulture AmpCustomerFirst RenewablesDalberg Global DevelopmentAdvisorsDanaher Corporation*DarcMatterDataWalletDell EMC*Deloitte ConsultingDeutsche BankDimensional Fund AdvisorseBayEducation PioneersEl Celler de Can RocaEllington Management GroupEmbr LabsEmerson Electric Co.EnerNOCEngine, TheEnglishHelperEpic GamesEvercore PartnersEvidation HealthFacebookFarmer's FridgeFidelity InvestmentsFIT Big DataFJ LabsFlybridge Capital PartnersFord Motor CompanyFoxRock PropertiesFrontier Capital ManagementCompanyGenentechGlasswing VenturesGoldman SachsGoogleGorton'sHashdex Ltd.Hedera HashgraphHilton WorldwideHoneywell InternationalHouston AstrosHubSpotIBMIDEOImpossible FoodsIndigoInvescoJobs for the FutureJPMorgan ChaseKasikorn Business-TechnologyGroupKaterraKeyBanc Capital MarketsKresge Foundation, TheL.E.K. ConsultingLamborghiniLerer HippeauLiberty Mutual InsuranceLinkedInLiving EarthLogMeInMacquarieMajor League BaseballMarathon Venture PartnersMassachusetts Clean Energy CenterMasterCard WorldwideMcKinsey & CompanyMeituan DianpingMenlo SecurityMFS Investment ManagementMGM ResortsMicrosoftMISTIMIT AgeLabMondelez InternationalMorgan StanleyMoveworksNational Basketball AssociationNational Grid*Navis Capital PartnersNew Balance Athletic ShoeNew York City EconomicDevelopment CorporationNew York Hockey HoldingsNextEra EnergyNike*Nova EscolaNVIDIA CorporationObama FoundationOccidental Petroleum CorporationOECDOktaOmniOpen SesafiOptiverPAAMCOParthenon- EYPathAIPayPalPeernovaPeople.aiPhilips HealthcarePIMCOPlug and Play Tech CenterPoly6PrinsiriProduction Board, TheProteus Digital HealthPwC Strategy&QuantopianReaction CommerceRecruit Holdings Co.RedStone Haute CoutureREI SystemsRelay Investment ManagementRent the RunwayRestaurant Brands InternationalRiot GamesRise AcceleratorRoland rSchneider ElectricScrum VenturesShire PharmaceuticalsSidewalk LabsSiemens AGSimon-Kucher & PartnersSnapSolgasSonoma BrandsSound VenturesSpaceKnowSpaceXSpirit AerosystemsSpotifySquarepoint OpsStaplesStarbucks Coffee CompanyState StreetStreet DiligenceSTRIVR LabsStubHubSumo LogicSunShareTA RealtyTATCHATDF VenturesTesla MotorsThailand Action LearningThayerMahanThermo Fisher ScientificTHINXThomas H. Lee PartnersThomson ReutersThree Hills Capital PartnersTiger Global ManagementT-Mobile USAToyota Research InstituteTripAdvisorTrueVaultTwilioTwitterUber TechnologiesUnder ArmourUnited Pipes and Steel Co.United Technologies - Pratt &WhitneyUnity TechnologiesVerizon Communications*Vertex PharmaceuticalsVirta HealthVOX SpaceWalt Disney Company, TheWatermill Group, TheWayfairWellington Management CompanyWeWorkWilliam Blair & CompanyWorldQuantYear UpYOOX Net-a-Porter GroupYotpoZeitgoldZestFinanceZX VenturesRed Employers hiring three or more MIT Sloan MBA students for full-time and/or summer positions.*LGO Partner during 2017-2018 academic year.2 MIT SLOAN MBA 2018-2019 EMPLOYMENT REPORT
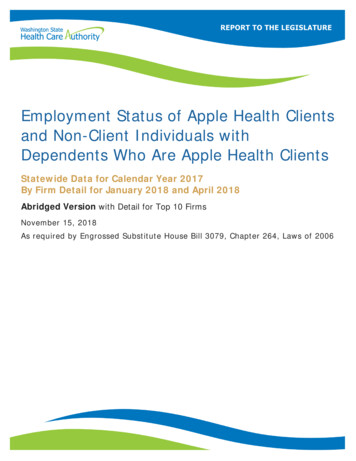
MBA CLASS OF 2018 FULL-TIME EMPLOYMENT DATAInventing the future.EMPLOYMENT OVERVIEW1 135,000Median Base Salary41% 50,000— 250,000 Range of Base Salary1STEM UndergradFull-time employment statistics based on job acceptances. 98.3% of reportedacceptances included usable salary information.CLASS PROFILE2Number of Candidates409U.S. Citizens61%Non-U.S. Citizens39%Women40%Median GMAT Score724Average Undergraduate GPA (out of 4.0)3.530%Average Age at Entry to MIT Sloan28Average Years Full-Time Work Experience Prior toMIT Sloan4.8Accepted offers intechnology2Class profile, as of matriculation, includes information for MBA students and students in thejoint MBA/Leaders for Global Operations program.EMPLOYMENT PROFILE3NUMBER%Seeking Employment30776.4Not Seeking Employment9222.9Sponsored & Returning to Company4411.0Starting Own Business399.7Postponing Job Search20.5Continuing Education71.7No Information Available30.8402100Total340%WomenAll information based on data reported by students.TOP EMPLOYERS OF MBA CLASS OF 2018Amazon (27)Goldman Sachs Group (6)Boston Consulting Group, The (24)Analysis Group (5)McKinsey & Company (22)Microsoft Corporation (5)Bain & Company (15)Tesla Motors (5)10%Google (10)Wayfair (5)Started a businessDeloitte Consulting (9)Ford Motor Company (4)Fidelity Investments (6)IBM (4)MIT SLOAN MBA 2018-2019 EMPLOYMENT REPORT 3
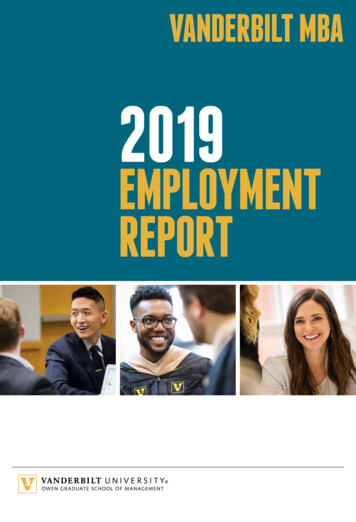
Class of 2018 MBA Base Salary by IndustryINDUSTRY%MEDIANMEANLOWHIGHSERVICE INDUSTRIES78.7 135,000 136,690 50,000 230,000Consulting31.6 147,000 142,988 73,677 185,000Software/Internet26.7 130,000 133,317 115,000 199,999Investment Management6.9 132,500 139,000 115,000 230,000Private Equity/Venture Capital3.8 125,000 133,727 60,000 175,000Investment Banking/Brokerage3.8 125,000 133,636 125,000 150,000Retail2.8 120,000 125,625 100,000 150,000Diversified Financial Services1.7 115,000 113,000 95,000 130,000Media/Entertainment/Sports1.4 125,000 110,000 50,000 140,000MANUFACTURING INDUSTRIES18.8 125,000 128,370 85,000 170,000Automotive/Aerospace5.6 135,000 138,125 115,000 170,000Oil/Energy4.2 120,000 116,667 85,000 130,0003.1 122,000 120,556 90,000 138,0002.8 122,500 124,375 120,000 135,000Pharmaceutical/Healthcare1.7 130,000 133,400 120,000 160,000Computers/Electronics1.4 140,000 143,750 140,000 155,000NONPROFIT1.4 90,000 92,000 72,000 116,0001.1 155,000 182,500 142,000 250,000Consumer ProductsManufacturing: OtherOTHER1212Manufacturing: Other includes Manufacturing, Telecommunications, and Transportation/Equipment/Defense.Other includes Government and Real Estate.Top Full-Time e3Technology includes Software/Internet, Computers/Electronics, and Telecommunications.4 MIT SLOAN MBA 2018-2019 EMPLOYMENT REPORT
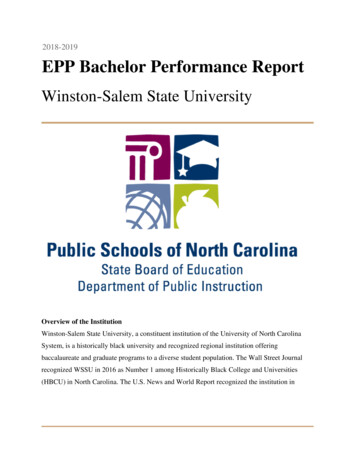
Class of 2018 MBA Base Salary by egic Planning38.5 147,000 139,186 50,000 185,000Product Management/Development14.7 135,000 136,795 120,000 199,999Finance14.0 125,000 129,256 60,000 230,0005.6 127,500 138,750 115,000 230,0003.4 125,000 125,111 111,000 130,000Investment Banking2.1 137,500 137,500 125,000 150,000Venture Capital1.8 85,000 100,000 60,000 170,000Sales & Trading1.1 130,000 123,333 105,000 135,000Operations/Project Management12.9 130,000 133,919 95,000 175,000Leadership Development Program/General Management9.8 122,500 126,786 95,000 150,000Marketing/Sales4.9 127,500 130,143 115,000 150,000Business Development3.2 130,000 131,667 100,000 160,0002.0 127,500 142,917 85,000 250,000Investment ManagementFinance: OtherOther1212Finance: Other includes Private Client Services and Wealth Management.Other includes Information Technology.Top Full-Time %15.8%12.5%14.7%Consulting/Strategic PlanningConsulting/Strategic PlanningConsulting/Strategic PlanningProduct ons/Project ManagementOperations/Project ManagementMIT SLOAN MBA 2018-2019 EMPLOYMENT REPORT 5
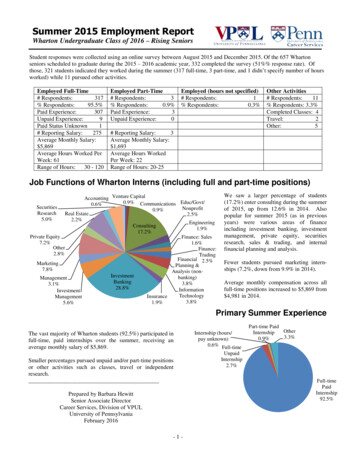
Class of 2018 MBA Base Salary by Geographic LocationLOCATION%MEDIANMEANLOWHIGHNORTH AMERICA90.7 135,000 136,892 50,000 250,000USA88.9 135,000 137,408 50,000 250,000Northeast42.5 140,000 140,966 72,000 250,000Metro Boston24.3 142,250 140,750 85,000 250,000Metro NYC13.6 137,500 142,303 72,000 230,00030.0 130,000 133,720 60,000 170,00013.2 135,000 137,946 115,000 170,000Southwest5.7 135,000 133,031 50,000 155,000Midwest4.6 130,000 134,769 105,000 165,000Mid-Atlantic3.6 147,000 137,050 95,000 155,000South2.5 145,000 136,571 115,000 152,000Mexico1.4 109,000 110,250 105,000 118,000Canada0.4-1---REST OF THE WORLD9.3 120,000 115,979 60,000 175,000Europe including UK3.6 128,000 127,018 100,000 150,000Asia3.2 120,000 111,520 60,000 175,000Latin America & the Caribbean1.8 100,000 94,319 80,000 101,5930.4-1----1---WestSan Francisco Bay AreaMiddle EastOceania10.3Dash indicates fewer than three people, or less than 1%, reported salary information.Class of 2018 MBA Base Salary by Undergraduate MajorUNDERGRADUATE MAJOR%MEDIANMEANLOWHIGHBusiness19.2 140,000 133,875 50,000 185,000Engineering30.8 135,000 134,389 60,000 175,000Science & Mathematics10.0 137,500 136,712 85,000 180,000Social Sciences & Humanities40.0 130,000 135,317 60,000 250,000Class of 2018 MBA Base Salary by Professional ExperiencePROFESSIONAL EXPERIENCE%MEDIANMEANLOWHIGHLess than 1 year, up to 1 year5----More than 1 year, up to 3 years21.5 147,000 146,917 120,000 175,000More than 3 years, up to 5 years43.5 130,000 132,431 50,000 250,000More than 5 years30.0 135,000 135,923 60,000 230,0006 MIT SLOAN MBA 2018-2019 EMPLOYMENT REPORT
Class of 2018 Signing Bonus Received by Job Function1FUNCTION%MEDIANMEANLOWHIGHInvestment Banking100.0 52,500 50,833 40,000 60,000Product Management/Development82.5 35,000 44,660 10,000 100,000Leadership Development Program/General Management82.1 30,000 33,964 20,000 70,000Marketing/Sales71.4 40,000 35,727 5,000 60,000Consulting/Strategic Planning70.3 30,000 31,823 6,000 100,000Operations/Project Management70.3 35,000 42,824 7,500 90,00070.0 25,000 23,571 5,000 35,000Investment Management58.8 30,000 36,818 10,000 70,000Business Development50.0 20,000 20,400 10,000 42,000Venture Capital20.0 25,000 25,000 25,000 25,000Finance: Other2170.3% of the students reporting usable salary data reported receiving a signing bonus.Percentages represent the number of students who received a signing bonus in the function.2Finance: Other includes Corporate Finance, Finance Operations, Treasury and M&A.Class of 2018 MBA Other Guaranteed Compensation% Reporting19.6Class of 2018 MBA Timing of Job OffersMEDIANMEANLOWHIGH 27,000 40,976 7,000 450,000Class of 2018 MBA Timing of Job AcceptancesAT GRADUATIONTHREE MONTHSAFTER GRADUATIONAT GRADUATIONTHREE MONTHSAFTER GRADUATION90.9%97.0%85.9%93.6%Class of 2018 MBA Reason for Accepting PositionClass of 2018 MBA Source of Job OffersREASON FOR ACCEPTING POSITIONSOURCE OF JOB OFFERS%%Growth Potential35.3Job Function22.9Summer Internship33.9Industry16.0On-Campus Interviews20.3People/Corporate Culture10.5Job Postings (MIT or Sloan)5.4Prestige of Firm5.8Faculty/CDO/Sloan Student Sloan Sponsored Events3.2Commitment to Sustainability0.4Resume Databases, Resume Referrals1.1Other3.2School-Facilitated ActivitiesStudent-Facilitated Activities72.524.6Contacted Directly8.5Personal Network7.9Previous Employer3.9Summer Internship2.9Newspaper, Magazine, Internet Job Boards1.4Other2.9MIT SLOAN MBA 2018-2019 EMPLOYMENT REPORT 7
MBA CLASS OF 2019 INTERNSHIP EMPLOYMENT DATACLASS PROFILE1Number of Candidates404U.S. Citizens67%Non-U.S. Citizens33%Women42%Median GMAT Score722Median Undergraduate GPA (out of 4.0)3.5Average Age at Entry to MIT Sloan29Average Years Full-Time Work Experience Prior toMIT Sloan4.91Class profile, as of matriculation, includes information for MBA students and students in thejoint MBA/Leaders for Global Operations program.EMPLOYMENT PROFILE2NUMBER%Seeking Employment30477.0Not Seeking Employment9123.0Leaders for Global Operations5012.6Starting a Business225.6Sponsored & Returning to Company164.1Postponing Job Search20.5Other Reason(s) for Not Seeking10.2395100Total2All information based on data reported by students.EMPLOYMENT OVERVIEW3Median Monthly Base Salary 8,000Range of Monthly Base Salary3 800 - 32,000Summer employment statistics based on internship acceptances. 97.2% of reportedacceptances included usable salary information.TOP EMPLOYERS OF MBA CLASS OF 2019Boston Consulting Group, The (24)Goldman Sachs (5)Amazon (13)JPMorgan Chase (5)Google (12)McKinsey & Company (5)Bain & Company (9)Nike (5)Anheuser-Busch InBev (7)Deloitte Consulting (4)Bridgewater Associates (7)Parthenon-EY (4)Tesla Motors (6)Wayfair (4)8 MIT SLOAN MBA 2018-2019 EMPLOYMENT REPORT
Class of 2019 MBA Monthly Salary by IndustryINDUSTRY%MEDIANMEANLOWHIGHSERVICE INDUSTRIES72.2 8,900 8,967 1,000 32,000Software/Internet24.1 8,000 8,090 2,000 32,000Consulting20.1 11,560 10,763 2,500 13,050Investment Banking/Brokerage7.2 10,416 10,435 5,000 20,000Investment Management6.8 11,100 9,744 3,500 12,000Venture Capital4.3 6,250 5,717 1,000 9,400Diversified Financial Services3.6 9,050 9,080 2,000 20,000Media/Entertainment/Sports2.5 6,000 4,857 1,000 7,400Retail2.2 5,500 6,150 1,600 10,800Private Equity1.4 8,750 8,375 6,000 10,000MANUFACTURING INDUSTRIES22.0 6,500 6,587 934 32,000Consumer Products7.6 6,500 6,381 3,500 9,000Pharmaceutical/Healthcare4.3 6,790 6,756 3,600 9,800Oil/Energy4.0 7,600 7,163 4,416 9,1002.5 7,500 7,029 4,000 9,500Automotive/Aerospace2.2 5,050 4,989 934 8,000Computers/Electronics1.4 7,586 7,203 4,640 9,000GOVERNMENT/NONPROFIT2.2 2,190 2,863 800 7,000OTHER23.6 6,750 5,683 1,000 9,500Manufacturing: Other11Manufacturing: Other includes Manufacturing, Telecommunications, and Transportation/Equipment/Defense.2Other includes Hospitality, Real Estate, and Education.Top Internship 9%Technology includes Software/Internet, Computers/Electronics, and Telecommunications.MIT SLOAN MBA 2018-2019 EMPLOYMENT REPORT 9
Class of 2019 MBA Monthly Salary by egic Planning31.7 10,100 9,484 1,000 13,050Finance19.1 8,600 8,688 1,000 20,000Investment Banking6.1 10,417 10,599 5,000 20,00014.3 7,750 7,622 3,500 12,500Venture Capital4.0 5,600 5,456 1,000 8,000Investment Management3.6 9,333 10,080 5,000 20,000Research1.1 10,000 9,333 8,000 10,000Product Management/Development12.6 8,000 7,621 2,000 11,750Operations/Project Management9.7 6,080 7,028 1,600 32,000Business Development9.0 6,500 6,302 934 10,000Marketing/Sales7.6 7,680 6,986 1,000 10,800Leadership Development Program/General Management6.1 8,500 8,851 4,800 12,0004.2 6,500 6,000 800 9,000Finance: OtherOther122Finance: Other includes Sales & Trading, Corporate Finance, Private Client Services/Wealth Management and Treasury.Other includes Human Resources, Sustainability and Real Estate.Top Internship %12.6%12.2%10.5%Consulting/Strategic PlanningConsulting/Strategic PlanningConsulting/Strategic PlanningFinanceFinanceFinanceProduct Management/DevelopmentProduct Management/DevelopmentOperations/Project Management10 MIT SLOAN MBA 2018-2019 EMPLOYMENT REPORT
Class of 2019 MBA Monthly Salary by Geographic LocationLOCATION%MEDIANMEANLOWHIGHNORTH AMERICA87.7 8,000 8,295 1,000 32,000USA86.6 8,000 8,280 1,000 32,000Northeast38.3 8,600 8,650 1,000 13,050Metro Boston22.3 8,250 8,391 1,000 13,050Metro NYC11.9 8,000 8,461 1,000 13,00036.7 8,000 7,967 1,500 32,00022.7 7,680 7,848 1,500 32,000Midwest3.6 7,450 7,076 1,000 12,500South3.6 8,383 8,432 3,000 12,500Southwest2.2 10,000 9,628 6,500 12,250Mid-Atlantic2.2 7,000 7,410 5,000 11,460Mexico1.1 12,000 9,500 3,500 13,000REST OF THE WORLD12.3 7,794 7,479 800 20,000Asia6.8 8,850 9,505 4,000 20,000Europe2.5 4,500 4,983 800 12,000Latin America & the Caribbean2.2 5,000 5,133 2,000 8,0000.4-1----1---WestSan Francisco Bay AreaAfricaMiddle East10.4Dash indicates fewer than three people, or less than 1%, reported salary information.Class of 2019 MBA Monthly Salary by Undergraduate MajorUNDERGRADUATE MAJOR%MEDIANMEANLOWHIGHBusiness19 8,000 7,562 2,880 12,250Engineering31 8,120 8,047 934 13,000Science & Mathematics13 8,600 8,401 4,250 12,500Social Sciences & Humanities37 8,000 7,930 1,000 13,000Class of 2019 MBA Monthly Salary by Professional ExperiencePROFESSIONAL EXPERIENCE%MEDIANMEANLOWHIGHLess than 1 year, up to 1 year2.9 7,500 8,300 6,500 12,500More than 1 year, up to 3 years12.3 8,000 7,861 934 20,000More than 3 years, up to 5 years47.0 8,000 8,254 1,000 32,000More than 5 years37.8 8,000 8,479 1,600 12,500MIT SLOAN MBA 2018-2019 EMPLOYMENT REPORT 11
Class of 2019 MBA Reason for Accepting PositionClass of 2019 MBA Source of Job OffersREASON FOR ACCEPTING POSITIONSOURCE OF JOB OFFERS%%Job Function26.5School-Facilitated Activities74.0Industry25.1On-Campus Interviews38.1Growth Potential21.5Prestige of Firm11.3Job Postings (MIT or Sloan)22.3People/Corporate Culture7.4MIT/Sloan Sponsored loan Student Referral2.5Commitment to Sustainability2.5Club Event1.4Resume Databases, Resume Referrals0.7Student-Facilitated Activities24.1Contacted Directly15.1Personal Network7.9Newspaper, Magazine, Internet Job Boards1.1Other1.9Accuracy in Reporting Employment StatisticsThe MIT Sloan School of Management adheres to the MBA Career Services & Employer Alliance (MBA CSEA)Standards for Reporting MBA Employment Statistics (mbacsea.org). Conformance to this business school industrystandard ensures accurate and comparable employment data. Currently, the majority of the leading MBA programs adhere to these accepted reporting standards. MIT Sloan takes a leadership role to promote the importance of accurateand comparable employment and salary statistics to prospective students and employers.Nondiscrimination Policy: Commitment to Equal OpportunityThe Massachusetts Institute of Technology is committed to the principle of equal opportunity in education andemployment. The Institute prohibits discrimination against individuals on the basis of race, color, sex, sexual orientation,gender identity, pregnancy, religion, disability, age, genetic information, veteran status, or national or ethnic origin in theadministration of its educational policies, admissions policies, employment policies, scholarship and loan programs, andother Institute administered programs and activities; the Institute may, however, favor US citizens or residents inadmissions and financial aid.*The Vice President for Human Resources is designated as the Institute’s Equal Opportunity Officer. Inquiries concerningthe Institute’s policies, compliance with applicable laws, statutes, and regulations, and complaints may be directed toLorraine Goffe, Vice President for Human Resources, Room NE49-5000, 617-253-6512. In addition, inquiries about TitleIX (which prohibits discrimination on the basis of sex) may be directed to the Institute’s Title IX coordinator, Sarah Rankin,Room W31-223, 617-324-7526, titleIX@mit.edu. Inquiries about the laws and about compliance may also be directed tothe US Department of Education, Office for Civil Rights, Region I, 5 Post Office Square, 8th Floor, Boston, MA 021093921, 617-289-0111, OCR.Boston@ed.gov.*The ROTC programs at MIT are operated under Department of Defense (DoD) policies and regulations, and do not comply fully with MIT’s policy ofnondiscrimination with regard to gender identity. MIT continu
MIT SLOAN MBA 2018-2019 EMPLOYMENT REPORT 5 1 Finance: Other includes Private Client Services and Wealth Management. 2 Other includes Information Technology. FUNCTION % MEDIAN MEAN LOW HIGH Consulting/Strategic Planning 38.5 147,000 139,186 50,000 185,000