Transcription
DUKE MBA EMPLOYMENT REPORT 2017 – 2018Duke University’s Fuqua School of Business is pleased to present the following employment information forits graduating Class of 2018 and intern Class of 2019. We hope you will find value in learning about the fulltime positions and summer internships accepted by our Daytime MBA students in 2017 – 2018 and thepremier organizations that hire them.If we can answer any questions or help you with your talent needs, please contact the Career ManagementCenter (CMC) at cmc-info@duke.edu or 1 (919) 660-7810.Top 20 employers this yearEmployerTotal Duke MBA Hiresfor 2017-2018Class of 2018(Full-Time)Class of 2019(Internships)Amazon.com362115McKinsey & Company341717Deloitte231310Microsoft Corporation20119Bain & Company1899PwC (PricewaterhouseCoopers LLP)1789Accenture LLP16124BCG (The Boston Consulting Group)1697Google, Inc.1578Bank of America Merrill Lynch1477Dell, Inc.1266J.P. Morgan11110Cisco Systems1055Nike1037IBM Corporation972Apple, Inc.862Credit Suisse844Deloitte & Touche LLP862Goldman Sachs844PepsiCo844Please see pages 14 – 16 for a complete list of employers hiring Duke MBAs in 2017 – 2018.1This report conforms to the MBA Career Services and Employer Alliance (MBACSEA) Standards for Reporting MBA Employment Statistics.Percentages are rounded to the nearest whole and may not total 100.
DUKE MBA EMPLOYMENT REPORT 2017 – 2018CLASS OF 2018 FULL-TIME EMPLOYMENT DATATiming offirst job offersBetween graduationand 3 months outBy erPercentWith permanent U.S. work authorization23922494%115%23598%Without permanent U.S. work authorization14411580%1712%13292%All graduates38333989%287%36796%Timing ofjob acceptancesBetween graduationand 3 months outBy erPercentWith permanent U.S. work authorization23921992%156%23498%Without permanent U.S. work authorization14410875%1813%12688%All graduates38332785%339%36094%On pages 2 – 6, you will see full-time compensation information for Class of 2018 graduates. This data isbased on acceptances by three months post-graduation, in U.S. dollar equivalents, and self-reported bystudents. To protect privacy, salaries are not reported when there are less than four usable data points, thenumber is less than one percent of the reporting population, or when all salaries in the category are equal.Annual base salaryReporting base salaryMeanMedianHigh95% 129,512 125,750 190,000 75,00011390% 124,657 125,000 180,000 50,00033593% 127,874 125,000 190,000 50,000MeanMedianHighNumberPercentWith permanent U.S. work authorization222Without permanent U.S. work authorizationAll graduates reporting salarySigning bonusReporting signing bonusLowLowNumberPercentWith permanent U.S. work authorization18182% 32,451 30,000 90,000 5,000Without permanent U.S. work authorization9483% 34,646 30,000 100,000 4,200All graduates reporting signing bonus27582% 33,202 30,000 100,000 4,2002This report conforms to the MBA Career Services and Employer Alliance (MBACSEA) Standards for Reporting MBA Employment Statistics.Percentages are rounded to the nearest whole and may not total 100.
DUKE MBA EMPLOYMENT REPORT 2017 – 2018GraduatesBy Job FunctionAnnual 5% 138,577 140,000 170,000 91,000Finance6820% 124,335 125,000 160,000 75,000Corporate Finance185% 122,500 120,000 155,000 105,000Investment Banking3811% 128,816 125,000 160,000 100,000Portfolio Management/Buyside Research1 1%Private Equity Analyst/Venture Capitalist52% 105,000 110,000 125,000 75,000Private Wealth Management21%Sales & Trading1 1%Other Finance31%7221% 121,192 125,000 180,000 73,125Business Development103% 121,700 117,500 175,000 100,000General/ General Management103% 117,000 118,500 180,000 78,000Internal Consulting/Corporate Strategy144% 121,872 125,000 150,000 90,000Project Management52% 126,000 127,000 130,000 120,000Other General Management165% 130,367 130,000 150,000 104,000Rotational/Leadership Dev. Program175% 113,613 120,000 130,000 73,125Human Resources21%Marketing6018% 121,161 117,000 163,000 50,000Brand Management144% 109,643 107,500 135,000 100,000General Marketing124% 118,292 115,000 130,000 114,000Other Marketing31%Product Development/Innovation41% 127,000 128,000 132,000 120,000Product Management237% 130,304 130,000 163,000 110,000Sales41%Operations / Supply Chain113% 121,818 120,000 135,000 105,000Other62% 125,075 121,000 190,000 88,450General ManagementPercentages based on the number of graduates who indicated job function when reporting accepted employment.3This report conforms to the MBA Career Services and Employer Alliance (MBACSEA) Standards for Reporting MBA Employment Statistics.Percentages are rounded to the nearest whole and may not total 100.
DUKE MBA EMPLOYMENT REPORT 2017 – 2018By IndustryGraduatesAnnual 2% 140,300 140,000 170,000 93,000Energy1 1%Healthcare21%Human Capital21%Strategy3811% 142,321 145,000 170,000 100,000Technology72% 139,833 140,000 147,000 135,000Other Consulting5917% 140,122 147,000 152,500 93,000185% 107,111 107,500 120,000 78,000Beverages / Food72% 107,143 105,000 120,000 100,000Other Consumer Goods113% 107,091 110,000 115,000 78,00041% 126,375 127,500 130,500 120,000Power Generation21%Oil / Gas21%5416% 124,767 125,000 180,000 50,000Financial Services4814% 124,607 125,000 160,000 50,000Private Equity/Venture Capital41%Other Finance21%Government21%Health309% 120,110 123,650 150,000 100,000Biotechnology31%Healthcare IT / Informatics1 1%Medical Devices31%Pharma72% 116,900 115,000 125,000 100,000Providers & Services82% 125,000 125,000 140,000 110,000Other Health82% 113,750 111,000 125,000 105,000Consumer GoodsEnergyFinance4This report conforms to the MBA Career Services and Employer Alliance (MBACSEA) Standards for Reporting MBA Employment Statistics.Percentages are rounded to the nearest whole and may not total 100.
DUKE MBA EMPLOYMENT REPORT 2017 – 2018GraduatesBy Industry (continued)NumberPercentInsurance21%Legal Services11%Manufacturing62%Real Estate21%Retail93%Social & Environmental Impact31%Economic/Community Development11%Education11%Other Social Impact11%94Equipment/Hardware/ NetworkingAnnual salaryMeanMedianHighLow 116,118 115,004 120,000 115,000 111,556 115,000 135,000 90,00028% 127,335 130,000 175,000 77,000154% 123,533 126,500 140,000 104,000Internet Services/ E-Commerce3911% 128,038 130,000 148,000 77,000Software & Applications288% 126,556 123,000 175,000 85,000Telecommunications72% 133,571 120,000 163,000 115,000Other Technology52% 129,250 130,000 132,000 125,000Transportation - Airlines41% 108,250 110,000 110,000 103,000Other1 1%TechnologyPercentages based on the number of graduates who indicated industry when reporting accepted employment.By Undergraduate MajorGraduatesAnnual salaryNumberPercentMeanMedianHighLowTechnical8624% 127,456 130,000 163,000 50,000Business11231% 124,797 125,000 175,000 75,000Other16245% 130,197 126,500 190,000 79,100Percentages based on the number of graduates who indicated undergraduate major when reporting accepted employment.5This report conforms to the MBA Career Services and Employer Alliance (MBACSEA) Standards for Reporting MBA Employment Statistics.Percentages are rounded to the nearest whole and may not total 100.
DUKE MBA EMPLOYMENT REPORT 2017 – 2018GraduatesBy World RegionAnnual salaryNumberPercentMeanMedianHighLowAsia103% 110,946 123,636 160,000 50,000Africa11%Latin America and the Caribbean124% 103,635 105,250 120,000 73,125Europe41% 118,250 124,750 130,500 93,00031392% 129,422 129,500 190,000 75,000North AmericaGraduatesBy North American RegionAnnual salaryNumberPercentMeanMedianHighLowU.S. Mid-Atlantic289% 127,168 125,000 152,500 88,450U.S. Midwest279% 126,860 120,000 170,000 100,000U.S. Northeast7725% 132,264 130,000 190,000 100,000U.S. South6420% 127,363 125,000 180,000 75,000U.S. Southwest227% 122,000 120,000 152,000 104,000U.S. West9330% 132,054 130,000 170,000 100,000Canada21%Percentages of both tables above based on the number of graduates who indicated geography when reporting accepted employment.GraduatesAnnual salaryBy Years of Prior ExperienceNumberPercentMeanMedianHighLowOne year or less21%More than 1 year, up to 3 years154% 132,733 130,000 152,500 100,000More than 3 years, up to 5 years13841% 128,002 125,000 170,000 75,000More than 5 years18655% 127,144 125,000 180,000 50,0006This report conforms to the MBA Career Services and Employer Alliance (MBACSEA) Standards for Reporting MBA Employment Statistics.Percentages are rounded to the nearest whole and may not total 100.
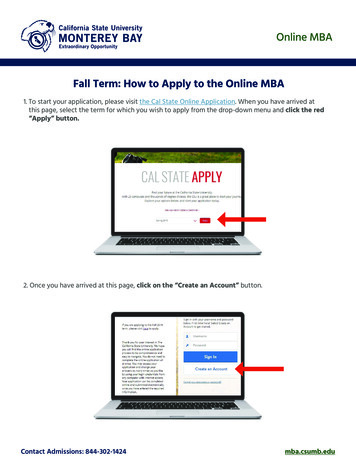
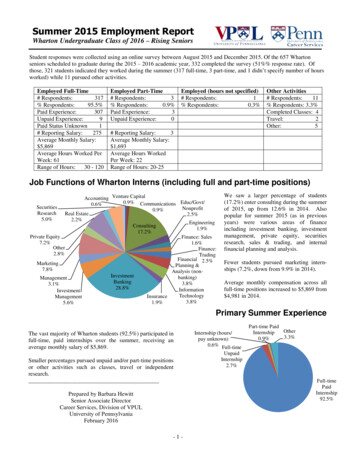
DUKE MBA EMPLOYMENT REPORT 2017 – 2018THREE-YEAR TRENDS: FULL-TIME POSITIONS% of graduating classBy ogy2017Health2016In an increasingly diverse MBA employment marketplace,our presence in key industries and job functions remains strong.% of graduating classBy Job Function4035302520151050ConsultingFinance2018Gen Mgmt2017Marketing20167This report conforms to the MBA Career Services and Employer Alliance (MBACSEA) Standards for Reporting MBA Employment Statistics.Percentages are rounded to the nearest whole and may not total 100.
DUKE MBA EMPLOYMENT REPORT 2017 – 2018Class of 2017 (Full-Time)Sources of employmentClass of 2018 %From a summer 2017 internship (full-time only) ¹7726%Scheduled interviews12943%18654%Job postings155%5315%Other Fuqua source or event258%4112%5117%6419%From a summer 2017 internship (full-time only) ¹155%Family, friends outside school62%123%Job posting83%226%Other source or event227%309%Total School-Facilitated ActivitiesTotal Graduate-Facilitated ActivitiesN/AN/APercentages based on the number of respondents who indicated job offer source when reporting accepted employment.¹ Differentiated by the original source of the internship, whether school- or graduate-facilitated.CLASS OF 2018 INTERNSHIP DATAOn pages 8 - 12, you will see monthly compensation information for Class of 2018 interns. This data is in U.S.dollar equivalents and self-reported by students. To protect privacy, salaries are not reported when there areless than four usable data points, the number is less than one percent of the reporting population, or whenall salaries in the category are equal.Reporting base salaryMonthly salaryMeanMedian98% 8,307 8,000 12,500 1,00011193% 7,580 8,000 14,200 40036896% 8,088 8,000 14,200 400NumberPercentWith permanent U.S. work authorization257Without permanent U.S. work authorizationAll interns reporting salaryHighLow20% of interns reported receiving a signing bonus with a mean of 4,361 and a median of 3,000.8This report conforms to the MBA Career Services and Employer Alliance (MBACSEA) Standards for Reporting MBA Employment Statistics.Percentages are rounded to the nearest whole and may not total 100.
DUKE MBA EMPLOYMENT REPORT 2017 – 2018InternsMonthly salaryBy Job 24% 9,769 11,000 14,200 1,200Finance10427% 8,688 10,000 12,500 400Corporate Finance308% 7,438 8,000 10,417 2,000Investment Banking4813% 10,272 10,416 12,500 4,600Portfolio Management/Buyside Research1 1%Private Equity Analyst/Venture Capitalist123% 4,598 5,200 8,333 400Private Wealth Management72% 9,838 10,416 10,417 7,000Research / Sellside1 1%Sales & Trading1 1%Other Finance41% 8,389 9,278 12,000 3,0007420% 7,247 7,614 12,000 1,200Business Development103% 6,848 7,614 9,425 2,800General - General Management31%Internal Consulting/Corporate Strategy287% 7,064 7,550 12,000 1,200Project Management51% 6,902 8,600 10,000 1,950Rotational/Leadership Dev. Program164% 8,387 8,200 10,417 7,385Other General Management123% 6,702 6,540 8,600 5,2006918% 6,646 6,860 9,000 1,000Brand Management226% 6,723 6,472 8,800 4,850General Marketing185% 6,494 7,396 8,600 1,000Product Management154% 7,100 7,400 9,000 4,000Sales51% 5,772 7,400 7,800 1,160Other Marketing92% 6,506 7,603 8,800 1,444Operations / Supply Chain205% 7,111 8,000 10,000 3,500Other133% 6,320 7,000 8,700 2,700General ManagementMarketingPercentages based on the number of interns who indicated job function when reporting accepted employment.9This report conforms to the MBA Career Services and Employer Alliance (MBACSEA) Standards for Reporting MBA Employment Statistics.Percentages are rounded to the nearest whole and may not total 100.
DUKE MBA EMPLOYMENT REPORT 2017 – 2018By IndustryInternsMonthly salaryNumberPercentMeanMedianHighLow7520% 10,313 11,250 14,200 2,500Healthcare41% 6,979 6,875 11,667 2,500Human Capital21%Strategy236% 10,754 11,200 14,200 2,600Technology51% 7,484 5,500 10,760 5,000Other Consulting4111% 10,702 11,500 12,500 2,800339% 6,705 6,500 10,000 1,000Beverages / Food123% 6,127 6,500 10,000 1,000Electronics1 1%Household / Personal31%Other Consumer Goods175% 6,895 6,400 9,833 4,00062% 7,631 7,767 8,556 6,480Energy Finance1 1%Oil / Gas1 1%Power Generation1 1%Renewables21%8121% 9,320 10,416 12,500 400Asset Management/Buyside62% 10,960 12,000 12,000 8,600Financial Services6417% 9,775 10,416 12,500 2,000Private Equity/Venture Capital82% 4,679 5,200 8,910 400Other Finance31%Government1 1%Health3610% 6,982 7,385 9,425 3,500Biotechnology62% 7,560 7,800 7,800 3,500Healthcare IT / Informatics2 1%Medical Devices51% 7,670 7,691 9,425 6,400Pharma82% 7,123 7,525 8,800 3,900Providers & Services123% 6,594 7,385 8,000 4,800Other Health31%ConsultingConsumer GoodsEnergyFinance10This report conforms to the MBA Career Services and Employer Alliance (MBACSEA) Standards for Reporting MBA Employment Statistics.Percentages are rounded to the nearest whole and may not total 100.
DUKE MBA EMPLOYMENT REPORT 2017 – 2018InternsBy Industry (continued)Monthly urism21%Insurance21%Manufacturing175% 7,323 7,430 10,800 4,000Automotive21%Other Manufacturing154% 7,491 7,750 10,800 4,000Media / Entertainment31%Real Estate51% 4,600 4,600 8,000 1,200Retail133% 6,303 6,462 8,650 4,000Social & Environmental Impact72% 4,648 5,000 7,000 1,200Foundations/Philanthropy1 1%Other Social Impact62% 4,589 5,167 7,000 1,200Sports51% 2,711 2,950 3,500 1,444Technology7921% 7,413 8,000 10,000 1,160Equipment/Hardware/ Networking92% 7,734 7,740 10,000 5,984Internet Services/ E-Commerce339% 7,946 8,000 8,500 5,600Software & Applications267% 6,926 8,300 9,000 1,160Telecommunications62% 6,680 7,000 7,040 5,600Other Technology51% 6,803 6,300 10,000 4,800Transportation - Airlines62% 7,305 7,615 7,900 5,200Other92% 7,694 8,800 11,000 2,880Percentages based on the number of interns who indicated industry when reporting accepted employment.By Undergraduate MajorInternsMonthly salaryNumberPercentMeanMedianHighLowTechnical8421% 8,370 8,500 14,200 400Business14236% 8,064 8,333 12,500 1,200Other16943% 7,933 8,000 12,500 1,000Percentages based on the number of interns who indicated undergraduate major when reporting accepted employment.11This report conforms to the MBA Career Services and Employer Alliance (MBACSEA) Standards for Reporting MBA Employment Statistics.Percentages are rounded to the nearest whole and may not total 100.
DUKE MBA EMPLOYMENT REPORT 2017 – 2018InternsMonthly salaryBy World RegionNumberPercentAfrica1 1%Asia14Latin America and the CaribbeanEuropeNorth AmericaMeanMedianHighLow4% 6,582 7,230 10,300 1,20072% 6,667 6,850 8,000 5,00021%35694% 8,205 8,000 14,200 400InternsBy North American RegionMonthly salaryNumberPercentMeanMedianHighLowU.S. Mid-Atlantic216% 7,834 8,000 12,500 2,700U.S. Midwest3711% 8,758 7,800 12,500 1,950U.S. Northeast9828% 8,643 10,000 12,500 2,000U.S. South8023% 8,406 8,283 12,500 1,160U.S. Southwest175% 8,591 8,000 14,200 3,100U.S. West9627% 7,546 8,000 12,250 1,000Percentages in both tables above based on the number of interns who indicated geography when reporting accepted employment.InternsMonthly salaryBy Years of Prior ExperienceNumberPercentMeanMedianHighLowMore than 1 year, up to 3 years205% 8,609 9,050 12,500 2,700More than 3 years, up to 5 years16243% 8,273 8,000 14,200 1,200More than 5 years19852% 7,881 8,000 12,500 40012This report conforms to the MBA Career Services and Employer Alliance (MBACSEA) Standards for Reporting MBA Employment Statistics.Percentages are rounded to the nearest whole and may not total 100.
DUKE MBA EMPLOYMENT REPORT 2017 – 2018Class of 2018 GraduatesWith permanentU.S. work authorizationWithout permanentU.S. work authorizationTotal MBA 4014438317400Company sponsored8081201220020Continuing education022000022Postponing job search202000202Starting a new business606000606Not seeking for other reasons000101101Total not seeking employment162181301329231No information available5386061131426022282163016342322445Seeking employmentNot seeking employmentTotal graduatesClass of 2019 InternsWith permanentU.S. work authorizationDaytimeJointTotalMBAdegreesSeeking employmentWithout permanentU.S. work authorizationDaytimeJointTotalMBAdegreesTotal MBA 641513428Company sponsored404101505Continuing education314101415Postponing job search000101101Starting a new business000000000Not seeking for other reasons000000000Total not seeking employment71830310111No information available10140450530714321123012343014444Not seeking employmentTotal students13This report conforms to the MBA Career Services and Employer Alliance (MBACSEA) Standards for Reporting MBA Employment Statistics.Percentages are rounded to the nearest whole and may not total 100.
DUKE MBA EMPLOYMENT REPORT 2017 – 2018Employers hiring at least one Duke MBA graduate or intern in 2017 - 2018@WalmartLabsBNP ParibasDeloitte Tohmatsu Consulting3MBoeing CompanyDelta Air LinesA.T. KearneyBooz & CompanyDeutsche BankABBBooz Allen HamiltonDimensional Fund AdvisorsAbbottBoston Scientific Asia PacificDiscover Financial ServicesAccenture LLPBoston Scientific CorporationDow Chemical Company, TheAdobe Systems Inc.Bridgewater Associates, Inc.DuPontAlixPartnersBridgewater Associates, LPE & J Gallo WineryAllstate Insurance Co.Brigham and Women's HospitalEli Lilly and CompanyAlpine Investors - PortfolioCompanyBristol-Myers SquibbEmerson ElectricBroadVail Capital PartnersEquinix, Inc.Cain Brothers & Company, LLCErnst & YoungCampbell Soup CompanyEvercoreCardinal HealthExelon CorporationCBREExxonMobil CorporationCencosud SAFacebookCentraFederal Bureau of InvestigationChevron CorporationFederal Energy RegulatoryCommissionAlvarez & MarsalAmazonAmbev BrazilAmerican AirlinesAmerican Express CompanyAmgen, Inc.Anheuser-Busch InBevApple, Inc.Applied MaterialsArconicAstraZenecaAT&TAthena's CompassBain & CompanyBank of America MerrillLynchBarclaysBayerCIGNA CorporationCisco SystemsCitiCitigroupClorox Company, TheCoca-Cola Company, TheCredit SuisseCtrip.com International Ltd.CVS HealthDanaher CorporationBCG (The Boston ConsultingGroup)DaVitaBDDell, Inc.Bill & Melinda GatesFoundation, TheDeloitteBimbo Bakeries USADeloitte & Touche LLPBlackArch PartnersDeloitte Corporate Finance LLCBlizzard EntertainmentDeloitte Services LPFederal Reserve Bank of NYFidelity InvestmentsFSGGartnerGEGenentechGeneral MillsGeneral Motors CompanyGlaxoSmithKline (GSK)Glenfarne GroupGlobal Focus - Wipro TechnologiesGoldman SachsGoogle, Inc.Harris Williams & Co.HD Supply14This report conforms to the MBA Career Services and Employer Alliance (MBACSEA) Standards for Reporting MBA Employment Statistics.Percentages are rounded to the nearest whole and may not total 100.
DUKE MBA EMPLOYMENT REPORT 2017 – 2018Hershey Company, ThePrudentialHinesLORD CorporationHoneywell International, Inc.Lowe's Companies, Inc.PwC(PricewaterhouseCoopersLLP)HubSpotM&T Bank CorporationQualtricsHuron Consulting GroupMacquarie CapitalRBC BankIBM CorporationMadison Square GardenCompany, TheRBC Capital MarketsInnovations in Healthcare (Former
DUKE MBA EMPLOYMENT REPORT 2017 – 2018 1 This report conforms to the MBA Career Services and Employer Alliance (MBACSEA) Standards for Reporting MBA Employment Statistics. Percentages are rounded to the nearest whole and may not total 100. Duke University’s Fuqua School of Business is pleased to present the following employment information for