Transcription
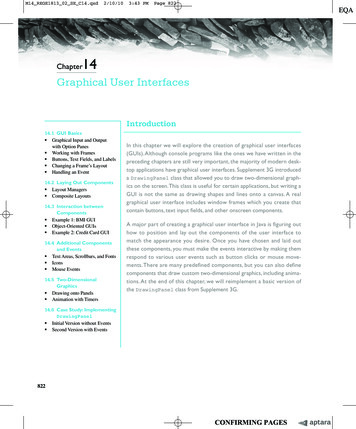
2014 ASHRAE/IBPSA-USABuilding Simulation ConferenceAtlanta, GASeptember 10-12, 2014A GRAPHICAL TOOL FOR CLOUD-BASED BUILDING ENERGY SIMULATIONDaniel L. Macumber1, Brian L. Ball1, and Nicholas L. Long11National Renewable Energy Laboratory, Golden, COABSTRACTBuilding energy modeling is a field that can becomputationally intensive, especially for largeparametric studies that require simulating manyalternate models. In the past, these types of studies havebeen limited to research institutions and advanced userswho had the required computational resources available.In recent years, cloud computing services have come tooffer a reliable platform in which relatively inexpensivecomputing power can be purchased and used as neededwithout a substantial capital investment. These servicesare gaining ground quickly because they are, for manycompanies, more cost effective than building andmaintaining computing power in-house. OpenStudiohas developed a workflow that allows energy modelersto create and run a customized parametric analysis usingcommercially available cloud computing services. Thisworkflow will enable anyone to perform powerfulparametric studies in a reasonable time for a relativelylow cost. This paper demonstrates the workflow in anautomated calibration application.INTRODUCTIONBuilding energy modeling tools span a wide range ofcomputational requirements. The most basic tools arespreadsheets that use very low order models of thebuilding to simulate energy use for specific equipmentor the whole building. More advanced whole-buildingsimulation tools attempt to take in information aboutthe entire building upon which they predict energy use.ASHRAE Standard 140 (ASHRAE 2011) provides amethod for validating whole building energy modelingtools. Of these validated tools, EnergyPlus, developedby DOE, is currently one of the most advanced(Crawley et al. 2005). However, with more capabilitycomes more computational requirements. Historically,this has meant that, in addition to assembling thecomplex set of necessary input data, using EnergyPlusto perform parametric studies required largecomputational resources not available to the averageenergy modeler.One approach to this problem in the past was forresearch institutions, with access to large computationalresources, to perform parametric studies and thenpublish the results in ways that average users couldaccess (ASHRAE), (Griffith et al. 2007), (DOE 2012),(Roth et al. 2012), (NREL 2013), (DOE 2013). Thisapproach is still valid and useful for many applications.However, a user’s building, modeling assumptions, anddesign considerations are never exactly the same as inthe pre-packaged parametric study. Also, some userswant to study how the results of an analysis mightchange for their specific building, their modelingassumptions, and their design considerations but lackthe framework and computational resources to do so.This is especially true when trying to use algorithms forautomated calibration of energy models as no twobuildings are operated identically.With thesecomputational resources now available, projects such asjEPlus (Zhang & Korolija 2010) and OpenStudio havebegun to address this need.The OpenStudio workflow for parametric studies isshown in Figure 1. In this workflow, a user is able tocreate an OpenStudio building energy model specific totheir project using a number of available frontends. Theuser is then able to search for and downloadOpenStudio measures (Hale et al. 2012) specific totheir needs from the Building Component Library(BCL) (Fleming et al. 2012). OpenStudio measures aresmall Ruby programs that take user inputs and thenmodify an OpenStudio model in a specific andreplicable way. If a suitable measure cannot be found,the user can write their own measure and test it using 2014 ASHRAE (www.ashrae.org). For personal use only. Reproduction, distribution, or transmissionin either print or digital form is not permitted without ASHRAE’s prior written permission.87
the OpenStudio Parametric Analysis Tool (PAT). Theuser can apply combinations of measures using theirown custom assumptions about price and performanceusing PAT and test that these measures work correctlywith their custom building model.analysis is running in the cloud, the user may monitorprogress and interact with results via a web interfacethat is embedded in the OpenStudio Server. The webinterface also allows the user to download individualmodels and results in various formats for furtheranalysis. The OpenStudio SDKs with which thespreadsheet interacts are all available as open sourceprojects. This allows software developers to perform allof these steps programatically to create customparametric building energy modeling applications.The remainder of this paper describes using thisworkflow to set up and run an automated energy modelcalibration to monthly measured utility data. In thisexample, the seed model was developed using thesimuwatt Energy Auditor software (Macumber et al.2014). This software allows an energy auditor toperform an energy audit of a commercial building usinga tablet based workflow. The tool generates an initialOpenStudio model based on the audit data which isthen calibrated to actual monthly utility data. However,any OpenStudio model could be used as the input. Inthis example, the measures will be selected for theirability to tune uncertain parameters of the model.However, measures used to model improved energyperformance could be chosen for an optimization study.Figure 1 OpenStudio Parametric WorkflowAfter the user is satisfied that the measures are workingcorrectly in PAT, they may choose to run additionaldesign alternatives on the cloud directly through thePAT interface (Hale et al. 2014). However, in this casethe user must construct all of the design alternatives tobe run by hand, which is tedious, time consuming, anderror-prone. As an alternative, the user may choose toexport the project to a spreadsheet format for a moreautomated, large-scale, cloud-based analysis. This pathis the focus of this paper. The spreadsheet allows theuser to specify detailed information about the analysisthat is not available in the PAT interface. Once thisspreadsheet is completed, the user is able to run a scriptthat parses the spreadsheet, starts cloud resources,uploads information, and begins the analysis. While theThe model used in this work was the same one used fora case study of a manual calibration process in (Hale etal. 2014). Ideally, the automated process should yieldcalibration parameters similiar to the carefullyconsidered manual process, but at a lower cost.However, certain parameters were tuned by hand usinggraphical user interfaces instead of measures during themanual calibration. As reported in (Hale et al. 2014)the parameters that were manually changed were toadjust lighting and equipment schedules, hard size fans,and implement supply air temperature reset. Measurescould have been written to achieve these same modelchanges. However, five parameters could already bemanipulated by measures and only 12 monthly electricdata points. To avoid overfitting, we used only themeasures that were already available and did notconsider parameters that were previously manipulatedby hand, resulting in a more automated process.SEED MODELThe building considered in this study is a 7,560-m2(81,400-ft2) office building at Tyndall Air Force Base inPanama City, FL. The building is all electric and uses achilled water variable air volume system with electricreheat for space conditioning. The occupancy is 2014 ASHRAE (www.ashrae.org). For personal use only. Reproduction, distribution, or transmissionin either print or digital form is not permitted without ASHRAE’s prior written permission.88
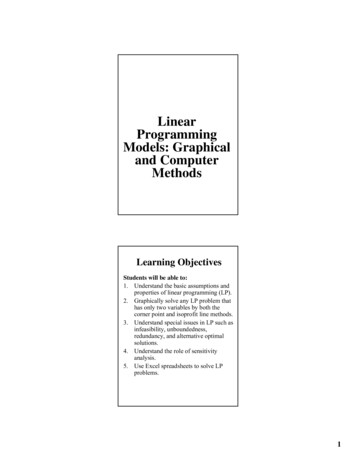
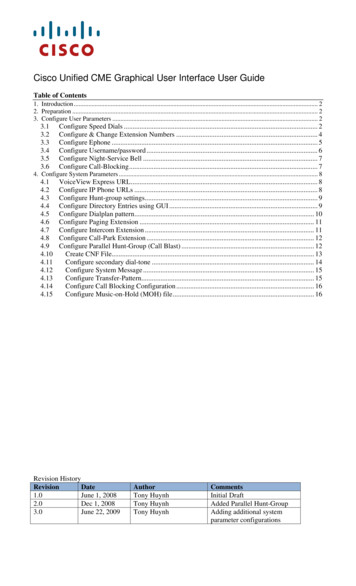
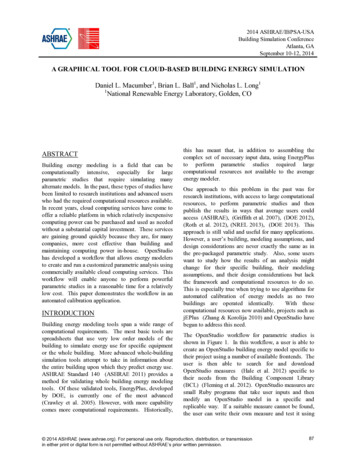
primarily office space with small areas that include acourtroom, restrooms, conference rooms, a health clinic,and mechanical space. The building was constructed in1988, and since has had many space use changes, aswell as several wall demolition/construction projectsthat did not include HVAC redesign. The building hasnot been commissioned recently, and occupantscomplained of hot and cold spots.An initial OpenStudio model was developed using thesimuwatt Energy Auditor software tool (Macumber2014).This model is shown rendered in theOpenStudio SketchUp plug-in in Figure 2.Asdescribed in (Guglielmetti et al. 2011), the OpenStudioSketchUp plug-in can be used to visualize and developgeometry for building energy modeling.Figure 2 Initial Building Model GeometryAs described in (Weaver et al. 2012) details aboutschedules, constructions, HVAC, and other energymodeling content can be modified using the OpenStudioapplication. An HVAC system belonging to the initialOpenStudio model is shown as rendered by theOpenStudio application in Figure 3.Figure 3 Initial Building Model HVACThe simuwatt Energy Auditor tool allows for entry ofactual monthly energy use.This information isautomatically added to the initial OpenStudio energymodel. When the energy model is simulated usingEnergyPlus in the OpenStudio application, a calibrationreport comparing the modeled energy use with actualenergy use is automatically created, shown in Figure 4.Figure 4 Initial Model Calibration ReportThis calibration report computes the normalized meanbias error (NMBE) and the coefficient of variation ofthe root mean squared error CV(RMSE) between themodel and actual energy use. These metrics arecompared to the ASHRAE Guideline 14 (ASHRAE2002) requirements that NMBE must be 5% and theCV(RSME) must be 15%. As shown in Figure 4,NMBE of the initial model was -66.89% andCV(RMSE) was 64.90%. As these metrics are outsidethe acceptable limits in ASHRAE Guideline 14,uncertain model parameters must be tuned until themodeled energy use better matches actual data.USING MEASURES WITH PATAfter importing the initial OpenStudio model into PAT,the first step in the calibration process is to identifyuncertain parameters of the initial model. Because anon-site audit of the building was conducted, lightingand equipment counts, HVAC system types, andconstructions are well known.However, otherparameters such as infiltration, operational schedules,and actual system efficiencies are not known withcertainty. As shown in Figure 5, PAT allows the user tosearch for measures on the BCL, which vary theseuncertain parameters to improve model predictions. Asnoted in (Hale et al. 2014), good engineering judgementmust be used when selecting the measures andcalibration parameters to use for any given building.In this example, suitable measures for varying uncertainparameters were already available from the previousmanual calibration work (Hale et al. 2014). Althoughother calibration parameters of interest, such asinfiltration rates, are available as measures on the BCL,this work was restricted to the measures from theprevious manual calibration in order to compare the 2014 ASHRAE (www.ashrae.org). For personal use only. Reproduction, distribution, or transmissionin either print or digital form is not permitted without ASHRAE’s prior written permission.89
manual to the automated calibration process. Theexisting measures were added to the measure library inPAT and then dragged into the simulation workflow,shown in Figure 6.Figure 7 Simulation Details in PATFigure 5 Online BCL InterfaceFigure 6 Configuring Measure Parameters in PATClicking on a measure allows the user to enter customvalues for the measure’s arguments. Multiple instancesof the same measure may be configured with differentinput values for testing the measure across a range ofinputs. It is important to test each measure at thenominal and extreme values of the variable space. Ifeach measure is found to work correctly for thesevalues, the user may assume that simulations will runcleanly on a high percentage of the interior of thevariable space.After individual measures are configured, designalternatives can be constructed by applying differentcombinations of measures to the input model. Eachdesign alternative is then simulated. Each measure mayissue errors, warnings, and informational messageswhich are shown directly in the PAT user interface asshown in Figure 7. Each resulting OpenStudio modeland detailed results may also be inspected using theOpenStudio graphical user interfaces to ensure that themeasures were applied correctly.The followingparameters, with initial model value, were investigatedover the ranges shown in Table 1.Table 1 Parameter RangesPARAMETERGround temperature ( C)Cooling set point ( C)Reduce lighting power (%)Reduce equipment power (%)Fan static pressure (in. 6.240.040.04.0Testing measures with PAT in this manner is importantbefore initiating large cloud analyses to avoid spendingmoney on cloud resources, only to find bad simulationresults because of erroneous measures or measurearguments. Once all the measures are tested with anexpected range of input arguments locally, the user canbe more confident that cloud-based simulations willprovide high-value results. Once PAT has been used inthis manner, the user can quickly export the project to aspreadsheet format better suited to describe a range oflarge-scale simulations to be performed in the cloud.PROBLEM DEFINITIONThe analysis capabilities of the OpenStudio platform arefar more extensive than what can be quickly exposed ina polished user interface. One expedient method for 2014 ASHRAE (www.ashrae.org). For personal use only. Reproduction, distribution, or transmissionin either print or digital form is not permitted without ASHRAE’s prior written permission.90
exposing the full functionality is to use a spreadsheetinput format in conjunction with scripts that leveragethe OpenStudio Ruby bindings. The spreadsheetinterface allows the user to enter the requiredinformation using familiar tools while allowing theinterface to be updated easily as new features are addedor refined. At the time of writing, an examplespreads
compared to the ASHRAE Guideline 14 (ASHRAE 2002) requirements that NMBE must be 5% and the CV(RSME) must be 15%. As shown in . Figure 4, NMBE of the initial model was -66.89% and CV(RMSE) was 64.90%. As these metrics are outside the acceptable limits in ASHRAE Guideline 14, uncertain model parameters must be tuned until the modeled energy use better matches actual data.