Transcription
ORIGINAL RESEARCH ARTICLEMetallurgical and Statistical Approaches to the Studyof Cast Iron Street FurnitureC. SOFFRITTI, L. CALZOLARI, S. PEPI, A. FORTINI, M. MERLIN,and G.L. GARAGNANIThe evolution of microstructure in relation to dating and nationality of origin was investigatedin twenty-four cast iron objects of street furniture produced between XIX and XX centuries inUnited Kingdom, France, and Italy. Chemical composition of the metalworks was evaluated byglow-discharge optical emission spectrometry. Fragments from the cast irons were analyzed byoptical microscopy and scanning electron microscopy with energy-dispersive spectroscopy.Form, distribution, and size of graphite were evaluated in the microstructure according tostandard EN ISO 945-1:2008. An image analysis software was employed to quantify the areafraction of graphite in the matrix, major axis, and shape factor of graphite lamellae, areafraction of manganese sulfides (wS), area fraction of steadite, and number of eutectic cells perarea unit. All data were grouped and linear discrimination analysis (LDA) was applied to assessthe group assignment and the probability of correct classification for each metalwork. Theresults showed that the microstructural features were compatible with those of cast ironsproduced in the XIX and XX centuries. Values of wS also suggested re-melting of cast irons,associated with recycling of cast iron and/or steel scraps. The high values of steadite found in themetalworks are probably due to the excellent castability required for complex shape castings inthese centuries. The LDA multivariate analysis allowed to discriminate cast irons based on theyear of manufacturing and the nationality of origin.https://doi.org/10.1007/s11661-021-06135-6 The Author(s) 2021I.INTRODUCTIONTHE prefect of the Seine Department of France from1853 to 1870, George Eugène Haussman, first definedstreet furniture as ‘‘the whole series of objects oraccessories which, installed in public and/or privatespaces, provide functional services for the society.’’ Inthose years, new elements were introduced in themodern cities to satisfy the requirements of safety,hygiene, comfort, and entertainment of the nascentbourgeoisie.[1,2] Street furniture included commonobjects in urban settlements such as street lamps,benches, balconies, grids, fountains, and gazebos; theseelements were purposely created to improve the qualityof life in the urban environments, evolving according tonecessities along years and representing an essential partof the cities. The term ‘‘street furniture’’ also referred toC. SOFFRITTI, L. CALZOLARI, A. FORTINI, M. MERLIN,and G.L. GARAGNANI are with the Department of Engineering,University of Ferrara, Via Saragat 1, 44122 Ferrara, Italy Contacte-mail: chiara.soffritti@unife.it S. PEPI is with the Department ofPhysics and Earth Sciences, University of Ferrara, Via Saragat 1,44121 Ferrara, Italy.Manuscript submitted July 17, 2020; accepted December 14, ICAL AND MATERIALS TRANSACTIONS Athe connection between the public space and private life,for example, a railing or a balustrade that delimited theprivate space of a balcony both reflected the taste of thehouse owner and acted as decor for the city in whichthey were placed.[1]The massive diffusion in urban settlements of streetfurniture composed of cast iron alloys was connected tothe First Industrial Revolution (1760 to 1840) and to thehistory of iron and steel industry. However, up to thesecond half of the XVIII century wrought iron waspreferred for ornamental manufacturing, whereas castiron was employed for structural components.[3] Afterthe collapse of some cast iron structures, such as theGray’s Mill building in Manchester (United Kingdom),the trussed bridge over the river Dee, and the Woottonand Tay bridges, wrought iron was increasingly used forload-bearing applications. However, cast iron alloyscontinued to be employed for structural elements undercompressive loads and non-structural applicationsincluding street furniture. The good castability andsuitability to the production of numerous identicalobjects in a short time and on an industrial scalefavored the use of cast iron alloys for street furniture.Nevertheless, wrought and cast iron continued to beused together, to complement the tensile capabilities ofVOLUME 52A, MARCH 2021—1127
wrought iron and the compressive and decorativeadvantages of cast iron.[4]Despite the constant presence in urban spaces of streetfurniture composed of cast iron alloys, its functionalaspects have been almost always considered prevalentagainst artistic and historical values, therefore streetfurniture has been hardly associated with cultural heritage.[4] Accordingly, many historical objects for streetfurniture have been lost because they were consideredobsolete and therefore replaced or re-melted.[5]Few studies have been published about cast iron streetfurniture. Recently, the authors provided an overview ofhistory of cast iron street furniture, focusing on thereasons behind the choice of cast iron alloys for streetfurniture in connection to the diffusion of cast ironduring the First Industrial Revolution. The relationshipbetween cast iron street furniture and cultural heritagewas also analyzed, together with its development in thethree main producing countries (United Kingdom,France, and Italy). The production technique and theimportance of preservation of cultural heritage relatedto cast iron street furniture were also discussed.[6] Inanother study, the authors determined the state ofconservation of three artifacts of historical cast ironstreet furniture by scanning electron microscopy withenergy-dispersive spectroscopy (SEM/EDS), diffusereflectance infrared Fourier transform (DRIFT) andl-Raman spectroscopies, and electrochemical impedance spectroscopy (EIS).[7] In a previous study on thistopic, the authors evaluated the protectiveness ofancient paints on historical street lamps made of castiron alloys by X-ray diffractometry (XRD) and SEM/EDS, DRIFT, and EIS techniques.[8]In this study, twenty-four cast iron metalworks ofstreet furniture dating back to XIX and XX centurieswere investigated to determine the evolution ofmicrostructure in relation with dating and nationalityof the foundry of origin. Twenty-one came fromfoundries located in United Kingdom, France, andItaly, and three whose origin was not reported. Thechemical composition of the objects was evaluated byglow-discharge optical emission spectrometry. An extensive metallographic analysis was performed to quantifythe parameters associated to graphite and matrixmorphology and to other microstructural features ofcast iron alloys. All data were grouped and themultivariate statistical technique linear discriminationanalysis (LDA) was applied to assess the group assignment and to provide the probability of correct classification for each sample.II.METALLURGICAL BACKGROUNDOF THE STUDYThe term ‘‘cast iron alloys’’ identifies a large family offerrous alloys with a carbon content greater than2.0 pct.[9] The Chinese were the first people whointentionally used cast iron alloys during the WarringStates period (475 to 221 B.C.) and more extensively inthe Han Dynasty (206 B.C. to 220 A.D.). The earliestcast iron object is a lion produced in China and dating1128—VOLUME 52A, MARCH 2021from 502 B.C. In pre-Roman and Roman periods of theEuropean Iron Age (800 B.C. to 400 A.D.), the fewobjects made of cast iron alloys were imported from FarEast; three examples are the fragments of a cauldronfound in Nikolayevka (Ukraine) and dating around theIV to III century B.C., a fragment of a vessel found inthe Roman Fort at Caerhun in North Wales (UnitedKingdom) and dating around 80 to 110 B.C., and thefragments of a cauldron found at Corby Glen (UnitedKingdom) and dating from the period following theRoman conquest of Britain in 43 B.C.[10]The introduction of cast iron in Europe occurredaround 1200 to 1450 A.D. Before this time, ironmakingwas largely a rural and small-scale craft and most ironwas produced by the bloomery process, involving thechemical reduction of red-hot wood charcoal, fluxes,and iron ores in a bloomery to obtain a spongy mass ofmetal intermixed with a semiliquid slag.[4] In the XIIIcentury, the blast furnace technique was imported fromChina to produce cast iron alloys for military purposes,since wrought iron was not efficient to build weapons.[10]Blast furnace was larger and allowed higher woodcharcoal/iron ores ratio than the bloomery. It was fed byair forced through water-powered bellows. The partiallymolten metal was run into sand molds at temperaturesas high as 1450 C, producing billets of cast iron, called‘‘pigs.’’ Before it could be used by the blacksmiths, thepigs were placed into a furnace called a ‘‘finery’’ tooxidize carbon and other impurities; the products werethen forged into long rods.[6] Starting from the XVIIcentury some resourceful British ironmasters attemptedto improve the smelting procedure of cast iron alloys. In1619, Jan Andries Moerbeck fueled the blast furnace byfluxes as limestone and iron ores (for example,hematite).[4] In 1709, Abraham Darby fueled the blastfurnaces in Coalbrookdale by coke instead of woodcharcoal, supporting larger charges of iron ores andlimestone, and obtaining cast iron products with a lowerpercentage of sulfur.[11] Around 1720, the introductionin France of a new device, named cupola furnace,improved the process of the blast furnace. This deviceallowed secondary smelting to be poured on a large scaleinto complex castings for structural and decorativeelements, such as columns, bridges, railings, and knockers.[4] In 1784, Henry Cort invented the reverberatoryfurnace in which iron ores were completed separatedfrom fuel and the impurities removed from the moltenmetal by ‘‘puddling.’’[4] In 1776, John Wilkinson developed a steam-powered blower for blast furnaces, so thatstructural elements such as tie rods, angle irons, and teescould be produced on industrial scale. In 1863, UnitedKingdom became the largest producer of cast andwrought iron in Europe, followed by France.[4] At thattime and until the end of the XIX century, Italyimported foreign workers and materials, limiting itscast iron production to duplicates of foreign designs.[1]Historically, two main types of cast iron alloys wereknown, based on the appearance of their fracturesurfaces: gray and white. The first one fractures alongthe graphite plates, with a matted and ductile fracturesurface, whereas the second one fractures along the ironcarbide (cementite), with a shiny and brittle fractureMETALLURGICAL AND MATERIALS TRANSACTIONS A
surface.[9] White cast iron may also be softened byadding iron ores or hammer slags and exposing themixture to high temperature for some days. Throughthis heat treatment, the brittle structure of this materialis converted into the malleable form consisting ofroughly spherical agglomerates of graphite in a ferriticor pearlitic matrix.[12] Although malleable iron wasknown since IV century B.C., this technique was firstmentioned in an English patent dated 1670.[13] In 1896,the first paper discussing the physical properties of castiron was published, including strength, deflection, hardness, grain, set, chill, and shrinkage. It also emphasizedits low tensile strength in comparison to compressionstrength, due to the tendency to develop defects duringthe process of casting.[14] Between 1938 and 1949 CarlAdey, Henton Morrogh and Keith Millis inventedductile cast iron by adding magnesium and cerium: thistype of cast iron exhibited a higher ductility in theas-cast form.[15] A lighter type of cast iron, compactedgraphite iron, was patented in 1965.[16]Concerning the chemical composition of cast ironalloys, the most common alloying elements are carbon,silicon, manganese, sulfur, and phosphorous. Theamount of carbon varies significantly depending on thegrade of pig iron and scraps used, but generally it rangesfrom 2.0 to 4.3 pct.[9] When a percentage of siliconbetween 0.5 and 3.0 pct is added, the formation ofgraphite instead of cementite is promoted during solidification.[17] When the percentage of silicon is over3.0 pct, strength, hardness, hardenability, wear, andcorrosion resistance of cast iron alloys are increased.[9]Manganese is added to neutralize the effects of sulfur, adetrimental element when present, since sulfur forms alow-melting phase (iron sulfide, FeS) and prevents thenucleation of graphite. It is universally accepted that themanganese concentration should be in excess of thestoichiometric ratio (Mn:S 1.7:1) to favor theformation of manganese sulfide (MnS) instead of ironsulfide.[18] Some authors also suggested a Mn:S ratio2:7.[19] Concerning phosphorous, its solubility in austenite decreases with increasing carbon percentage, thusphosphorous segregates into the melt during solidification of cast iron.[20] For casting in sand molds and in theabsence of carbide-forming elements such as chromiumand vanadium, phosphorous forms a eutectic phosphide(steadite). Steadite is a eutectic of ferrite and ironphosphide (Fe3P), containing 10.2 pct phosphorous and89.8 pct iron.[21] When the percentage of phosphorous islower than 0.005 pct, steadite particles become visible atroom temperature in areas where solidification occurslast, whereas when this element is higher than 0.2 pctseparate particles of steadite solidify as concave triangular constituents.[22] Finally, when the percentage ofphosphorous is higher than 0.4 pct, cellular networks ofsteadite surround eutectic cells and dendrites.[23]III.MATERIALS AND METHODSTwenty-four cast iron artifacts of street furnituredating back to the XIX and XX centuries wereconferred to Department of Engineering of theMETALLURGICAL AND MATERIALS TRANSACTIONS AUniversity of Ferrara (Ferrara, Italy) by theNeri Foundation – The Italian Museum of Cast Iron(Longiano, Forlı̀-Cesena, Italy). Twenty-one artifactscame from foundries located in United Kingdom,France, and Italy, and three were of unreported origin.The cast iron objects were parts of street lamps replacedby identical copies during restoration, and two of themwere part of a greenhouse and a bench, respectively. Forcomparison, five artifacts belonging to modern streetlamps in cast iron were also investigated. A summary ofthe analyzed cast iron parts is reported in Table I,together with information on identification number,year of manufacturing, nationality of the foundry oforigin, and a short description of the street furniturefrom which they were collected.The chemical composition of CI parts was evaluatedby glow-discharge optical emission spectrometry(GDOES). The instrument was a SPECTRUMA GDA650 (SPECTRO Analytical Instruments, Kleve, Germany) spectrometer with a Grimm-style glow-dischargelamp in direct current mode. Discharge conditions were700 V voltage, 20 mA current, and sputtering time of150 s. The internal diameter of the tubular anode (hencethe analyzed area in each measurement) was 2.5 mm.The Grimm-type atomization/excitation source wasevacuated by a rotary pump to a final pressure of 0.05hPa. After evacuation, flowing argon as a working gas(99.995 pct purity) was introduced to a constant pressure of 3.35 hPa.The microstructural characterization was performedon representative fragments obtained from the cross-section (sample observed across the thickness of the metal).The fragments were embedded in mounting resin,polished and analyzed by a Leica MEF4M opticalmicroscope (Leica, Wetzlar, Germany) to determineform, distribution, and size of graphite, in accordancewith the standard EN ISO 945-1:2008.[24] Themicrostructure was analyzed after chemical etching withNital 4 (4 pct nitric acid HNO3 in ethanol) by the sameoptical microscope and by a Zeiss EVO MA 15 (Zeiss,Oberkochen, Germany) scanning electron microscope(SEM), equipped with an Oxford X-Max 50 (OxfordInstruments, Abingdon-on-Thames, United Kingdom)energy-dispersive microprobe for semi-quantitativeanalyses (EDS).The micrographs of the center parts of cross-sectionswere processed by Leica Application Suite (LAS, Leica)image analysis software to quantify the followingmicrostructural features: area fraction of graphite (wG)in the matrix, major axis of graphite lamellae (MA) (i.e.,the lamellae length), shape factor of graphite lamellae(SF), area fraction of manganese sulfides (wS), areafraction of steadite (EP), and number of eutectic cellsper area unit (EC). The evaluation of area fraction ofgraphite, major axis, and shape factor of graphitelamellae was conducted on five unetched micrographsper microstructure, with about 400 to 600 lamellae permicrograph (area: 0.33 x 0.45 mm2). To determine wG,the area of the single graphite lamella in each micrograph was calculated by the LAS software; these areaswere added up and divided by the field area of themicrograph to obtain the area fraction of graphite in theVOLUME 52A, MARCH 2021—1129
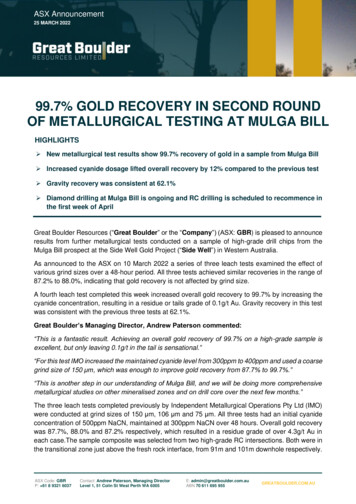
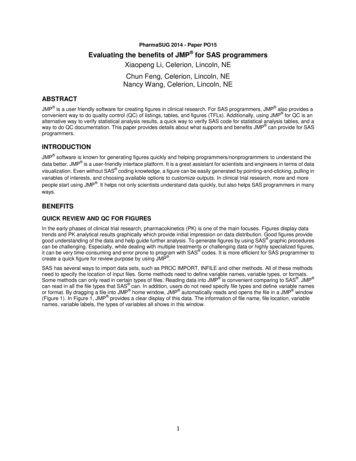
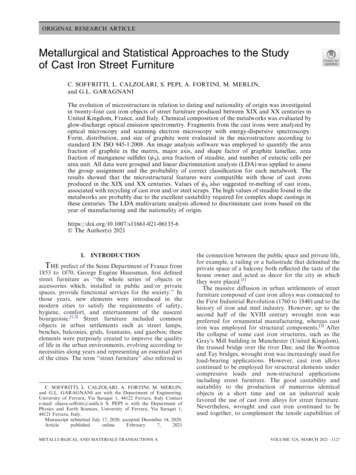
matrix. Five values of wG per microstructure werequantified. Concerning the major axis of graphitelamellae, this parameter is defined as the greatestdistance (measured by the LAS software) betweenparallel lines drawn through two points at the edges ofthe graphite lamellae, regardless of orientation. Thisdistance is also called maximum feret (Fmax). The shapeof graphite lamellae was expressed in the form of anumeric value through the shape factor, defined as SF (16A2)/(pPF3max), where A is the surface area and P isthe perimeter of the graphite lamella (calculated by theLAS software). The shape factor ranges from 0 for a lineto 1 for a perfect circle.[25,26] About 400 to 600 values ofMA and SF per micrograph were quantified, for a totalof five micrographs per microstructure.The area fraction of manganese sulfides was determined on ten unetched micrographs per microstructure,with about 5 to 8 particles per micrograph (area: 0.13 x0.18 mm2). The area fraction of steadite was evaluatedaccording to a previously published method,[20] aftercolor etching with Murakami reagent (10 g potassiumferricyanide K3Fe(CN)6, 10 g potassium hydroxideKOH, 75 ml distilled water). The typical microstructurerevealed by color etching using Murakami reagent isshown in Figure 1(a), in which a light-brown cellularnetwork of steadite is visible, surrounding dendrites. Atotal of fifteen micrographs (area of each micrograph:0.33 x 0.45 mm2) were analyzed for each fragment.Measurements of the area fractions of manganesesulfides and steadite were conducted following the sameprocedure used for the area fraction of graphite in thematrix (calculated by the LAS software), thus fifteenvalues of wS and EP per microstructure were quantified.The number of eutectic cells per area unit is an indexof the nucleation susceptibility of graphite.[9] It wasdetermined after color etching with sodium picratereagent (2 g picric acid C6H3N3O7, 25 g sodiumhydroxide NaOH, 100 ml water[27]). When exposed tothe polarized light of the optical microscope after coloretching using sodium picrate reagent, the eutectic cellboundaries exhibited an approximately circular shapeand a blue appearance as a result of entrapment ofimpurities, such as phosphorous and sulfur, at theinterface (Figure 1(b)). Measurements of the number ofeutectic cells per area unit were carried out at lowmagnification (95) in accordance to a previously published method.[28] Based on this method, the number ofeutectic cells per area unit is defined as EC (Ni 0.5Nw 1)/F, where Ni is the number of eutectic cellsinside the rectangle S, Nw is the number of eutectic cellsthat intersect the sides of S, but not their corners, and Fis the surface area of S. A total of fifteen images (area ofeach image: 6.33 x 3.35 mm2) were analyzed for eachfragment. Six micrographs were merged to generate eachimage processed by the image analysis software. Fifteenvalues of EC per microstructure were quantified.All data were grouped according to two classifications, the first one based on dating (second half XIXcentury, early XX century, and XXI century) and thesecond one on the nationality of the foundry of origin(United Kingdom, France, Italy, and unreported). Toverify the differences among group means in all data, the1130—VOLUME 52A, MARCH 2021Kruskal–Wallis non-parametric test (with post hocDunn’s test) was employed. Linear discriminant analysis(LDA) was chosen as the most appropriate multivariatestatistical technique for the interpretation of all data. InLDA, the user must assign group classifications to thedata sets and the differences among these predeterminedgroups describe combinations of variables.[29] StepwiseLDA was applied to variables by a Wilk’s Lambda test(p value 0.01) and an F-statistic factor.[29] Thevariables were tested by cross validation randomlychoosing 3 samples out of 31 as outgroup and applyingdiscriminant analysis. This analysis assesses the groupassignment and uses the generated discriminant modelto reclassify the data, providing the probability ofcorrect classification for each sample. The high percentage of cross validation in our samples supported asuccessful discrimination among groups. All data analyses were carried out by means of the software XLSTAT(Version 2015.5.02, Addinsoft, Paris, France).IV.RESULTS AND DISCUSSIONThe chemical composition of alloys (measured byGDOES) in the examined CI parts is reported inTable II.Based on the results, the artifacts consisted of Fe-Calloys in which the amount of carbon ranged from 2.9 to3.6 pct; accordingly, they could be considered ashypoeutectic cast irons. In all metalworks, the percentage of silicon was between 1.6 and 3.0 pct. As previouslymentioned, its addition in these concentrations was ableto promote the nucleation of graphite during solidification.[17] The minimum and maximum contents ofmanganese were 0.3 and 1.1 pct, respectively, whereasthe amount of sulfur ranged from 0.04 to 0.18 pct. Forthe cast iron alloys dating to the second half of XIXcentury and for those dating to the early XX century,the percentage of phosphorous was between 0.42 and1.12 pct. All phosphorous values were also higher than0.4 pct, which was indicated in Section II. as the lowerlimit for the formation of cellular networks of steaditesurrounding eutectic cells and dendrites. Conversely,metalworks dating to the early XXI century showedvery low concentrations of this element (from 0.03 to0.22 pct).According to the standard EN ISO 945-1:2008, allcast irons could be classified as gray cast irons. Lamellar(flake) graphite with sharp ends (graphite form I) wasobserved in all fragments with the exception of CI 1, inwhich also aggregates of graphite flakes (graphite formII) were detected. Among cast irons, 52 pct werecomposed of lamellar graphite of Type B (rosettegrouping with random orientation), 24 pct of lamellargraphite of Type C (aggregate of larger graphite flakessurrounded by smaller, randomly oriented graphiteflakes), 14 pct of lamellar graphite of Type A (apparently uniform distribution), and 10 pct of lamellargraphite of Type D (fine, randomly oriented graphiteflakes in the interdendritic position) (Figure 2(a)). Itshould be pointed out that in the cast irons CI 8,CI 8 1, CI 12, CI 14, CI 18, and CI 28 the lamellarMETALLURGICAL AND MATERIALS TRANSACTIONS A
Table I. Summary of Analyzed Cast Iron (CI) Parts, Reporting Their Identification Number, the Year/Years of Manufacturing,the Nationality of the Foundry of Origin, and a Short Description of the Street Furniture from which they Were CollectedIdentification NumberCI 1CI 2CI 3CI 4CI 5CI 6CI 7CI 8*CI 8 1*CI 9CI 10CI 11CI 12CI 13CI 14CI 15CI 16CI 17CI 18CI 19CI 20**CI 20 1**CI 21CI 22CI 23CI 24CI 25CI 26CI 27CI 28CI 29Year/Years of ManufacturingNationality184618701870 to 18801850 to lyItalyItalyItaly1880 to 189018901890 to 19001896190019101910 to scriptionwindow of greenhousecolumn of street lampbase of street lampcolumn of street lampcolumn of street lampcolumn of street lampcolumn of street lampbase of street lampbase of street lampcolumn of street lampbase of street lamptop of street lampbase of street lampcolumn of street lampcolumn of street lampbracket of street lampbracket of street lampbase of street lampdecoration of street lampbase of street lampbase of street lampbase of street lampbase of street lampleg of benchtop of street lampbase of street lampdecoration of street lampdecoration of street lampdecoration of street lampcolumn of street lampcolumn of street lampn.r. not reported.*The objects named CI 8 and CI 8 1 were part of the same street lamp.**The objects named CI 20 and CI 20 1 were part of the same street lamp.Fig. 1—Optical micrographs showing the typical microstructures revealed by color etching with (a) Murakami and (b) sodium picrate reagents.graphite of Type B was detected in association with apercentage of the lamellar graphite of Type D lowerthan 10 pct. Concerning the size of graphite lamellae,METALLURGICAL AND MATERIALS TRANSACTIONS A3 pct of cast irons contained lamellae lengths between0.50 and less than 1.00 mm (size 2), 15 pct between 0.25and less than 0.50 mm (size 3), 42 pct between 0.12 andVOLUME 52A, MARCH 2021—1131
less than 0.25 mm (size 4), 34 pct between 0.06 and lessthan 0.12 mm (size 5), 3 pct between 0.03 and less than0.06 mm (size 6), and 3 pct less than 0.015 mm (size 8)(Figure 2(b)). It is known that form, distribution, andsize of graphite depend on cooling rates, degree ofundercooling, cast impurities and additives, inoculation,and overheating of the molten liquid.[9] For the cast ironsamples examined, no data were available about theirTable II. Chemical Composition of Alloys (Measured byGDOES, Weight pct) in the Examined CI PartsCI PartCSiMnPSFeOthersCI 1CI 2CI 3CI 4CI 5CI 6CI 7CI 8CI 8 1CI 9CI 10CI 11CI 12CI 13CI 14CI 15CI 16CI 17CI 18CI 19CI 20CI 20 1CI 21CI 22CI 23CI 24CI 25CI 26CI 27CI 28CI alancebalancebalanceEach Artifact was Measured in Triplicate.manufacturing techniques. However, the lamellar graphite of Type B is typical of alloys solidified withintermediate degrees of undercooling, except when it isassociated with a lamellar graphite of Type D: a mixeddistribution of lamellar graphite is typical of castingssolidified with higher degrees of undercooling.[9,24] Thelamellar graphite of Type C appears frequently inthin-walled castings, whereas the lamellar graphite ofType A suggests a low-to-intermediate degree of undercooling and a sufficient inoculation treatment.[9] Examples of graphite lamellae distributions of Type A-Dobserved in cross-sections of the analyzed fragments areshown in Figures 3(a) through (d).Microstructures observed in the cross-sections of thecast irons after chemical etching with Nital 4 weremainly pearlitic with ferrite close to the graphitelamellae, steadite, and impurities in the form of polygonal shape particles (Figures 4(a) through (c)). Theseparticles were identified as manganese sulfide inclusionsby semi-quantitative SEM/EDS analyses. Unlike steels,where manganese sulfide inclusions are intentionallyobtained to improve machinability, cast irons showthese inclusions as a natural result of the foundryprocess.[9] The steadite observed on the analyzed artifacts was in the form of cellular networks surroundingdendrites, also in those with a percentage of phosphorous lower than 0.4 pct. The addition of phosphorouslowers the melting point and improves the fluidity ofcast irons, allowing to create nearly unlimited decorativeand structural components with thin wall thickness.[2,4,8]There were no detectable differences between themicrostructures observed in cross-sections close to thesurface and in the center of the cast irons. Therefore, thecast iron samples examined were very uniform inappearance and could be repetitively produced.Tables III and IV show the values of microstructuralfeatures determined by image analysis of the micrographs in cross-section of the cast irons and groupedaccording to dating and nationality of the foundry oforigin. Statistically significant differences for dating (pvalue 0.05) were obtained for MA, wS, and EP(Table III), but for the nationality of the foundry oforigin statistically significant differences were found forwG, wS, and EC (Table IV).Fig. 2—Pie charts of (a) distribution and (b) size of graphite lamellae in cross-sections of the analyzed cast irons.1132—VOLUME 52A, MARCH 2021METALLURGICAL AND MATERIALS TRANSACTIONS A
Fig. 3—Optical micrographs of the unetched microstructures observed in cross-sections of the analyzed cast irons: (a) graphite lamellaedistribution of Type A in CI 1; (b) graphite lamellae distribution of Type B in CI 7; (c) graphite lamellae distribution of Type C in CI 6; (d)graphite lamellae distribution of Type D in CI 24.Box plots of area fraction of graphite in the matrixdetermined by image analysis of the optical micrographsin cross-section of the cast irons are shown in Figure 5.Considering the artifacts dating to the second half ofXIX century (box pl
Roman conquest of Britain in 43 B.C.[10] The introduction of cast iron in Europe occurred around 1200 to 1450 A.D. Before this time, ironmaking . furnaces in Coalbrookdale by coke instead of wood charcoal, supporting larger charges of iron ores and limestone, and obtaining cast iron products with a lower .