Transcription
Version 4.0Step-by-Step ExamplesTwo-Way ANOVA with Post Tests1Two-way analysis of variance may be used to examine the effects of two variables (factors), both individually andtogether, on an experimental response. Suppose you’ve studied the effects on heart rate of three experimentaltreatments (factor 1) before and during exercise (factor 2). Two-way ANOVA, in combination with post testing,can answer the following questions: Is there an effect of treatment on heart rate? Is there an effect of exercise on heart rate? Is there interaction between the factors? That is, does the affect of treatment differ between exercisestates, or equivalently, does the effect of exercise differ among treatments? At which treatments is there a significant difference between exercise levels?To learn more about two-way analysis of variance, consult the companion Statistics Guide. If your data aregrouped by only one factor, see the Step-by-Step Example “One-Way ANOVA and Nonparametric Analyses”.Entering and Graphing the DataWhen you launch Prism, the Welcome dialog appears. Choose to Create a new project and indicate that youwill create the initial data table and linked graph by choosing the Type of graph.Our data are organized by two grouping variables, or factors: Exercise, which has two levels—Before exercise and During exercise Treatment, which has three levels—None, Lesion, and Lesion DrugTherefore, select the tab for Two grouping variables.1 Adapted from: Miller, J.R., GraphPad Prism Version 4.0 Step-by-Step Examples, GraphPad Software Inc., SanDiego CA, 2003. Step-by-Step Examples is one of four manuals included with Prism 4. All are available fordownload as PDF files at www.graphpad.com. While the directions and figures match the Windows version ofPrism 4, all examples can be applied to Apple Macintosh systems with little adaptation. We encourage you to printthis article and read it at your computer, trying each step as you go. Before you start, use Prism’s View menu tomake sure that the Navigator and all optional toolbars are displayed on your computer. 2003 GraphPad Software, Inc. All rights reserved. GraphPad Prism is a registered trademark of GraphPadSoftware, Inc. Use of the software is subject to the restrictions contained in the software license agreement.1
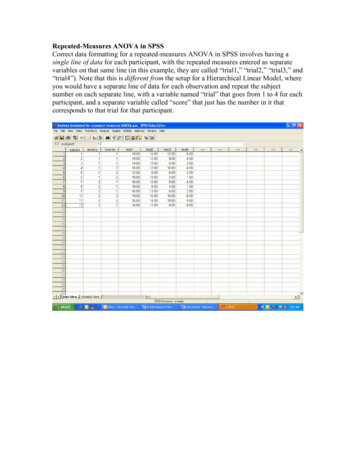
The Welcome dialog displays eight choices for the graph type. You can switch freely between the buttons, readingthe “Selected graph” descriptions if you don’t find the thumbnail illustrations clear. Choose the top-centerbutton—for grouped vertical bars.With the graph type selected, indicate that you will enter data into subcolumns as 3 replicates. That means thatyou will enter your replicate measurements, and Prism will compute the means and standard deviations orstandard errors automatically. Click OK to exit the Welcome dialog. Prism creates and displays the new table.Data entry for two-way ANOVA in Prism differs from that in most other statistics programs. Other programsrequire you to enter data in a three-column indexed format—all measurements in one column and the levels of thetwo factors in two parallel columns. With Prism, you enter your data onto a table as you’d normally illustrate theresults, with the row-and-column position of each datum indicating the factor level. The data table contains an Xcolumn, which holds the levels of one grouping variable. Since we indicated in the previous dialog that we willenter data as 3 replicates, Prism subdivides each data set (A, B, C, .) to make room for our replicates (A:Y1, A:Y2,A:Y3; B:Y1, B:Y2, B:Y3; etc.). Each data set represents a level of the other grouping variable.Enter the values show below into your table, including column headings.Although we instructed Prism to format the table for “3 replicates”, in this example, the values in subcolumns Y1,Y2, and Y3 are matched measurements, not simple replicates (we’ll indicate that when we enter the two-wayANOVA analysis parameters later). This affects Prism’s tolerance for missing values: If you request ordinary two-way ANOVA (no matching), Prism will work even if some values are missing.You must have at least one value for each condition in each row. For example, if your data table isformatted for triplicate values (as in the example), you can't leave all three values empty. If you specify repeated-measures two-way ANOVA (row or column matching), Prism will allow you tohave a different number of subjects in one data set than you do in another, but within each data set youmust have the same number of subjects on each row.In the Welcome dialog, we could have specified a data entry format of mean; standard deviationor standard error; and N (unless you want to do repeated-measures analysis, in which case youmust provide individual replicate measurements).2
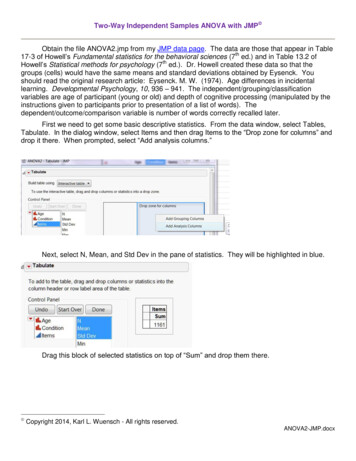
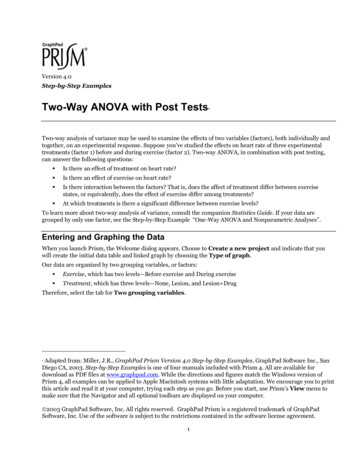
Click on the default table name (drop-down list on the toolbar). Type a new name for the table. That name will beused as the title for your graph, although you are free to name the graph independently.Click on the yellow Graphs tab on the toolbar to view the bar chart that Prism has produced automatically.Exercise and Treatment Effects200Before exerciseDuring exercise1000Before exerciseDuring exerciseTreatmentNote that the error bars on this graph will show standard error (SEM) rather than standard deviation (SD) if thatis the default setting in Prism (to check this, choose Edit. Preferences , select the Graph tab, and check theError Bar settings). If you don’t want to change the default setting to SD error bars but you do want the errorbars to show SD on this graph, double-click on one of the bars to open the Format Bars dialog. Choose theAppearance tab, use the button to change all data sets at once,and set Error values to Mean & SD.Performing the AnalysisClick Analyze. In the Analyze Data dialog, select Statistical analyses and Two-way ANOVA. Accept thedefault setting to analyze All data sets.If you have three or more data sets, you can choose to limit the analysis to only some of the datasets by choosing Selected data sets and clicking Select to open the Select Data Sets dialogand tell Prism which sets to analyze. If you later change your mind about which data sets toanalyze, click the Change button and choose Data Analyzed .In the Parameters: Two-Way ANOVA dialog box, enter names for the factors (variable names) defining thecolumns and the rows. This step is optional. It doesn’t affect the computations; it just makes the output easier tofollow.3
Now tell Prism whether or not you have repeated measures, and if so, whether the measurements are repeatedrow-wise or column-wise. We’ll assume that subjects were assigned to only one of the three treatment groups(None, Lesioned, Lesioned drug treated) but that measurements were made on each subject both before andduring exercise. This is matching by row—the value in row 1, subcolumn A:Y1 was obtained from the same subjectas the value in row 1, subcolumn B:Y1.The dialog setting is Note that the Repeated measures section will be greyed-out if you do not provide individual replicate values.Finally, select the Bonferroni post-test option.You can get more help with these settings by clicking Help Me Decide at the bottom of theParameters dialog box.Viewing and Understanding the ResultsWhen you leave the Parameters dialog, Prism runs the analysis. The Results page for this example consists of twoviews. You can switch between the views (Tabular results and Narrative results) in the drop-down box on thetoolbar or in the Navigator. Prism displays the Tabular results view first, indicating significant effects of bothexercise and treatment, and interaction between the two factors (the effect of one factor is influenced by the level4
of the other factor, e.g., the difference in heart rate before exercise and heart rate during exercise is not the samewith all treatments).The results show that, in this case, matching of subjects was not effective in controlling for variability betweensubjects. If you click the “Analysis Check List” buttonand request information on subject matching—choose How to think about results from two-wayANOVA Subject (matching)—Prism advises you to reconsider using repeated-measures ANOVA.Further down the Tabular results view, the ANOVA table is presentedas well as the post test results.For an easy-to-understand synopsis of the results, switch to the Narrative results view.Here’s a partial illustration of the narrative:5
The narrative points out the “extremely significant” interaction (very small interaction P value), which makes theP values for factor (row and column) effects hard to interpret. It is particularly worthwhile in that case toinvestigate the results of the post tests. If the interaction P value had been high, suggesting a consistent differencefrom before to during exercise among all treatments, the post tests would not have been very helpful.If Prism cannot do the analysis (e.g., you request a repeated-measures analysis, but data are missing from one ormore cells), the Tabular results view is empty, and you can read an explanation in the Narrative results view.While Prism makes two-way ANOVA very simple, it does not offer all the options of a high-end statistics program.Specifically, Prism cannot do the following: Two-way nonparametric ANOVA Post testing between row means Post testing between column meansReconfiguring the AnalysisYou can easily change the parameters for, and then re-run, your ANOVA. In the Navigator, choose any of thesheets containing the analysis results. Click the Change button and then choose Analysis Parameters . TheParameters: Two-Way ANOVA dialog reappears. Make your changes, then click OK to recompute theanalysis and display the new results.6
Two-way nonparametric ANOVA Post testing between row means Post testing between column means Reconfiguring the Analysis You can easily change the parameters for, and then re-run, your ANOVA. In the Navigator, choose any of the sheets containing the analysis results. Click the Change button and then choose Analysis Parameters . The