Transcription
One-way ANOVA
Introduction Two variables: 1 Categorical variable(factor/IV), 1 Quantitative variable(response/DV) Main Question: Do (the means of) thequantitative variables depend on which group(given by categorical variable) the individual is in? ANOVA looks at differences betweengroups.Note: We usually refer to the sub-populations orthe same population but with different treatmentsas “groups” when doing ANOVA.
IntroductionAt its simplest ANOVA tests the followinghypotheses:H0: The means of all the groups are equalμ1 μ2 μ3 μiHa: Not all the means are equal
Introduction Usefulness:– Similar to t-test– More versatile than t-test– Compare one parameter (response variable)between two or more groups
Introduction Why Not Just Use t-tests?– Tedious when many groups are present– Using all data increases stability– Large number of comparisons some mayappear significant by chance
Introduction Examples:– ”An organization has three different branches.Turnover level differs across the three branches andmanagement wants to know whether this may beexplained by the extent to which employees aresatisfied with their working environment across thebranches. Fifty employees are randomly selected ateach branch and given a questionnaire measuringhow satisfied they currently are with the workingenvironment”.
Introduction– Researchers investigate the effects of control typeon firm performance. The research question iswhether a real difference exists in performancebetween owner- and manager-controlled firms(McKean and Kania, 1978).– Investigators want to investigate whetherdemographic factors (e.g. age groups, races,education level, annual income level, andemployment status) and investment experience(novice, intermediate, advance) have influence onretirement planning intention.
Introduction– Researchers investigate the behavior of noise tradersand their impact on the market. There are threegroups in the experiment (accordingly withresearchers’ treatments): informed traders (whopossess fundamental information), liquidity traders(who have to trade for exogenous reasons), andnoise traders (who do not possess fundamentalinformation and have no exogenous reasons totrade); (Bloomfield, O’Hara, and Saar, 2007).– Researchers investigate the impact of moods (i.e.Negative, positive, and neutral) on ethical judgmentof auditors (Cianci and Bierstaket, 2009).
Introduction The researchers investigate the effects ofadvertising models’ eye color (blue, green,and brown) in ad viewers responses to thead (Simpson, Sturgen, and Tanguma)
Introduction What can we conclude from the examples?
ANOVA AssumptionsThere are Three basic assumptions used inANOVA: The populations from which the sampleswere taken are normally distributed. Homogeneity of variance Random sampling.
Notation for ANOVA n number of individuals all together i number of groups x mean for entire data set isGroup i has ni # of individuals in group i xij value for individual j in group i xi mean for group i si standard deviation for group i
How ANOVA worksANOVA measures two sources of variation in the data andcompares their relative sizes variation BETWEEN groups for each data value look at the difference between its groupmean and the overall mean( xi - x ) 2 variation WITHIN groups for each data value we look at the difference between thatvalue and the mean of its group( xij - xi ) 2
How ANOVA worksThe ANOVA F-statistic is a ratio of the Between Group Variation dividedto the Within Group Variation:FBetweenWithinMSGMSEThis compares the variation between groups (group means to overall mean)to the variation within groups (individual values to group means). This iswhat gives it the name “Analysis of Variance.”A large F is evidence against H0, since it indicates that there is moredifference between groups than within groups.Note: it is easier to look at the P-value to indicate whether the H0 isrejected or not If the P-value is less than or equal to a, reject H0. If the Pvalue is greater than a, fail to reject H0.
How ANOVA works Step 1: The null hypothesis isH0 :123 Step 2: The alternative hypothesis isH a : not all of theiare equal Step 3: The significance level is(usually ?is set to one of the values {0.01, 0.05, 0.1}
How ANOVA works Step 4: Calculate the F-statistic:FMean Square GroupMSGorMean Square ErrorMSEMSG, MSE and the F-statistic are found in theANOVA table when the analysis is run on the SPSS
How ANOVA works Step 5: Find the P-value Step 6. Reject or fail to reject H0 based on theP-value. Step 7. State your conclusion.
How ANOVA works Levene’s test:H0: σ12 σ22 σ32 σi2 Homogeneity ofvarianceHa: σ12 σ22 σ32 σi2– Homogeneity fulfilled Equal variances assumed.– Homogeneity rejected Equal variances not assumed.Note: ANOVA is still robust even when the homogeneity assumption is not fulfilled,as long as the sample sizes are roughly equal or the deviation is only of amoderate level. As a rule of thumb, if the largest std.dev (2 x the smalleststd.dev) then we need not to be concerned about this assumption. Equal variance assumed or not assumed will affect to Post Hoc test methods(p.20)
How to perform ANOVA in SPSS? One-way ANOVA– Choose Analyze General Linear Model Univariate– Click the DV (only one click) to highlight it andthen transfer it to Dependent Variable box byclicking the corresponding arrow.– Doing a similar procedure for IV and transfer it toFixed Factor(s) box by clicking the correspondingarrow.– After that, click the option button and check forHomogeneity of Variance. Note: SPSS uses aLevene’s test of homogeneity of variance.– Back to the former box.
How to perform ANOVA in SPSS? Post Hoc Test: The results from the ANOVA do notindicate which of the three groups differ from one another.To locate the source of this difference we use a post hoctest (commonly Tukey test and the more conservative isScheffé test; equal variance is assumed in these tests).– Click Post Hoc and check Tukey box, click Continue button.– Last, click OK button and wait a moment while SPSS analyzes thedata.Note: Tukey performs all of the pairwise comparisons between groups. Scheffe performs simultaneous joint pairwise comparisons for allpossible pairwise combinations of means. Can be used to examine allpossible linear combinations of group means, not just pairwisecomparisons.
How to perform ANOVA in SPSS? If equal variance is not assumed, some posthoc tests could be used:– Tamhane's T2. Conservative pairwisecomparisons test based on a t-test.– Dunnett's T3. Pairwise comparison test basedon the Studentized maximum modulus.– Games-Howell. Pairwise comparison test thatis sometimes liberal.– Dunnett's C. Pairwise comparison test basedon the Studentized range.
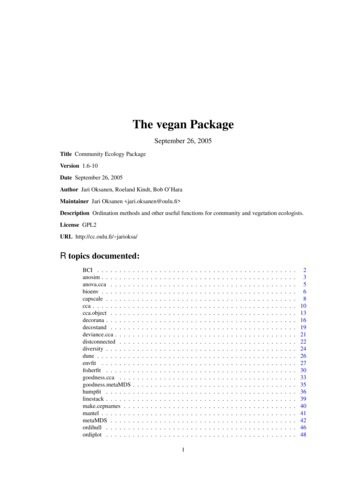
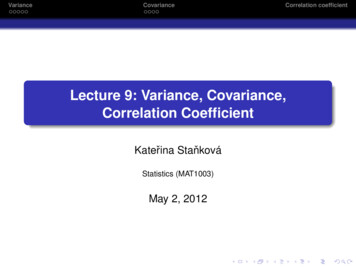
How to perform ANOVA in SPSS?One IV or FactorIs F-value significant?YesNoAre there more than 2groups?StopYesNoDo Post HoccomparisonStop
How to perform ANOVA in SPSS?Exercise 1: Open job satisfaction.sav An organization has three branches in threedifferent region. Management wishes to knowwhether employees are satisfied with their jobdiffers across regions. A total of 218employees are randomly selected at theregions and given a questionnaire measuringhow satisfied they currently are with theirjob”.
How to perform ANOVA in SPSS? Does management find evidence thatemployees’ job satisfaction differs acrossregions? Which branch differs from theothers?
How to perform ANOVA in SPSS?This is howthe data setis shown
How to perform ANOVA in SPSS?
How to perform ANOVA in SPSS?Transfer Satisfactionvariable todependent variablebox and regionvariable to FixedFactor(s) box. Afterthat click Options
How to perform ANOVA in SPSS?Check thehomogeneitycheck-box andafter that clickContinue
How to perform ANOVA in SPSS?Click Post Hoc
How to perform ANOVA in SPSS?1. Transfer Locationvariable fromfactor(s) to PosHoc Tests for:2. Check the TukeyCheck-box3. Click Continue
How to perform ANOVA in SPSS?Click OK and wait a minute
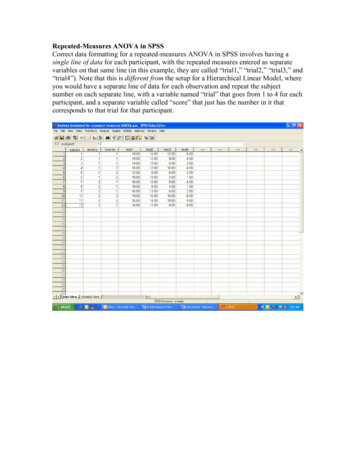
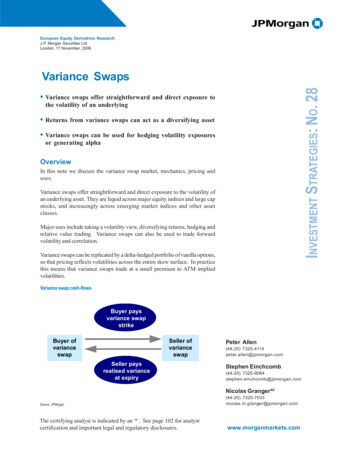
How to perform ANOVA in SPSS?The number of samplein each regionHomogeneity test’sresultP-value for Levene’s TestHo: σ1 σ2 σ3Ha: At least one σ is different thanthe others
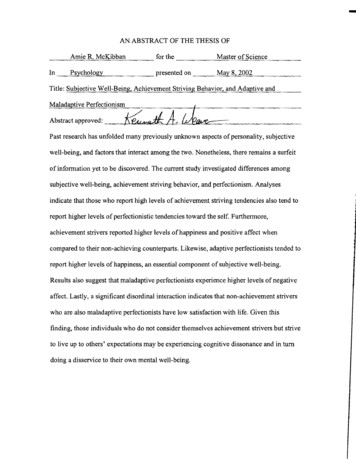
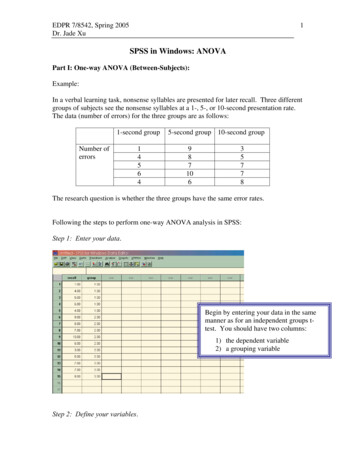
How to perform ANOVA in SPSS?Result of ANOVAP-Value for ANOVAHo: μ1 μ2 μ3Ha: At least one μ isdifferent than the othersConclusion: There is a difference inemployees’ job satisfaction acrossregions.
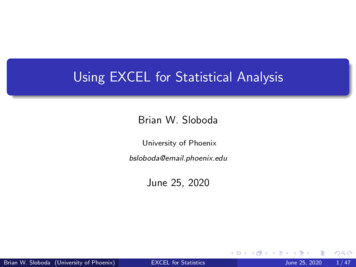
How to perform ANOVA in SPSS?South region is significantlydifferent from others
How to perform ANOVA in SPSS?Exercise 2: Open Training.xlsx file. Read the instruction in the Training.xlsx file and the rawdata. Open Training.sav file. Observe how we handle the raw data and convert itinto three treatments in order to analysis it usingANOVA. Perform the ANOVA test using file Training.sav. Answer the questions. Report this exercise 2 in written form by the end of thiscourse week.
Test yourselfWhat is ANOVA?Why do we use ANOVA?What are ANOVA assumptions?How to test ANOVA assumptions?What do we do when the equal variance isnot fulfilled? What does it mean when the F value inANOVA result is statistically significant? What does the post hoc test answer?
References Agresti, A. (2007) Ch 12: Comparing group: Analysis of Variance(ANOVA) method, Retrieved on 26/04/2012, fromhttp://www.stat.ufl.edu/ aa/sta6127/ch12.pdf. Bloomfield, R., O’Hara M., and Saar G. (2007) ”How Noise TradingAffects Markets: An Experimental Analysis”, Available at SSRN:http://ssrn.com/abstract 994379 orhttp://dx.doi.org/10.2139/ssrn.994379. Cianci, A. and Bierstaker, J. 2009. "The Effect of Client Importanceand Performance Feedback on Auditors' Technical and EthicalJudgments." Managerial Auditing Journal, Vol. 24 Iss: 5, pp.455 – 474. Ghozali, I. (2005) Multivariate analysis application with SPSS,Diponegoro University Publishing, Semarang. Ho, R. (2006) Handbook of univariate and multivariate data analysis andinterpretation with SPSS, Taylor & Francis Group, Boca Raton, FL.
McKean, J. R., and Kania, J. J. (1978) “An Industry approach toowner-manager control and profit performance”, Journal ofBusiness, Vol. 51 No. 2, pp. 327-342. Murray, J. (2010) Analysis of Variance – Homework and Exam,Retrieved on 27/04/2012, fromhttp://www.murraylax.org/bus735/fall2010. Pruim, R. (nd) ANOVA: Analysis of Variance, Retrieved on30/04/2012, fromhttp://www.calvin.edu/ rpruim/courses/m243/F03.
How to perform ANOVA in SPSS? One-way ANOVA -Choose Analyze General Linear Model Univariate -Click the DV (only one click) to highlight it and then transfer it to Dependent Variable box by clicking the corresponding arrow. -Doing a similar procedure for IV and transfer it to Fixed Factor(s) box by clicking the corresponding arrow.