Transcription
Available online at www.sciencedirect.comScienceDirectProcedia Engineering 69 (2014) 952 – 96124th DAAAM International Symposium on Intelligent Manufacturing and Automation, 2013Tolerance Stack Up Analysis for Angularity of Components and theirAssemblyA. K. Sahania,b,*, Pramod Kumar Jainb, Satish C. SharmabaInstruments Research & Development Establishment, DRDO, Ministry of Defence, Dehradun-248008, IndiabIndian Institute of Technology, Roorkee-247667, IndiaAbstractGeometric dimensioning and Tolerancing (GDT) constitutes the dominant approach for design and manufacture of mechanicalparts that control inevitable dimensional and geometrical deviations within appropriate limits. The stack up of tolerances andtheir redistribution without hampering the functionality is very important for cost optimization. This paper presents amethodology that aims towards the systematic solution of tolerance stack up problem involving geometriccharacteristics.Conventional tolerance stack up analysis is usually difficult as it involves numerous rule and conditions. Themethodology presented i.e. generic capsule method is straightforward and easy to use for stack up of geometrical tolerances ofcomponents and their assembly using graphical approach. In the work presented in this paper, angularity tolerance has beenconsidered for illustration of the methodology. Two approaches viz. Worst Case (WC) and Root Sum Square (RSS) have beenused. An example of dovetail mounting mechanism has been taken for purpose of stack up of angularity. This assembly consistsof two parts i.e. dovetail male and dovetail female. Tolerance stack up has been done both for the components and theirassembly. Need for computerisation of methodology for geometrical tolerance stack up of large assemblies has emerged out asthe limitation of the proposed method. 2014 The Authors. Published by Elsevier Ltd. 2014 The Authors. Published by Elsevier Ltd. Open access under CC BY-NC-ND license.Selection and peer-review under responsibility of DAAAM International Vienna.Selection and peer-review under responsibility of DAAAM International ViennaKeywords: GDT; Angularity; Stack up Analysis; Graphical Method; WC Approach; RSS Approach*Corresponding author. Tel.: 91-135-2782503; fax: 91-135-2787161.E-mail address: sahaniak@yahoo.com1877-7058 2014 The Authors. Published by Elsevier Ltd. Open access under CC BY-NC-ND license.Selection and peer-review under responsibility of DAAAM International Viennadoi:10.1016/j.proeng.2014.03.075
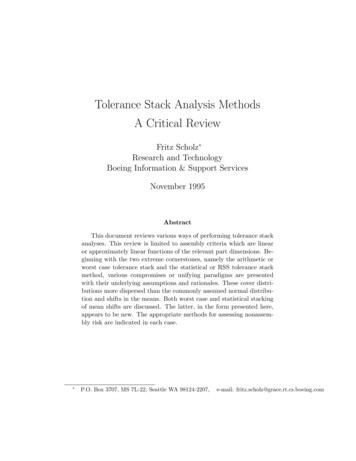
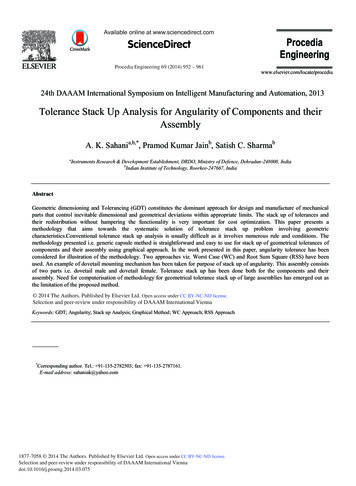
A.K. Sahani et al. / Procedia Engineering 69 (2014) 952 – 9619531. IntroductionTolerance is an essential part of design and manufacturing. There are two types of tolerancing i.e. dimensional andgeometrical tolerancing. The application of GDT for mechanical design has gained widespread acceptance inindustry. From a component design perspective, it provides the engineer a communication tool to fully describe thefunctionality of an item dimensionally. Design and Tolerancing (DT) is used to specify the size, shape, form,orientation, and location of features on a part. Features toleranced with GDT reflect the actual relationship betweenmating parts. Drawings with properly applied geometrical tolerancing provide the best opportunity for uniforminterpretation and cost effective assembly. GDT is used to ensure the proper assembly of mating parts, to improvequality and to reduce cost by proper selection of manufacturing process. Before designers can properly applygeometric tolerancing, they must carefully consider the fit and function of each feature of every part. Properly appliedgeometrical tolerancing ensures interchangeablity of the parts. Geometrical tolerancing allows the designers to specifythe maximum available tolerance and consequently design the most economical parts. A properly toleranced drawingis not only a picture that communicates the size and shape of the part, but it also explains the tolerance relationshipsbetween features.Fig. 1. Angularity.In this paper, angularity is taken for study. It is defined for a feature (like surface or line) with reference toanother feature called reference. It defines the distance between two lines or surfaces which are at an angle to thedatum surface and encompass the line or surface as shown in Fig. 1. Tolerance stack ups of individual componentsand their assembly have been carried out using graphical approach.2. Literature ReviewA lot of work has been done in the field of conventional tolerancing. Conventional tolerancing methods do agood job for dimensioning and tolerancing of size features and are still used in good capacity. But these methods donot cater precisely for form, profile, runout, location and orientation features as discussed by Cogorno [1], Meadows[2], Drake [3] and ADCATS [4]. GDT is used extensively for location, profile, runout, form and orientationfeatures. In more theoretical terms, there are two types of tolerancing schemes i.e. parametric and geometric.Parametric tolerancing consists of identifying a set of parameters and assigning limits to the parameters that define arange of values which has been discussed by Requicha [5]. Singh et al. [6] reviewed different methods of toleranceallocation and found mean shift models and the combination of the basic approaches. Singh et al. [7] reviewedtolerance synthesis approaches for tolerance stack up i.e. the worst case and the root sum square approach. Swift etal.[8] introduced a knowledge based statistical approach to tolerance allocation. In this approach, a systematicanalysis for estimating process capability levels at the design stage is used in conjunction with statistical methodsfor the optimization of tolerances in assembly stack up. Chase et al.[9] demonstrated that the methods for toleranceallocation for minimum production cost can be extended to include process selection from a set of alternateprocesses. Ngoi et al. [10] discussed the stack up of geometrical tolerances using generic capsule method. Ngoi etal. [11] presented an elegant approach by using the ‘Quickie’ technique towards tolerance stack up analysis for
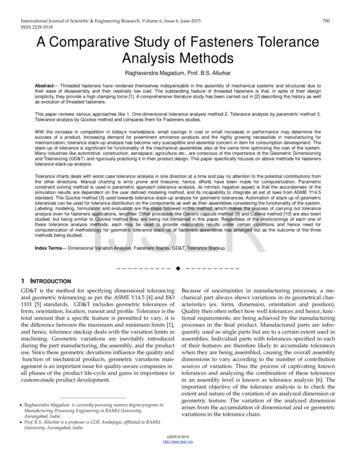
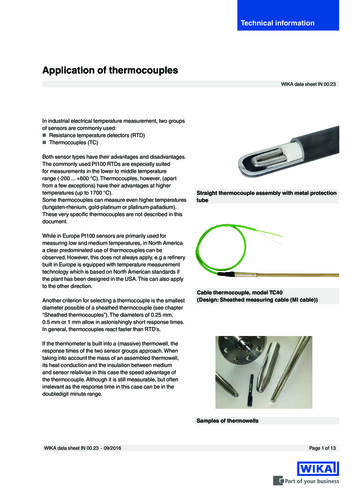
954A.K. Sahani et al. / Procedia Engineering 69 (2014) 952 – 961geometrical tolerances. Ngoi et al. [12] also presented a straightforward graphical approach known as the “Catena”method for tolerance stack up, involving geometric characteristics in form control – flatness, straightness, circularityand cylindricity. He and Gibson [13] developed an extension of computerised trace method to determine therelationship between geometrical tolerances and manufacturing dimensions and tolerances. This method minimizesthe cost of scrap as the objective function which is a function of manufacturing tolerances. Requirements of designsizes, geometrical tolerances (both form and position) and machining allowances are expressed mathematically asconstraints for the optimization. Shivkumar et al. [14] presented a general new methodology using intelligentalgorithms for simultaneous optimal selection of design and manufacturing tolerances with alternativemanufacturing process selection. Mansuy et al. [15] presented an original method that enables to solve problems forthe case of serial assembly (stacking) without clearances. This method is based on the use of influence coefficientsto obtain the relationship between the functional tolerance and the tolerances associated with the geometry of themechanism’s interface surfaces. Sahani et al. [16] presented review of different techniques for stack up for flatnessgeometrical tolerances.3. MethodologyThe generic capsule method has been used to evaluate stack up of tolerances in this paper. In this method, foursteps are to be followed. In labelling step, all the surfaces those are related by dimensions in the drawing arelabelled. The labelling is done in one direction, say from top to bottom and in two stages viz. identity and hierarchy.In the former stage, the component is labelled in ascending alphabetical order. It helps in identifying the surfaces inthe drawing while referring to the graphical model. The component number is indicated by adding a numeral prefixto the alphabetical label. In next stage of labelling i.e. hierarchical labelling, the surfaces are labelled in ascendingnumerical order in the same direction as in identity labelling stage. In the next step of modelling, the GDT model isconstructed for every component. For constructing the GDT model of assembly, contacts of components arerepresented by double dashed line. After modelling, formulation is carried out to identify the stack path consisting ofthe unknown distance. An equation is formulated to calculate the unknown parameter from the stack path. Thisequation is formed on the basis of principle of summation of vectors. The stack up of tolerances is done by takingthe directional arrows as vector and dashed line as scalars. In the last step i.e. evaluation, the desired dimension canbe calculated by substituting the known values into the stack path. The stack up of tolerances can be done throughworst case and root sum square approaches.Graphical Approach for Stack up TolerancesA case is taken up for the stack up of angularity for components and their assembly. This assembly consists oftwo components i.e. ‘Dovetail Female’ and ‘Dovetail Male’ as shown in Fig. 2 &3 and their assembly ‘DovetailAssembly’ is shown in Fig. 4.Fig. 2. Dovetail female.Fig. 3. Dovetail male.
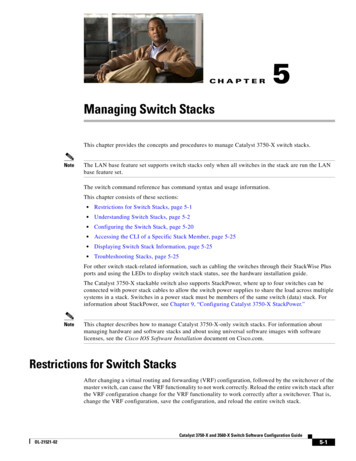
A.K. Sahani et al. / Procedia Engineering 69 (2014) 952 – 961955Fig. 4. Dovetail assembly.The part number assigned for the ‘Dovetail Female’ component is 1 while the part number for the ‘DovetailMale’ component is 2. The labelling of surfaces and vertices of ‘Dovetail Female’ and ‘Dovetail Male’ is shown inFig. 5.Fig. 5. Labelled dovetail.The angularity tolerance is the distance between two lines or surfaces that are at an angle to the datum surface(AN) and encompass the line or surface is given at an angle ( ANB), which is transferred to the horizontal surface(AN). The angular tolerance transformation sketch is shown in Fig. 6.Fig. 6. Angle transformation.Now from the Fig. 6,Sin 60º AB / ANSo, AN AB / Sin 60º 0.02 / Sin 60º 0.0231
956A.K. Sahani et al. / Procedia Engineering 69 (2014) 952 – 961Having completed the labelling phase, the graphical model is then constructed for ‘Dovetail Female’, ‘DovetailMale’ and ‘Dovetail Assembly’ as shown in Fig. 7, 8 &9.Fig. 7. GDT model for dovetail female.Fig. 8. GDT model for dovetail male.Fig. 9. GDT model for dovetail assembly.To determine the distance between surface A to edge C for ‘Dovetail Female’ component, the stack up path isidentified for calculation. It will follow the loop 1A - 1C* - 1C - 1B - 1A. The expression derived from the stackpath is then1A1C* - 1C*1C -1C1B-1B1A 0Substituting the values,X - ( 0.0115) - (20.3 0.2) – (10.9 0.1) 0Worst Case (WC) Approach:The total tolerance stack up can be written as'Yn G ii1
A.K. Sahani et al. / Procedia Engineering 69 (2014) 952 – 961957Where,n Number of constituent dimensionsG i Tolerance associated with dimensionX - ( 0.0115) - (20.3 0.2) – (10.9 0.1) 0X – (31.2 0.3115) 0X 31.2 0.3115Maximum and minimum values of X are 31.5115 30.8885XmaxXminRoot Sum Square (RSS) Approach:Total tolerance of assembly can be written as'Yn G2ii 1Where,n Number of constituent dimensionsG i Tolerance associated with dimensionX 31.2 (0.01152 0.22 0.12 )X 31.2 0.2239Maximum and minimum values of X areXmaxXmin 31.4239 30.9761To determine the distance between surface A to edge C for ‘Dovetail Male’ component, the stack up path isidentified for calculation. It will follow the loop 2A - 2C* - 2C - 2B - 2A. The expression derived from the stackpath is then2A2C* - 2C*2C -2C2B-2B2A 0Putting the values,Y - ( 0.0115) - (20.1 0.1) – (10.95) 0Worst Case (WC) Approach:Y - ( 0.0115) - (20.1 0.1) – (10.95) 0Y 31.05 0.1115Maximum and minimum values of Y are
958A.K. Sahani et al. / Procedia Engineering 69 (2014) 952 – 961YmaxYmin 31.1615 30.9385Root Sum Square (RSS) Approach:Y 31.05 (0.01152 0.12 )Y 31.05 0.1007Maximum and minimum values of Y areYmaxYmin 31.1507 30.9493In the case of an assembly, the graphical model is constructed part by part i.e. one model for the ‘DovetailFemale’ and another model for the ‘Dovetail Male’. The two part models are then linked together by double dashedline that represents contact. The labelling of surfaces and vertices of Dovetail Assembly is shown in Fig.10.Fig. 10. Labelled dovetail assembly.Here the mating edges are 1C of first part and 2C of second part. Unknown parameter is the distance betweensurface A of part 1 to edge B of part 2. Upon completion of the model, the stack path is identified. Since therequirement is to find the minimum value of Z, the correct stack path should pass through the double dashed linethat connects between 1C* and 2C*. The expression derived from the stack path is then1A2B* 2B*2B 2B2C 2C2C* 2C*1C* 1C*1C – 1C1B – 1B1A 0Upon substitution,Z 0.0115 (20.1 0.1) 0.0115 0.0 0.0115 – (20.3 0.2) – (10.9 0.1) 0Worst Case (WC) Approach:Z– (11.1 0.4) 0.0345 0Z – (11.1 0.4345) 0Z 11.1 0.4345Maximum and minimum values of Z areZmaxZmin 11.5345 10.6655
A.K. Sahani et al. / Procedia Engineering 69 (2014) 952 – 961Root Sum Square (RSS) Approach:Z 11.1 (0.12 0.22 0.12 0.01152 0.01152 0.01152 )Z 11.1 0.2458Maximum and minimum values of Z areZmaxZmin 11.3458 10.8542Following the same procedure, the expression for the distance 1A1B* is obtained as1A1B* 1B*1B - 1B1A 0Upon substitution,Q 0.0115 – (10.9 0.1) 0Worst Case (WC) Approach:Q 0.0115 – (10.9 0.1) 0Q – (10.9 0.1115) 0Q 10.9 0.1115Maximum and minimum values of Q areQmaxQmin 11.0115 10.7885Root Sum Square (RSS) Approach:Q 10.9 (0.01152 0.12 )Q 10.9 0.1007Maximum and minimum values of Q areQmaxQmin 11.0007 10.7993Calculation of Clearance (P):Worst Case approach givesMaximum Clearance, Pmax Zmax-Qmin 11.5345-10.7885 0.746Minimum Clearance, Pmin Zmin-Qmax 10.6655-11.0115 -0.346959
960A.K. Sahani et al. / Procedia Engineering 69 (2014) 952 – 961Root Sum Square approach givesMaximum Clearance, Pmax Zmax-Qmin 11.3458-10.7993 0.5465Minimum Clearance, Pmin Zmin-Qmax 10.8542-11.0007 -0.14654. ResultsResults obtained by Worst Case (WC) and Root Sum Square (RSS) approach for individual parts and theirassembly are shown in Table 1. The results of stack up analysis show that the maximum clearance in assemblycomes out to be positive value whereas minimum clearance takes negative value. This indicates a situation wherethe assembly of parts can’t be done. Hence, reallocation of tolerances by the designer is required to remove thepossibility of negative clearance.Table 1. Results.WCApproachPart NameRSSMaxMinMaxMinDovetail Female X31.511530.888531.423930.9761Dovetail Male .5465-0.1465Dovetail Assembly5. ConclusionThe present paper explains an efficient and effective graphical method that aims towards the systematic solutionof tolerance stack up problems. The method is straightforward and easy to use for stack up of tolerances ofcomponents and their assembly using graphical approach. The usefulness of the method over the conventionaltolerance stack up is demonstrated by considering an example of dovetail mounting mechanism for purpose of stackup of angularity. Based on the results of analysis, reallocation of tolerances can be done to fulfil the functionality ofthe system. If number of components in an assembly is more, huge amount of mathematical calculations is required.However, it can also be found out by using suitable algorithm. Based on this algorithm, a code can be developedwhich will solve for the desired dimensions of components and their assembly with proper mating relationship.Further the results of stack up analysis can be validated from measurement of manufactured hardware.References[1] G.R. Cogorno, Geometric Dimensioning and Tolerancing for Mechanical Design, McGraw Hill, New York, 2006.[2] J.D. Meadows, Geometric Dimensioning and Tolerancing Handbook: Applications, Analysis & Measurement, ASME Press, New York, 2009.[3] P.J. Drake Jr., Dimensioning & Tolerancing Handbook, McGraw Hill, New York, 1999.[4]ADCATS website, http://adcats.et.byu.edu.[5] A.A.G. Requicha, Mathematical Definitions of Tolerance Specifications, Manufacturing Review, 6(4), 1993, pp. 269-274.[6] P.K. Singh, P.K. Jain, S.C. Jain, Important Issues in Tolerance Design of Mechanical Assemblies (Part 1: tolerance analysis), Proc. ImechE, J.Engineering Manufacture, Vol. 223 Part B, 2009, pp. 765-778.
A.K. Sahani et al. / Procedia Engineering 69 (2014) 952 – 961[7] P.K. Singh, P.K. Jain, S.C. Jain, Important Issues in Tolerance Design of Mechanical Assemblies (Part 2: tolerance synthesis), Proc. ImechE,J. Engineering Manufacture, Vol. 223 Part B, 2009, pp. 1249-1287.[8] K.G. Swift, M. Raines, J.D. Booker, Tolerance Optimization in Assembly Stacks Based on Capable Design, Proceedings of the Institution ofMechanical Engineers, Journal of Engineering Manufacture, Part B, 1999, pp. 213: 677.[9] K.W. Chase, W.H. Greenwood, B.G. Loosli, H.F. Loren, Least Cost Tolerance Allocation for Mechanical Assemblies with AutomatedProcess Selection, Manufacturing Review, Vol. 3, No. 1, 1990, pp. 49-59.[10] B.K.A. Ngoi, A.M. Agrawal, C.S. Chua, The Generic Capsule Approach to Tolerance Stack Analysis, International Journal of ProductionResearch, 36:12, 2010, pp. 3273-3293.[11] B.K.A. Ngoi, C.S. Tan, L.C. Goh, Graphical Approach to Assembly Tolerance Stack Analysis—the ‘Quickie’ GDT method”, Proc Instituteof Mechanical Engineers Volume 211 Part B, 1997, pp. 463-472.[12] B.K.A. Ngoi, L.E.N. Lim, P.S. Ang, A.S. Ong, Assembly Tolerance Stack Analysis for Geometric Characteristics in Form Control – the“Catena” Method, Int J Adv Manuf Technol, 15, 1999, pp. 292–298.[13] J.R. He, P.R. Gibson, Computer-Aided Geometrical Dimensioning and Tolerancing for Process-Operation Planning and Quality Control, lntJ Adv Manuf Technol, 7, 1992, pp. 11-20.[14] K. Sivakumar, C. Balamurugan, S. Ramabalan, Simultaneous Optimal Selection of Design and Manufacturing Tolerances with AlternativeManufacturing Process Selection, Computer-Aided Design, Volume 43, Issue 2, February 2011, pp. 207-218 .[15] Mathieu Mansuy, Max Giordano, Pascal Hernandez, A New Calculation Method for The Worst Case Tolerance Analysis and Synthesis inStack-Type Assemblies, Computer-Aided Design, Volume 43, Issue 9, September 2011, pp. 1118-1125 .[16] A.K. Sahani, A.K. Sharma, P.K. Jain, Satish C. Sharma, J.K. Bajpai, Review of Assembly Tolerance Stack up Analysis Techniques forGeometrical Tolerances, Int J of Adv Manufacturing Systems, Volume 14, Issue-1, 2012, pp. 1-9.961
tolerance synthesis approaches for tolerance stack up i.e. the worst case and the root sum square approach. Swift et al.[8] introduced a knowledge based statistical approach to tolerance allocation. In this approach, a systematic analysis for estimating process capability levels at the design stage is used in conjunction with statistical methods