Transcription
The January 2021 Cold AirOutbreak over Eastern China:Is There a Human Fingerprint?Yujia Liu, Chao Li, Ying Sun, Francis Zwiers, Xuebin Zhang,Zhihong Jiang, and Fei ZhengAFFILIATIONS: Liu—Key Laboratory of Geographic Information Science, Ministry ofEducation, and School of Geographic Sciences,East China Normal University, Shanghai, China;Li—Key Laboratory of Geographic InformationScience, Ministry of Education, and Schoolof Geographic Sciences, East China NormalUniversity, Shanghai, and Nanjing University ofInformation Science and Technology, Nanjing,China; Sun—Laboratory for Climate Studies,National Climate Center, China MeteorologicalAdministration, Beijing, China; Zwiers—PacificClimate Impacts Consortium, University of Victoria, Victoria, British Columbia, Canada, andNanjing University of Information Science andTechnology, Nanjing, China; Zhang—ClimateResearch Division, Environment and ClimateChange Canada, Toronto, Ontario, Canada;Jiang—Nanjing University of Information Science and Technology, Nanjing, China; Zheng—International Center for Climate and Environment Science, Institute of Atmospheric Physics,Chinese Academy of Science, Beijing, ChinaCORRESPONDING AUTHOR: Chao Li,cli@geo.ecnu.edu.cnDOI: 10.1175/BAMS-D-21-0143.1 2021 American Meteorological SocietyFor information regarding reuse of this contentand general copyright information, consultthe AMS Copyright Policy.AMERICAN METEOROLOGICAL SOCIETYA cold air outbreak swept across eastern China inJanuary 2021. It is characterized as a weakened coldevent that would have been more severe with lessanthropogenic warming.On 6–8 January 2021, a cold air outbreak sweptacross eastern China, peaking over the NorthChina Plain the night of 6 January, when 219weather stations recorded the lowest nighttime temperature since 1961. In total, 498 stations recorded thelowest daytime or nighttime temperature since 1961during the 3-day event. This event, together with twoother cold outbreaks that affected the region on 13–15December 2020 and 29 December 2020–1 January 2021,led to historic peak electricity demand and resumption of the operation of the only remaining coal-firedgenerating plant in Beijing.1 This analysis puts the coldoutbreak into histor1https://www.reuters.com/article/ical perspective byus-china-weather-energy-transportaconsidering changestion-idUSKBN29D104in the likelihood ofsuch events over 1961–2020 in the context of a climatethat is being warmed by anthropogenic forcing.Event definition.We define the event using a cold-degree days (CDD)metric calculated as the cumulative sum of negativedaytime maximum and nighttime minimum temperature anomalies during a cold event (in degree days,J A N UA RY 2 0 2 2S1
using C), where anomalies are defined relative to 1961–90, with the climatological valuesfor calendar days being determined using 15-day moving windows. The CDD metric is similar to the heating degree days metric, except that temperature differences from climatologyare accumulated rather than differences from a fixed temperature threshold, thus minimizing the influence of biases in model-simulated CDD. CDD is related to anomalous energyconsumption during a cold event.We focus on the January 2021 event because it was the most extensive of the three cold outbreaks in the 2020/21 winter as indicated by the number of stations observing record low temperatures since 1961. The associated atmospheric circulation features include a strengthenedUral high and a deepened East Asian trough, creating circulation conditions favoring theinvasion of cold air into eastern China from the Arctic (see Fig. S1 in the online supplementalmaterial; Zheng et al. 2021).Data and methods.We acquired daily maximum and minimum temperatures from 2419 mainland China weatherstations for 1961–2021. We also obtained simulations of these two variables from available climate models from phase 6 of the Coupled Model Intercomparison Project (CMIP6; Eyring et al.2016) that provided three or more merged historical and Shared Socioeconomic Pathway 5–8.5simulations (SSP5–8.5; O’Neill et al. 2016) and natural-forcing only simulations for 1961–2020as of July 2021 (see Table S1 in the online supplemental material). Although the CMIP6 natural-forcing only simulations for 2015–20 are driven by the SSP2–4.5 natural forcing agents (Gillett et al. 2016), using SSP2–4.5 simulations to extend the historical simulations (which end in2014) reduces available climate model ensemble sizes (Table S1). Nevertheless, our conclusionsare qualitatively robust to the choice of SSP simulations for data extension (Fig. S2).We computed CDD for the event and annual CDD minima (CDDn) for 1961–2020 from consecutive 3-day CDD values for individual winters at individual stations. To investigate humaninfluence on CDD, we first aggregated station temperatures to 5 5 grid cell values, and thencomputed CDD values from the gridded values. Stations with at least 90% of daily observations for all winters in 1961–2020 were used. Temperature simulations were linearly interpolated to the same 5 5 grid before computing model CDD values.We use a GEV distribution-based fingerprinting method (Zwiers et al. 2011; Wang et al.2017) to evaluate whether human influence is discernable in the 1961–2020 CDDn observations and, if so, to quantify the human influence on the likelihood of a 3-day outbreak as coldas or colder than the 2021 event. We focus on mainland China east of 105 E, which was theregion most impacted by the event. We conduct separate fingerprinting analyses for northernand southern parts of the region to accommodate their different rates of CDDn change. Theseanalyses were conducted on the 5 5 grid cells marked in Fig. 1, using only those with atleast 10 sufficiently complete stations.The method fits CDDn observations at valid grid cells to GEV distributions with grid-cell-specific location, scale, and shape parameters. At each grid cell s, the location parameter varieswith time as a linear function µ s,t cs Xs,t β of the climate model simulated response Xs,t ofCDDn to external forcings at that grid cell. All grid cells share the same scaling factors β byassuming that the model responses have the same spatiotemporal patterns as those in theobservations. The model response at a given grid cell to a given external forcing is estimatedas the location parameter of a GEV distribution fitted to simulations of CDDn under that forcing. Location parameters, which are assumed to vary slowly as a consequence of forcing, areconstrained to be constant within 5-yr periods. Scale and shape parameters are held constantthroughout the period.Uncertainty of the scaling factor estimates β ̂ due to internal variability in model responsesand observations is estimated with a two-stage spatiotemporal block bootstrap procedureAMERICAN METEOROLOGICAL SOCIETYJ A N UA RY 2 0 2 2S2
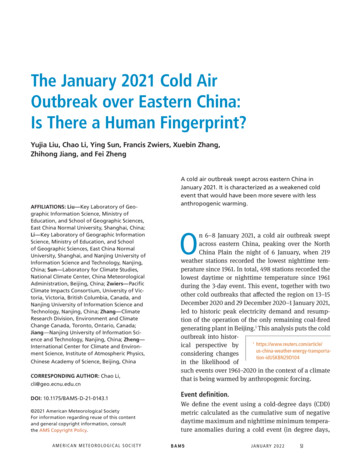
Fig. 1. Characteristics of the January 2021 cold event and its climate background. (a) Cold degree days observedduring the 3-day cold event of 6–8 Jan 2021. (b) The 1961–2020 trends in annual minimum cold degree days of 3-daycold events (CDDn). Grid cells north and south of the white lines mark the regions of detection and attribution analyses, which are referred to as Northeast and Southeast China, respectively. (c) Time series of CDDn from 1961 to 2020derived from regional mean daytime and nighttime temperatures of the period over (left) Northeast and (right)Southeast China, respectively. Red dashed lines show CDD values for the event, and red ticks mark years with CDDnvalues colder than the event value.(Zwiers et al. 2011). We first examine the resulting confidence intervals to determine if humaninfluence is detected in the CDDn observations. The human influence on the likelihood andintensity of the observed event is then evaluated by comparing the estimated frequency of3-day events as severe as the observed event during 2016–20 with that during 1961–65 andby considering changes in CDD values of 3-day events in the two periods that have the samefrequency as the observed event in 2016–20.Results.A mild 3-day cold event. Although clusters of weather stations over regions such as the NorthChina Plain reported record low temperatures during the event (Fig. S3), it was not a very extreme cold event on average when considering the entire northeastern and southeastern Chinadomains. The event (Fig. 1a) occurred against a background of anthropogenic global warming.The corresponding warming of CCDn at nearly all stations (Fig. 1b) is consistent with the factthat regional CCDn values colder than observed during the 3-day event previously occurredin 27 and 52 of the 59 winters between 1961 and 2019 in northeastern and southeastern China,respectively (Fig. 1c). In northeastern China the observed event would have been consideredmild during the first half of the period of record and not exceptionally cold during the secondhalf of the period, whereas in southeastern China the event would have been considered mildthroughout the period.AMERICAN METEOROLOGICAL SOCIETYJ A N UA RY 2 0 2 2S3
Fig. 2. Detection of human influence on the strength and probability of the January 2021 cold event. (a) Scalingfactors and their 5%–95% confidence intervals from two-signal fingerprinting analyses of CDDn over (left) Northeast and (right) Southeast China using single or multimodel anthropogenic and natural forcing response signals. (b)Regional median probability ratios and their 5%–95% confidence intervals comparing the estimated likelihood ofcolder than observed grid-cell CDD values during 1961–65 relative to 2016–20 (purple) in (left) Northeast and (right)Southeast China, and regional median differences in CDD values of 3-day events that have the same frequency as theobserved event in 2016–20 and their 5%–95% confidence intervals (green).Human influence on observed CDDn during 1961–2020. Fingerprinting analyses (Fig. 2a) show thatthe climate model simulated weakening of the strength of cold events due to anthropogenicforcing is detected in the 1961–2020 CCDn observations in both northeastern and southeasternChina. Detection occurs, with one minor exception, using signals estimated from either individual model ensemble simulations or multimodel ensemble simulations. The effect of naturalexternal forcing is not detected in northeastern China except for IPSL-CM6A-LR, while it isdetected in southeastern China using any of the ensembles. The natural forcing signal, whichis small in all cases, cannot be detected if the anthropogenic forcing signal is not included inthe fingerprinting analysis (Fig. S4). Overall, the results indicate that the observed warming ofCDDn would have been unlikely in the absence of human-induced warming, thus establishinga physical basis for the attribution of the 2021 cold event.Anthropogenic scaling factor confidence intervals for northeastern China are consistentwith unity except when using signals from CanESM5 and IPSL-CM6A-LR, which are modelswith high climate sensitivity (e.g., Li et al. 2021). For southeastern China, anthropogenic scaling factors are consistent with unity except when using the multimodel mean signal, whichappears to warm CDDn in this region significantly more slowly than observed.AMERICAN METEOROLOGICAL SOCIETYJ A N UA RY 2 0 2 2S4
Human influence on the 2021 cold event. The fingerprinting exercise provides observationallycalibrated time-evolving GEV distributions conditional on model-simulated CDDn that canbe used to estimate changes in the frequency and intensity of 3-day cold outbreaks causedby external forcing. Using the distributions conditional on the multimodel mean CDDn, wefind that the likelihood of observing a cold event that is as cold or colder than the 2021 eventwas about 2.0 times as likely in 1961–65 than in 2016–20 in northeast China and perhaps 1.2times as likely in southeast China (Fig. 2b; purple lines). Correspondingly, 3-day cold eventswith the estimated frequency of the 2021 event were roughly 9.0 degree-days colder during1961–65 than during 2016–20 (green lines; Fig. 2b). Even though the event was regarded asbeing extreme and impactful, it evidently would have been substantially more intense in theabsence of the warming that has occurred over the past 60 years. Uncertainties are large inpart because our inferences are made on a grid box scale comparable to or smaller in sizethan that of the majority of Chinese provinces, which is the scale on which decision makingon climate adaptation often occurs.Summary.We analyzed the 3-day January 2021 cold event in China and its historical climate changebackground using a novel cold degree days metric in combination with a fingerprinting analysis technique designed specifically for extremes. Despite high impacts and the setting of alarge number of cold temperature records, this was a relatively mild event regionally, withclear evidence that human influence on the climate has reduced the strength and probabilityof such events since 1961. Nevertheless, our inferences, which are made at the 5 5 scale using different model ensemble simulations, are relatively uncertain and should be used qualitatively. Studies have reported that the weakened winter Northern Hemisphere meridionaltemperature gradient (Ding et al. 2008) and Arctic sea ice loss (Mori et al. 2019) caused byanthropogenic warming may have induced more cold air outbreaks. Our results support theidea that anthropogenic warming has warmed cold outbreak events. Nevertheless, their impacts to, for example, people’s perception of cold and heating energy demand, which are alsoaffected by changes in exposure and vulnerability, may not have diminished accordingly.Acknowledgments. This study was supported by the National Key R&D Programs of China(2018YFC1507700). YS was also supported by the National Nature Science Foundation of China(42025503).ReferencesDing, Y., Z. Wang, Y. Song, and J. Zhang, 2008: Causes of the unprecedented freezing disaster in January 2008 and its possible association with the global warming. Acta Meteor. Sin., 66, 808–825.Eyring, V., S. Bony, G. A. Meehl, C. A. Senior, B. Stevens, R. J. Stouffer, and K. E.Taylor, 2016: Overview of the Coupled Model Intercomparison Project Phase 6(CMIP6) experimental design and organization. Geosci. Model Dev., 9, 1937–1958, https://doi.org/10.5194/gmd-9-1937-2016.Gillett, N. P., and Coauthors, 2016: The Detection and Attribution Model Intercomparison Project (DAMIP v1.0) contribution to CMIP6. Geosci. Model Dev., 9,3685–3697, https://doi.org/10.5194/gmd-9-3685-2016.Li, C., F. Zwiers, X. Zhang, G. Li, Y. Sun, and M. Wehner, 2021: Changes in annualextremes of daily temperature and precipitation in CMIP6 models. J. Climate,34, 3441–3460, https://doi.org/10.1175/JCLI-D-19-1013.1.AMERICAN METEOROLOGICAL SOCIETYMori, M., Y. Kosaka, M. Watanabe, H. Nakamura, and M. Kimoto, 2019: A reconciledestimate of the influence of Arctic sea-ice loss on recent Eurasian cooling. Nat.Climate Change, 9, 123–129, l, B. C., and Coauthors, 2016: The Scenario Model Intercomparison Project (ScenarioMIP) for CMIP6. Geosci. Model Dev., 9, 3461–3482, https://doi.org/10.5194/gmd-9-3461-2016.Wang, Z., Y. Jiang, H. Wan, J. Yan, and X. Zhang, 2017: Detection and attributionof changes in extreme temperatures at regional scale. J. Climate, 30, 7035–7047, https://doi.org/10.1175/JCLI-D-15-0835.1.Zheng, F., and Coauthors, 2021: The 2020/21 extremely cold winter in China influenced by the synergistic effect of La Niña and warm Arctic. Adv. Atmos. Sci.,https://doi.org/10.1007/s00376-021-1033-y, in press.Zwiers, F., X. Zhang, and Y. Feng, 2011: Anthropogenic influence on long returnperiod daily temperature extremes at regional scales. J. Climate, 24, 881–892,https://doi.org/10.1175/2010JCLI3908.1.J A N UA RY 2 0 2 2S5
Information Science and Technology, Nanjing, China; Sun—Laboratory for Climate Studies, National Climate Center, China Meteorological Administration, Beijing, China; Zwiers—Pacific Climate Impacts Consortium, University of Vic - toria, Victoria, British Columbia, Canada, and Nanjing University of Information Science and