Transcription
International Journal of Scientific & Engineering Research, Volume 6, Issue 6, June-2015ISSN 2229-5518700A Comparative Study of Fasteners ToleranceAnalysis MethodsRaghavendra Magadum, Prof. B.S. AllurkarAbstract— Threaded fasteners have rendered themselves indispensable in the assembly of mechanical systems and structures due totheir ease of disassembly and their relatively low cost. The outstanding feature of threaded fasteners is that, in spite of their designsimplicity, they provide a high clamping force [1]. A comprehensive literature study has been carried out in [2] describing the history as wellas evolution of threaded fasteners.This paper reviews various approaches like 1. One-dimensional tolerance analysis method 2. Tolerance analysis by parametric method 3.Tolerance analysis by Quickie method and compares them for Fasteners studies.With the increase in competition in today’s marketplace, small savings in cost or small increases in performance may determine thesuccess of a product. Increasing demand for preeminent eminence products and the highly growing necessities in manufacturing formechanization, tolerance stack-up analysis has become very susceptible and essential concern in item for consumption development. Thestack-up of tolerance is significant for functionality of the mechanical assemblies also at the same time optimizing the cost of the system.Many industries like automotive, construction, aerospace, agriculture etc., are conscious of the importance of the Geometric Dimensioningand Tolerancing (GD&T) and rigorously practicing it in their product design. This paper specifically focuses on above methods for fastenerstolerance stack-up analysis.Tolerance charts deals with worst case tolerance analysis in one direction at a time and pay no attention to the potential contributions fromthe other directions. Manual charting is error prone and tiresome; hence, efforts have been made for computerization. Parametricconstraint solving method is used in parametric approach tolerance analysis, its intrinsic negative aspect is that the accurateness of thesimulation results are dependent on the user defined modeling method, and its incapability to integrate all set of laws from ASME Y14.5standard. The Quickie method [3] used towards tolerance stack-up analysis for geometric tolerances. Automation of stack-up of geometrictolerances can be used for tolerance distribution on the components as well as their assemblies considering the functionality of the system.Labeling, modeling, formulation and evaluation are the steps followed in this method, which makes the process of carrying out toleranceanalysis even for fasteners applications, lengthier. Other processes like Generic capsule method [9] and Catena method [10] are also beenstudied, but being similar to Quickie method they are being not contained in this paper. Regardless of the shortcomings of each one ofthese tolerance analysis methods, each may be used to provide reasonable results under certain conditions and hence need forcomputerization of methodology for geometric tolerance stack-up of fasteners assemblies has emerged out as the outcome of the threemethods being studied.IJSERIndex Terms— Dimensional Variation Analysis, Fasteners Stacks, GD&T, Tolerance Stackup.—————————— ——————————1 INTRODUCTIONGD&T is the method for specifying dimensional tolerancingand geometric tolerancing as per the ASME Y14.5 [4] and ISO1101 [5] standards. GD&T includes geometric tolerances ofform, orientation, location, runout and profile. Tolerance is thetotal amount that a specific feature is permitted to vary, it isthe difference between the maximum and minimum limits [1],and hence, tolerance stackup deals with the variation limits inmachining. Geometric variations are inevitably introducedduring the part manufacturing, the assembly, and the productuse. Since these geometric deviations influence the quality andfunction of mechanical products, geometric variations management is an important issue for quality-aware companies inall phases of the product life-cycle and gains in importance incustom-made product �——— Raghavendra Magadum is currently pursuing masters degree program inManufacturing Processing Engineering in BAMU University,Aurangabad, India Prof. B.S. Allurkar is a professor is COE Ambajogai, affiliated to BAMUUniversity, Aurangabad, India.Because of uncertainties in manufacturing processes, a mechanical part always shows variations in its geometrical characteristics (ex. form, dimension, orientation and position).Quality then often reflect how well tolerances and hence, functional requirements, are being achieved by the manufacturingprocesses in the final product. Manufactured parts are infrequently used as single parts but are to a certain extent used inassemblies. Individual parts with tolerances specified to eachof their features are therefore likely to accumulate toleranceswhen they are being assembled, causing the overall assemblydimensions to vary according to the number of contributionsources of variation. Thus the process of captivating knowntolerances and analyzing the combination of these tolerancesin an assembly level is known as tolerance analysis [6]. Theimportant objective of the tolerance analysis is to check theextent and nature of the variation of an analyzed dimension orgeometric feature. The variation of the analyzed dimensionarises from the accumulation of dimensional and or geometricvariations in the tolerance chain.IJSER 2015http://www.ijser.org
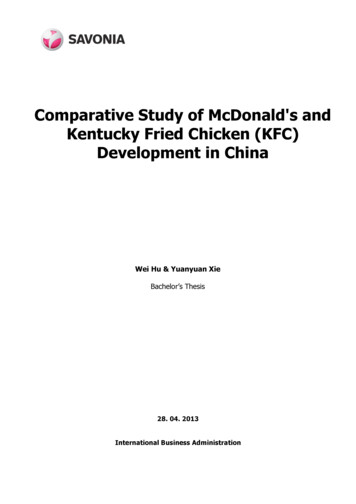
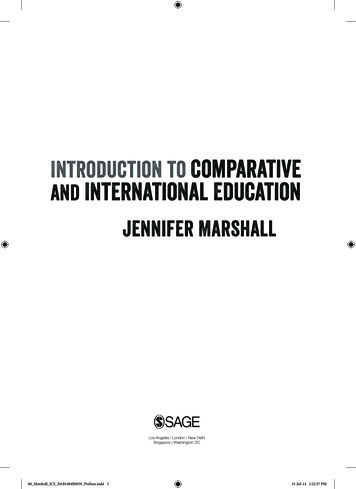
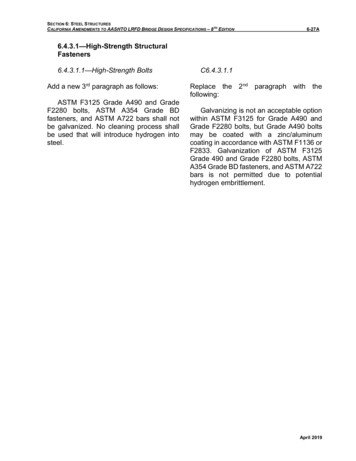
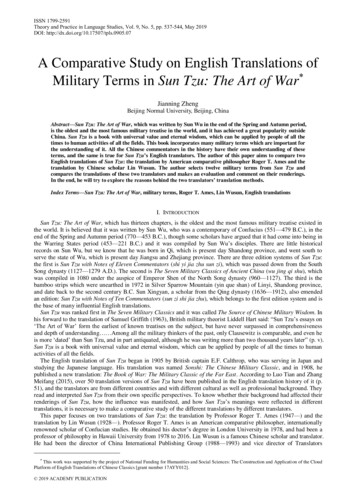
International Journal of Scientific & Engineering Research, Volume 6, Issue 6, June-2015ISSN 2229-5518At the present time, three different and incoherent communities (i.e. designers/engineering analysts, manufacturing engineering & inspection or quality engineering) are enormouslyusing different tools and techniques for tolerance analysis.Cultural and educational differences between these communities, has isolated them from one other and made them unacquainted of others’ techniques. Currently very few CAD systems propose assistance in the difficult task of Tolerancing.2 1D TOLERANCE CHARTING METHODTolerance charting is a simple technique that is often used inthe industry. However this technique can be improved by using other capability models in machining processes. Manualbookkeeping procedure for 1D stack calculation is commonlyreferred to as a tolerance charting method. The designers/analysts commonly work with engineering drawing creation and or modification and can interpret ASME Y14.5 [4]symbols. From mathematical point of view, tolerance chartingdetermines equivalence between design tolerances and working tolerances, and the process takes place in several steps oriterations. Since the method is limited to worst-case toleranceanalysis, the analyst arranges parts in assemblies to theirworst conditions (minimum or maximum value of the analyzed dimension), this means, separate charts have to be putup for each worst case condition. One enters GD&T values intwo columns according to the rules for handling each type oftolerance. Since no algebraic expression for the analyzed dimension in terms of the contributors is produced by thismethod, no statistical analysis can be executed. Also, contributors not in the direction of analysis are ignored, which mayresult significant miscalculation in most cases.701of design tolerance charts includes both dimensional and geometric tolerances in the direction of analysis. The procedurefor 1D manual tolerance chart construction can be summarized as follows [11].2.1 Document the stack objective:To document the stack objective, write a one sentence description of the stack. Then label the stack on a picture of the partor assembly.Label the start point and directions of the stack:The start point of the stack is always one of the part featureswe named. The end point is the other. A stack indicator isadded at the start point of the stack. A stack indicator is a pairof opposing arrows with positive “ ” and negative “-” assigned to each row.Directions are assigned to the stack indicator as follows. Thearrow pointing toward the end point of the stack is “ ”. Thearrow pointing away from the end point is “-”. Therefore,when the end point is toward the right of the start point, thestack indicator would look like thisIJSERFig. 2. Stack Indicator SymbolThe stack indicator serves two important purposes:1.It shows when to add or subtract in the stack calculation. If a part dimension is going in the “ ” directionit is added in the stack. If a part dimension is going inthe “-” direction it is subtracted in the stack.2.It helps to interpret the stack answer. If the answer ispositive “ ” then the end point is in the positive “ ”direction relative to the start point. If the answer isnegative “-” then the end point is in the negative “-”direction relative to the start point.In reality, it does not matter which feature is the start pointand which is the end point; the answer will be the same eitherway. But for simplicity, below rules are universally followed.Axial stacks start on the left & radial stacks start on the bottom, to get the stack result as a positive answer.Fig. 1. The tolerance analysis maze [7]Procedure: As one of the most commonly used tools for tolerance analysis, manual tolerance charting is often chosen bydraftsmen and designers in industry to conduct tolerancestackup analysis. A stack (also known as continuous tolerancechain) is used to calculate the maximum and/or the minimumdistances (interference or clearance) between two features (i.e.,dimensioned and toleranced surfaces, or edges, etc.) on a partor in an assembly. Manual tolerance charts handling only dimensional tolerances have been used in design and in machining process planning for a long time [8]. The modern versionIJSER 2015http://www.ijser.org
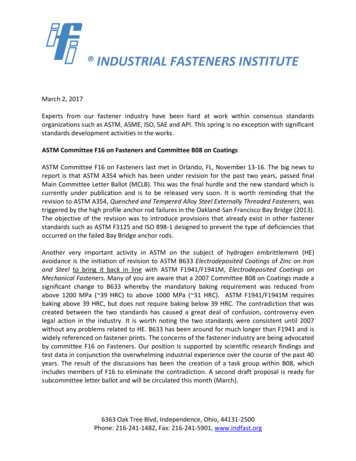
International Journal of Scientific & Engineering Research, Volume 6, Issue 6, June-2015ISSN 2229-5518a) Axial Stackb)702Radial StackFig. 3. Rules for setting up the coordinate systema)Min overlap arrangement2.2 Identify the stack path:A stack path is a series or chain of distances (part dimensions)from the start point of the stack to the end point of the stack.This chain of distances must:1.Consist only of known distances – which are dimensions on the drawing or a value calculated from dimensions on the drawing or a value calculated fromdimensions on the drawing.2.Be the shortest possible chain of distances from thestart point to the end point.3.IJSERBe continuous – each distance must begin where theprevious distance ends.To identify stack path:Locate the shortest continuous chain of distances, as definedby dimensions or values calculated from dimensions, from thestart point to the end point. Mark each of these distances onthe sketch with a line. Place a dot where the distance beginsand an arrow where it ends. Label each distance with a codeletter: A, B, C and so on.2.3 Perform the math:Now transfer the distances from the stack path onto the stackform. This action involves entering each distance from thestack path into the appropriate columns on the stack form. Thestack indicator shows whether the number will be added orsubtracted in the stack. The column headings show you whichcolumn to put the numbers in. For positive values the maxgoes in the left column and the min in the right column. Fornegative values the min goes in the left column and the max inthe right column.Add each column of numbers. Write the answers in the subtotals boxes. Check the subtotals. The difference between themax and the min subtotals should equal the tolerance subtotal.Evaluate the answer. Bring down the subtotal into the answerbox. A positive answer is almost always good news. It meansclearance (or the min thickness or min machine stock) orwhatever the stack objective was.b)Max overlap arrangementFig. 4. Different configurations for maximum and minimum distance stackup analysis in an assemblyTolerance analysis can be conducted at the part or assemblylevel; the difference is that for assembly level stackup, the constituent parts must be first arranged to reflect one of the extreme conditions (i.e., either maximum or minimum) beingcalculated. This is achieved by arranging the parts corresponding to one of the extreme configurations. Each part is placedagainst mating parts in one of its extreme positions. Anotherdifference is that for assembly level stackup, the worst casesusually require two separate charts, while for part-level stackup they are obtained from a single chart. For example, the assembly shown in Fig. 4 requires two separate charts for maximum and minimum stackup analysis. Cross marks (X) in Fig.4 stand for a “touching” mating condition.3 TOLERANCE STACKUP ANALYSIS BY PARAMETRICMETHODCurrent major CAT packages include VisVSA from UGS, 3DCS from Dimensional Control Systems Inc., and CETOLfrom Sigmetrix LLC. Some other computer aided design(CAD) systems such as IDEAS (IDEAS is also a registeredtrademark of UGS) from UGS also have tolerance analysismodules. Of all these packages, the first two (VisVSA, 3-DCS,Mechanical Advantage) and the new version CETOL can bebroadly classified as one category [12].IJSER 2015http://www.ijser.org
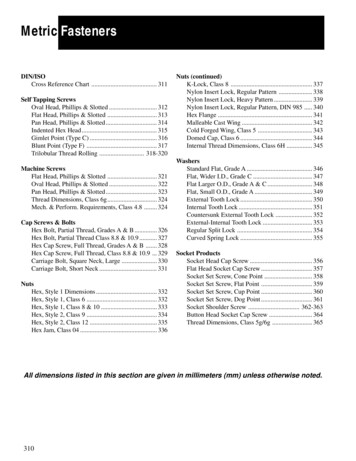
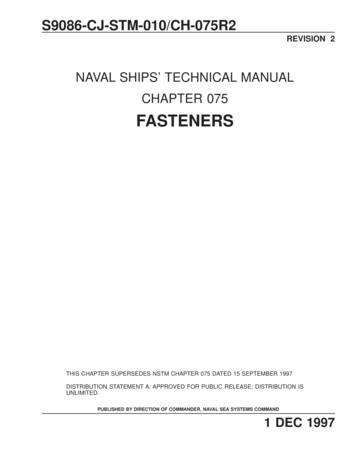
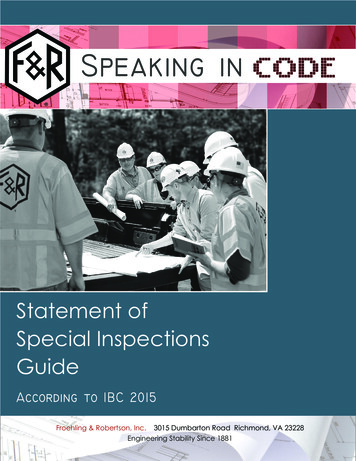
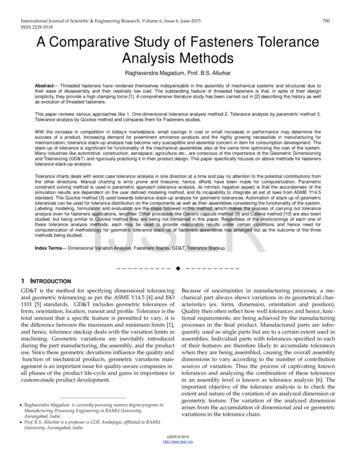
International Journal of Scientific & Engineering Research, Volume 6, Issue 6, June-2015ISSN 2229-5518Variation Analysis (VSA) is a powerful dimensional analysistool used to simulate manufacturing and assembly processesand predict the amounts and causes of variation. A digitalprototype is used to create a comprehensive representation ofgeometry, product variation (tolerances), assembly processvariation (sequence, assembly attachment definition, tooling)and measurements. This model is used to predict if there willbe any assembly build problems, before any physical parts aremade or tooling is cut.Most CAT packages take advantage of the same parametric/variational approach used in CAD systems and apply theMonte Carlo simulation to tolerance analysis [13–15]. This section will give a brief description of parametric approach totolerance analysis.In the parametric approach, the analyzed dimension is expressed as an algebraic function (an equation, or a set of equations) that relates the analyzed dimension to those on which itdepends (i.e., contributors). The function is either linearized ordirectly used for the Monte Carlo simulation in the nonlinearanalysis. Results commonly available are the lists of contributors, sensitivities, and percentage contributions, and the tolerance accumulation for worst-case and statistical cases.703Figure 5 shows the steps of the Linearized Method. Step 1 isthe calculation of the sensitivities. Step 2 used to calculate theStandard Deviation. A step 3 applies a Normal distributionassumption to the Standard Deviation calculated in Step 2.Finally, Step 4 calculates the rejects given the Normal distribution and specification limits.3.2 Nonlinearized Tolerance Analysis:When linearized analysis is not applicable, nonlinear analysis,which is usually accomplished via the Monte Carlo simulation, is used instead. The Monte Carlo simulation method isbased on the use of a random number generator to simulatethe effects of manufacturing variations on assemblies and/orparts. Monte Carlo simulation is a random number basedmethod for performing assembly tolerance analysis. The manufacture of an assembly is simulated, for example, by creating a set of component dimensions with small randomchanges to simulate natural process variations.Next, theresulting assembly dimensions are calculated from the simulated set of component dimensions. The number of rejectsthat fall outside the specification limits are then counted.These three steps are illustrated in Fig. 6.IJSER3.1 Linearized Tolerance Analysis:The Linearized Method is a vector-loop-based method of assembly tolerance analysis. The method’s name comes from thefact that the nonlinear equations of the vector-loop model arelinearized for the analysis. The linearized equations determinehow small changes of the component dimensions, form andcontact affect an assembly. For this method only one assemblyneeds to be analyzed statistically. Linear analysis is extremelyfast and allows for tolerance allocation and design iteration. Itis, however, limited to normal component distributions [16].In this type of analysis, partial derivatives are calculated foreach contributor; the derivatives give the sensitivity for eachcontributor from which worst case and variance can be determined.Fig. 6. Steps of the Monte Carlo simulation4 TOLERANCE STACKUP ANALYSIS BY QUICKIEMETHODIn this method, the steps to be followed are labelling‚ modeling, formulation and evaluation. Firstly, the surfaces dimensioned are labeled as shown in Figure 7. The part number forthe fastener is 1 while the part number for the clearance holepart is 2.Fig. 5. Steps of the linearized methodIJSER 2015http://www.ijser.org
International Journal of Scientific & Engineering Research, Volume 6, Issue 6, June-2015ISSN 2229-5518a) Min overlap arrangement704b)Table for Max overlap arrangementFig. 9. Tabulation for assemblyb)5 SUMMARY AND CONCLUSIONMax overlap arrangementFig. 7. Features numbered from left to right of the assemblyHaving completed the labeling phase, the graphical modelcan then be constructed as shown in Figure 8. In the case ofan assembly, the graphical model is constructed part by part.The two part models are then linked together by dashed linethat represents surface contact.a)b)IJSERMin overlap arrangementMin overlap arrangementFig. 8. Graphical model for assemblyUpon the completion of the model, the stack path isidentified which passes through the dashed line that connectsbetween 1D and 2B for minimum overlap arrangement and itconnects between 1C and 2A for maximum overlap arrangement of the assembly .After second step, the third step will be of forming the tabulation for both the min and max arrangements as shown belowin Figure 9.a)The one dimensional tolerance charting method can take intoconsideration both dimensional and geometric tolerances andis consistent with the Y14.5 standard also is appropriate forboth part and assembly level tolerance stacks. Since it is comparatively easy to understand and use, manual tolerancecharting has been extensively used. The boundaries relatedwith this method, as practiced today, are as follows. (1) It isdone manually, and the user must be remembering all theY14.5 standard rules for performing the stacks and their correct application which makes this process error prone. (2) Itcreates stacks in one direction and ignores other possible directions contributions, and may lead towards wrong results.(3) This process cannot be made to be available automaticallywith the CAD tools. (4) Process is capable of handling onlyworst case tolerance stacks and not RSS stacks.Table for Min overlap arrangementParametric tolerance analysis method basis its theory from theestablished parametric CAD, and is uncomplicated to combinewith CAD system. The boundaries related with this methodare (1) The limits applied to the model variables (e.g., featuresize and location) do not essentially communicate directly tothe tolerances that are specified on the drawings. This approach is incapable especially when datum precedence, material modifier condition, form tolerances are involved in thetolerance callouts. (2) Additional constraints—e.g., flatness,straightness and parallelism, are extra tolerances in addition toplus/minus size/dimensional tolerances—cannot be handledin this approach, especially when the linearized analyses areused.The Quickie tolerance analysis method presents efficient andeffective graphical methods for evaluating tolerance stack upproblems. This method is simple, straightforward and easy toapply for simpler tolerance applications. The models constructed are graphical replica of the geometrical relationshipbetween the part features in the assembly. Using these models,the tolerance stack up can be done. These stack ups willassist the designers in evaluating the relative effect of individual tolerances and making necessary changes in early stageof design. The boundaries related with this method are (1) Itis done manually, and the user must be remembering all theY14.5 standard rules for performing the stacks and their correct application which makes this process error prone. (2) ThisIJSER 2015http://www.ijser.org
International Journal of Scientific & Engineering Research, Volume 6, Issue 6, June-2015705ISSN 2229-5518process cannot be made to be available automatically with the [11] Krulikowski. A., 2002, “Tolerance Stacks-A Self-Study Course”, Effective Training Inc., Westland, MI 48186.CAD tools.[12] Prisco. U., and Giorleo. G., 2002, “Overview of current CAT systems”, Computer Aided Engineering Journal, 9, pp. 373-387.An automatic system has been developed. Shen et al. [17] present methods to automate 1D tolerance charting for both [13] Shen. Z., 2003, “Software Review-Tolerance analysis with EDS/VisVSA”,ASME Journal of Computer Information Science Engineering., Special Issue onworst-case and statistical tolerance analysis, conforming to theGD&T, 3(1), pp. 95-99.ASME Y14.5 standard. Automated charting relieves the userfrom the slow, tedious, and error-prone manual construction [14] Chiesi. F., and Governi L., 2003, “Software Review-Tolerance analysis witheTol-Mate”, ASME Journal of Computer Information Science Engineering., Specialof the charts, and pro-charting method will remain popularIssueon GD&T, 3(1), pp. 100-105.within industry, due to its simplicity, ease of use, but still it[15]CharlesG. Glancy., and Kenneth W. Chase., DETC99/DAC-8707, “A Secondhas lot of limitations and need to consider modern geometricordermethodfor Assembly Tolerance Analysis”, Proceedings of the 1999tolerances, also when like simple fasteners are been specifiedASMEDesignEngineeringTechnical Conferences September 12-15, 1999, Las Vewith straightness to shank, position to head with respect togas,Nevada.shank and position to threads with respect to shank and thereceiving threaded hole is given a position callout with maxi- [16] Shen. Z., Shah. J. J., and Davidson. J. K., 2003, “Automation of Linear Toleerance Charts and Extension of Statistical Tolerance Analysis”, Proceedings ofmum material or least material modifier in the tolerance andthe ASME DETC 2003, 23rd CIE Conference, 2-6 Sept., 2003, Chicago, IL.datum compartments which leads to calculation of bonus tolerance and shift tolerances and incase of fastener the virtualboundaries are all need to be incorporated. The parametricapproach is incapable especially when datum precedence, material modifier condition, form tolerances are involved in thetolerance callouts. The Quickie method becomes too muchtedious and error prone when involved with additional formtolerances to the features and locational controls specified tothe features with maximum material modifiers in both tolerance and datum compartments.References[1]IJSERB.S.C Ranjan, H.N. Vikranth and Ashitava Ghoshal, “A Novel PrevailingTorque Thread Fastener and Its Analysis” Journal of Mechanical Design, October 2013, Vol. 135 / 101007-1[2] Bhattacharya. A., Sen. A., and Das. S., 2010, “An Investigation on the AntiLoosening Characteric of the Threaded Fasteners under Vibratory Conditions”, Mech. Mach Theory 45, pp. 1215-1225.[3] B.K.A. Ngoi, C.S. Tan, L.C. Goh, “Graphical Approach to Assembly ToleranceStack Analysis-the ‘Quickie’ GDT method”, Proceedings of Institute of Mechanical Engineers, Vol. 211 Part B, 1997, pp. 463-472.[4] American National Standard ASME Y14.5 (2009) Dimensioning and Tolerancing, The American Society of Mechanical Engineers, New York.[5] ISO 1101/TC213 Geometrical product specification Geometic Tolerancing – Tolerances of form, orientation, location and run-out., International Standards Organization. Switzerland.[6] Alain Desrochers, “Application of a Unified Jacobian-Torsor Model for Tolerance Analysis”, Journal of Computing and Information Science in Engineering,March 2003, Vol. 3.[7] Shah. J., 2003, “Navigating the Tolerance Analysis Maze”, Tutorial Notes,ASME DETC 2002, Sept. 29-Oct. 2, Montreal, Canada[8] Zhengshu Shen, Gaurav Ameta, Jami J. Shah & Joseph K. Davidson., “AComparative Study of Tolerance Analysis Methods”, Journal of Computing andInformation Science in Engineering 2005, Vol. 5.[9] B.K.A Ngoi, A.M. Agarwal, C.S. Chua, “The Generic Capsule Approach toTolerance Stack Alalysis”, International Journal of Production Research, 36:12,2010, pp. 3273-3293.[10] B.K.A Ngoi, L.E.N. Lim, P.S. Ang, A.S.Ong, “Assembly Tolerance StackAnalysis for Geometric Characteristics in Form Control-the ‘Catena’ Method,International Journal of Advanced Manufacturing Technology, 15, 1999, pp. 292298.IJSER 2015http://www.ijser.org
Fig. 1. The tolerance analysis maze [7] Procedure: As one of the most commonly used tools for tol-erance analysis, manual tolerance charting is often chosen by draftsmen and designers in industry to conduct tolerance stackup analysis. A stack (also known as continuous tolerance c