Transcription
CRHCenter forRural HealthUniversity of North DakotaSchool of Medicine & Health SciencesPrevalence of Chronic Disease AmongAmerican Indian and Alaska Native EldersPatricia Moulton, Ph.D.Leander McDonald, Ph.D.Kyle Muus, Ph.D.Alana Knudson, Ph.D.Mary Wakefield, Ph.D., R.N.Richard Ludtke, Ph.D.October 2005Funding through the Office of Rural Health Policy,HRSA and the Administration on Aging.Connecting resources and knowledge to strengthenthe health of people in rural communities.
AcknowledgementsFunding for this report was provided by the Office of Rural Health Policy, Health Resourcesand Services Administration.The Native (American Indian and Alaska Native) elder data used in this project is from the"Identifying Our Needs: A Survey of Elders" needs assessment project funded through theAdministration on Aging (AoA) at the National Resource Center on Native American Aging.Questions about this report can be addressed to Dr. Patricia Moulton at 701-777-6781 orpmoulton@medicine.nodak.edu2
Table of ContentsPagesExecutive Summary .4Introduction .6Overall Findings . 9Demographics .10Rurality and Chronic Disease .11Gender and Chronic Disease .13Age and Chronic Disease . 14Results of Logistic Regression and Odds Ratios .15Overall Conclusions and Policy Recommendations .17References . .273
Executive SummaryThere is a paucity of information about the prevalence of chronic disease among AmericanIndian and Alaska Native populations with even less information available about rural/urbandifferences. Literature indicates associations between chronic disease and functionallimitation in relation to demographics, geography, health behaviors and access to healthservices among rural populations; however, what is not known is if these associations arealso present among American Indian and Alaska Native elder populations.To address this gap in research, the Center for Rural Health at the University of NorthDakota School of Medicine and Health Sciences applied for and received funding fromthe Office of Rural Health Policy (ORHP), Health Resources and Services Administration(HRSA), to conduct a secondary data analysis on Native elder data from the "Identifying OurNeeds: A Survey of Elders" needs assessment project funded through the Administration onAging (AoA) at the National Resource Center on Native American Aging (NRCNAA).The self-reported data represents 9,403 American Indian and Alaska Native elders from 171tribal nations, 11 of 12 Indian Health Service regions and 31 states. The Nativeelder data file was linked to the Area Resource File (2003) and frontier county codes(Frontier Education Center, 2004) to create a file that contained county level medicalresources information and an urban-rural-frontier variable. The file was analyzed todetermine if differences in prevalence of chronic disease and functional limitation inAmerican Indian elders are related to age (55-64, 65-74, 75-84 and 85 ), gender orgeographical location (urban vs. rural vs. frontier counties). Additional analyses exploreddifferences in relation to demographics, health behaviors, access to health care services,health care providers, and degree of functional limitation.Highlights of Overall Findings Native elders had a higher prevalence of arthritis, congestive heart failure, stroke,asthma, prostate cancer, high blood pressure and diabetes than the general populationages 55 and older (National Health and Nutrition Examination Survey III, 1988-1994)and a lower prevalence of severe functional limitation as compared with the generalpopulation ages 65 and over (National Long Term Care Survey, 1994). Female Native elders had a significantly higher prevalence of diabetes, high bloodpressure, other cancer (not including breast, colon/rectal and lung cancer), cataracts,asthma, arthritis and moderately severe to severe functional limitations. The prevalence of arthritis, congestive heart failure, stroke, cataracts, colon/rectalcancer, prostate cancer and functional limitation increased significantly with age;whereas the prevalence of asthma and diabetes decreased with age. Low income was associated with an increased prevalence of a functional limitation,arthritis, diabetes and stroke.4
Native elders who engaged in exercise were less likely to have functional limitations,diabetes and high blood pressure. Native elders who reported staying at least one night in a hospital in the past yearwere more likely to have a functional limitation, colon/rectal cancer, congestive heartfailure, diabetes, high blood pressure, lung cancer, other cancer, prostate cancer, andstroke. Native elders reported a number of co-morbidities; in addition the greater the numberof chronic diseases reported, the greater the number of functional limitationsexperienced.Overall Conclusions and Policy RecommendationsAn overall conclusion is that Indian Health Service regular appropriations and theIndian Health Care Improvement Act (IHCIA), primary sources of IHS funding,should be funded and reauthorized at an appropriate level to provide adequate healthservices to Native populations. The IHCIA is crucial to ensure that Native elders have fullaccess to critical health care services. IHS funding currently provides only 59% of thefunding needed to provide for health care services (IHS, 2005). The federal governmentactually budgeted nearly twice as much per capita for health care to federal prisoners, 3,803,compared to the IHS budget for American Indian and Alaska Native health care, 1,914(U.S. Commission on Civil Rights, 2003).Beyond this, given limited federal and tribal resources, targeted interventions need to bedeveloped and implemented to improve the health of American Indian and Alaska Nativeelders based on quantitative data. Findings from this project assist in determining where andwhat type of interventions would be most beneficial to improve the health of AmericanIndian and Alaska Native elders. Five conclusions have been drawn from the results of thisstudy and are presented with policy recommendations in this report.1. Increase disease prevention efforts including health promotion and wellness programs.2. Increase chronic disease management programs to prevent co-morbidity and increaseaccess to services.3. Increase availability of home/community based long-term care services in rural areas.4. Increase availability of health care services and homes which are equipped withnecessary plumbing and sanitation along with handicap accessibility to those Nativeelders living in rural reservation areas.5. Increase access to educational opportunities which would result in increased incomefor future generations of Native elders.5
INTRODUCTIONThere were 35 million individuals over age 65 in the United States in 2000, a 12% increasefrom 1990. The fastest growing segment in the U.S. population is individuals ages 85 andolder (U.S. Census Bureau, 2001). In rural areas, the elderly population has increased due toindividuals choosing to remain in their homes, younger people moving to metro areas, andolder people relocating to rural areas. In terms of gender, women comprise 53% of the ruralpopulation ages 60-64 and 63% of the 85 and older rural population (Rogers, 1999).Access to healthcare continues to pose a challenge for the nation’s growing rural elderlypopulations as limited medical resources in rural and frontier areas often require elderly totravel long distances in order to meet their health needs (Krout, 1994). About 1/5 of elderlyin the United States live in rural areas (Coburn & Bolda, 1999), and these rural elderly arenot only more likely to suffer from poor health, but they also tend to have less income andless education when compared to urban elderly (Coward et al., 1994). With aging, there isalso a rapid increase in the prevalence of a number of chronic diseases such as arthritis,Alzheimer's disease, cancer, heart disease, Parkinson's disease and stroke (Krishnan et al.,2002).Several chronic diseases can be attributed to health damaging behaviors including tobaccouse and obesity (Wakefield, 2002) and about 40% of deaths can be attributed to healthdamaging behaviors (McGinnis et al., 2002). Behavior is a particularly important focus forrural populations in general. For example, men and women in rural areas are more likely tosmoke than individuals living in more populated areas (National Center for Health Statistics,2001). Another health damaging behavior, heavy alcohol consumption has been found to bemore common in rural populations, non-Hispanic white, Hispanic and American Indians thanin other groups (National Center for Health Statistics, 2001).Health care problems facing rural white and minority populations such as African Americansand Hispanics are documented with regard to elder populations. However, little is knownregarding American Indian and Alaska Natives and even less is known about the relationshipbetween chronic disease and access to healthcare in this population. Although the percent ofAmerican Indian/Alaska Natives (includes those who also indicated another race) in ruralareas increased by 78% between 1990 and 2000, (Randolph, Gaul & Slifkin, 2002), nationalstudies focusing on health and access to health care rarely include Native populations. Thisis likely due to the expense of accessing small populations located in isolated areas. Or, ifNatives are included, the sample size is frequently insufficient for analysis.In terms of longevity, the Indian Health Service (IHS) Division of Statistics (1998), reportedthat overall life expectancy of American Indians (71.1 years) is lower than the U.S. generalpopulation life expectancy (76.9 years) for all races (National Center for Health Statistics,2000). American Indian life expectancy varies by regional area as do chronic disease ratesamong the Native elderly population (Ludtke, McDonald, & Allery, 2002). IHS Division ofStatistics reported a regional difference of as much as 12 years in American Indian lifeexpectancy between the California Indian Health Service Area (76.3 years) and the AberdeenIndian Health Service Area (64.3 years).6
Existing research related to American Indians documents the relationship between chronicdisease and mortality. Gillum (1995) analyzed data from the U.S. Vital Statistics System andtwo National Health and Nutrition Examination Surveys on the epidemiology of strokespecific to American Indian and Alaska Natives. Gillum found stroke to be a leading causeof death for American Indian and Alaska Natives in the 1990 data. Stroke as a cause of deathderives from various factors including hypertension and diabetes. According to Campbell(2002), female Oklahoma American Indians had a higher prevalence of obesity, high bloodpressure, diabetes, heart disease, heart attack and stroke than the general population. Tomas,McDonald and Ludtke (2003) also found that Native elder women were more likely to beobese and less likely to exercise.Lower life expectancy is correlated with higher chronic disease rates while the ability todiagnose and manage chronic disease is correlated with one’s ability to access health careservices in a timely manner. Increased morbidity related to access to primary, secondary,and tertiary healthcare are important concerns for all elderly in rural communities. RuralHealthy People 2010 (Gamm et al., 2003) identified access to health care as a top priority forrural America. The Institute of Medicine’s 2002 report indicated that access to healthcare isan important step in eliminating racial and ethnic health disparities. The U.S. Commissionon Civil Rights (2004) identified several social and cultural barriers affecting AmericanIndian and Alaska Natives including racial and ethnic bias and discrimination, patient healthbehaviors, environmental factors, delivery of health care in a culturally appropriate manner,language, poverty and education. Identified structural barriers included management ofdifferent types of IHS services, geographic location, wait times, age of facilities, providerturnover rates, retention and recruitment of qualified health providers, misdiagnosis or latediagnosis of disease and rationing of health services. In addition, increasing the vulnerabilityof Native elders are the high rates of poverty in many tribal populations. Research correlateslower health status with lower socio-economic status (Sternfeld et al., 2002).Characteristics of rural health delivery systems are often distinctly different from urbanhealth delivery systems and across rural areas there is considerable variation in healthinfrastructure. Futhermore, rural elders tend to use a different mix of health care servicesfrom their urban counterparts, such as higher rates of inpatient and outpatient hospitalservices and fewer visits to physicians (Medicare Payment Advisory Commission, 2001).The infrastructure of rural health care systems should meet the needs of individualcommunities, which can account for the wide variety of infrastructure. For example, ruralhospitals can range from a five bed Critical Access Hospital to a 250 bed rural regionalreferred hospital. These dynamics prompt an array of information needs and policy solutionsthat reflect both within-rural variation as well as rural-urban infrastructure differences. Inaddition, environmental features such as long distances, geographical barriers, diversecultures, poor economic conditions, and inadequate distribution of services and health careproviders often limit access to health care for many rural communities, (Congdon &Magilvy, 2001; Davis & Magilvy, 2000). The majority of reservations face similarchallenges in isolated rural areas.7
Native elders constitute one of the populations for which there is a paucity of data regardinghealth status, health care needs and capacity for self-care (e.g. functionality such as activitiesof daily living). There are currently 562 American Indian/Alaska Native federallyrecognized tribes in the United States. The federal government, because of numeroustreaties, provides healthcare to tribes through the IHS. Tribes have the option of managingtheir own portion of the IHS budget and 53% of the current IHS budget is managed by tribalhealth programs (IHS, 2004). The 2003 budget for IHS was 2.8 billion for the provision ofhealth care to approximately 1.5 million American Indian/Alaska Natives (IHS, 2003). Thereare approximately 4.1 million individuals who identify themselves as AmericanIndian/Alaska Native alone or in combination with other races (U.S. Census, 2002). IHSprovides health care services not only through over 500 hospitals and clinics located on ornear reservations (Forquera, 2001), but also contracts for specialty health services through offreservation vendors.Forty-nine percent of American Indian/Alaska Natives have private insurance coverage ascompared to 83% of Caucasians (Zuckerman et al., 2004). In addition, IHS requiresexhaustion of all other possible sources of funding before payment, making IHS a provider oflast resort (Kuschell-Haworth, 1999). Patients must first exhaust all health care resourcesavailable to them from such sources as private insurance, Medicare, or Medicaid (if they areeligible, they must apply for coverage) before IHS will consider payment. Those AmericanIndians/Alaska Natives with access to IHS, Medicare/Medicaid and private insurancecoverage tend to use IHS for routine medical care and use private insurance for morespecialized care (Dixon et al., 1997).The aim of this research was to examine whether potential differences in chronic diseaseprevalence among American Indian/Alaska Natives are related to rurality, gender, age, healthcare access or health behaviors. The study will serve as a foundation for long-term researchefforts focused on informing and aligning programs for evidence-based public policies tomeet the health care needs of American Indian/Alaska Native elders. This research willinform tribal, state and federal government in designing infrastructure for long-term care forAmerican Indians and Alaska Natives. Documenting general health status and the extent ofchronic disease is critical to defining the needs for health services among persons within thissubpopulation.8
OVERALL FINDINGSThe following narrative contains the results of a study that examined the prevalence ofchronic disease among American Indian/Alaska Natives using the NRCNAA Native Elderdata set. This data set includes self-reported information regarding general health statusincluding chronic disease, activities of daily living, instrumental activities of daily living,vision, hearing and dental, tobacco and alcohol usage, diet and exercise, social support,housing, occupational status and demographics. The question regarding chronic diseaseasked Native elders to indicate if a doctor had ever told them that they had any of thefollowing diseases: arthritis; congestive heart failure; stroke; asthma; cataracts; breastcancer; prostate cancer; colon/rectal cancer; lung cancer; other cancer; high blood pressure;and diabetes. Native elders (9,403) from 31 states and 11 of 12 Indian Health ServiceRegions are represented.This data set was linked with the Area Resource File (ARF, 2003) which provided healthcare access variables and urban influence codes (UIC) along with frontier county codes(Frontier Education Center, 2004). Frontier counties were determined by population densityand distance in miles and travel time in minutes from a market-service area. Elders weredivided into three categories: 1) urban elders, those that live in large or small metropolitanareas, UIC 1 and 2, 2) rural elders, those living in a non-metropolitan county, UIC 3-9 and 3)frontier elders, those that live in a non-metropolitan county and are classified as frontier.A limitation is that Urban Influence Codes are based on county population and do not takeinto account rural areas within a county coded as urban. Another limitation is that the data isrepresentative of elder populations on or around reservations and may not be representativeof Native elders residing in urban areas. For a complete description of the data set, analyticmodels and results, see our website at medicine.nodak.edu/crh.9
Demographics Demographics of the Native elder data set are presented in Table 1. Of a total of9,403 Native elders, the greatest percentage was female, between ages 55-64, had anincome between 5,000- 9,999 and lived in a frontier area. The most prevalentchronic diseases were high blood pressure, arthritis and diabetes.Table 1: DemographicsN%GenderMale3,59540%FemaleAge 7%4905% 5,0002,18926% 5,000 - 9,999 10,000 - 19,999Geographic ral2,59128%FrontierChronic Disease4,64151%High Blood ataracts1,92421%Congestive Heart Failure85 Personal Annual Income1,10412%Asthma94510%Stroke8659%Prostate Cancer (males)2637%Breast Cancer (females)Other Cancer2193174%3%Colorectal Cancer1452%771%Lung Cancer10
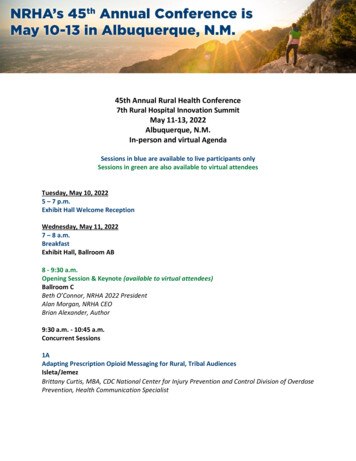
Rurality and Chronic Disease Native elders had a higher prevalence of arthritis, congestive heart failure, stroke,asthma, prostate cancer, high blood pressure and diabetes than the general populationages 55 and over (National Health and Nutrition Examination Survey III, 1988-1994).Native elders who lived in urban areas had a significantly higher prevalence ofcataracts and asthma as compared to rural and frontier Native elders. Elders wholived in urban and rural areas had a higher prevalence of other cancers as compared tothose living in frontier areas. A possible interpretation is that Native elders moved toareas with greater availability of medical services. A higher prevalence of high bloodpressure, arthritis and stroke was found in Native elders living in rural areas ascompared to elders living in frontier or urban areas (see Figure 1).Figure 1: Prevalence of Chronic Disease by Rurality and Compared to theGeneral PopulationArthritis *Congestive Heart FailureStroke *Asthma *Cataracts *Breast CancerProstate CancerColon/Rectal CancerLung CancerOther Cancer *High Blood Pressure %50%General Population Age 55 and OverNote. * Chi Square p .05. Females are excluded from the prostate cancer and males are excluded from thebreast cancer analysis.1160%
Native elders had a lower prevalence of severe functional limitation as compared withthe general population ages 65 and over (National Long Term Care Survey, 1994).Native elders in rural and frontier areas had a higher prevalence of functionallimitations as compared to urban elders (see Figure 2). Native elders with afunctional limitation may have returned home to the reservation so that familymembers could assist them.Figure 2: Prevalence of Functional Limitations by Rurality and Compared tothe General Populationseveremoderately rbanRural12FronterU.S. (65 )45%50%
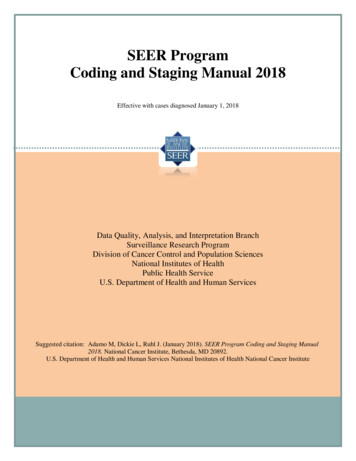
Gender and Chronic Disease Female Native elders had a significantly higher prevalence of diabetes, high bloodpressure, other cancer, cataracts, asthma and arthritis as compared to male elders.Male elders had a significantly higher prevalence of lung cancer than females (seeFigure 3).Figure 3: Prevalence of Chronic Disease by GenderDiabetes *High Blood Pressure *Other Cancer *Lung Cancer *Colon/Rectal CancerCataracts *Asthma *StrokeCongestive Heart Failure *Arthritis *0%10%20%30%40%50%60%PercentageMaleFemaleNote. * Chi Square p .05 Female Native elders had a greater prevalence of moderately severe and severefunctional limitation as compared to males (see Figure 4).Figure 4: Prevalence of Functional Limitation by Gendersevere*moderately MalesNote. * Chi Square p .0513Females45%50%
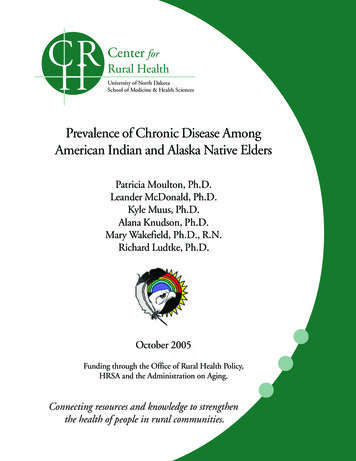
Age and Chronic Disease The prevalence of arthritis, congestive heart failure, stroke, cataracts, colon/rectalcancer and prostate cancer increased significantly with age. Asthma decreased withage and the oldest age group (ages 85 ) had the lowest prevalence of diabetes (seeFigure 5).Figure 5: Prevalence of Chronic Disease by Age Cohort60%50%40%30%20%55-6465-7475-84Diabetes *High Blood Pressure *Other CancerLung CancerColon/Rectal Cancer *Prostate Cancer *Breast CancerCataracts *Asthma *Stroke *Arthritis *0%Congestive Heart Failure *10%85 Note. * Chi Square p .05 Females are excluded from the prostate cancer and males are excluded from the breastcancer analysis. Prevalence of functional limitation increased with age. Native elders ages 85 andolder have the greatest prevalence for all levels of functional limitation (see Figure 6).Figure 6: Prevalence of Functional Limitation by Age Cohortsevere*moderately 7475-84Note. * Chi Square p .051485 30%35%40%45%50%
Results of Logistic Regression and Odds RatiosThe relationship between chronic disease and functional limitations and demographics,geographic location, health behaviors and health care access for Native elders wasdetermined using a series of logistic regression models (N 5,437). Only significant findingsare highlighted below. Demographics and Chronic Diseaseo Elders in the youngest age group (55-64 years) were more likely to haveasthma (171%) or diabetes (154%) than elders ages 85 and older.o Females were more likely to have arthritis (60%), asthma (50%), or cataracts(28%) and less likely to have congestive heart failure (61%) than males.o Elders with an elementary school education were more likely to have diabetes(42%) and those with an elementary or a high school education were morelikely to have high blood pressure (22%) than Native elders who havegraduated from college.o Low income (less than 5,000/year) was associated with an increasedprevalence of a functional limitation (114%), arthritis (24%), diabetes (47%)or stroke (66%) than elders with an income of over 20,000. Elders with anincome of 5,000- 10,000 per year were more likely to have a functionallimitation (114%), arthritis (24%), diabetes (51%) or a stroke (72%) thanelders with an income of over 20,000. Rurality and Chronic Diseaseo Rurality of residential location was also a predictor of chronic disease. Ruralelders were more likely to have high blood pressure (16%) or a stroke (49%)and urban elders were more likely to have had a stroke (69%) than frontierelders. Health Behaviors and Chronic Diseaseo Current tobacco users were more likely to have arthritis (29%) and were lesslikely to have diabetes (30%).o Elders who reported walking a mile or more at least one time in the last monthwere less likely to have a functional limitation (70%). Native elders whoengaged in aerobics or dancing were less likely to have high blood pressure(67%). Those elders who reported gardening were less likely to have afunctional limitation (39%) and diabetes (45%).15
Health Care Access/Utilization and Chronic Diseaseo Native elders who reported staying at least one night in a hospital in the pastyear were more likely to have a functional limitation (192%), congestive heartfailure (122%), diabetes (34%), high blood pressure (18%), stroke (63%),colon/rectal cancer (145%), lung cancer (129%), prostate cancer (113%) andother cancer (82%). Co-Morbidity and Chronic Diseaseo The chronic diseases that were most prevalent among Native elders includedhigh blood pressure (50%), arthritis (47%), and diabetes (38%). Thesediseases were more prevalent among Native elders than their counterparts inthe general population over 64 years of age. Several significant co-morbidrelationships were found among chronic diseases. Chronic disease clusters ofparticular note were diabetes/high blood pressure, congestive heartfailure/high blood pressure, lung cancer/colorectal cancer and stroke/highblood pressure/diabetes. Having multiple chronic diseases had an adverseeffect on elders’ functional capabilities. The greater the number of diseasesindicated by Native elders, the greater the likelihood of functional limitations.Native elders who had arthritis or a stroke were the most likely to indicatehaving functional limitations.16
OVERALL CONCLUSIONS AND POLICY RECOMMENDATIONSThe protection of community wellness, prevention of disease and injury, the understanding ofthe impact of the environment on individual and community health, and the notion ofwellness as integrally tied to spiritual, physical, mental, and social harmony are all keyelements of Native value systems, and of public health. Given limited federal and tribalresources, targeted interventions need to be developed and implemented to improve thehealth of American Indian and Alaska Native elders based on quantitative data. Findingsfrom this project assist in determining where and what type of interventions would be mostbeneficial to improve the health of American Indian and Alaska Native elders. Fiveconclusions have been drawn from the results of this study. Each of these conclusions ispresented below with supporting data and policy implications.The first and most important step to improving the health status of Native elders isensuring that Indian Health Service regular appropriations and the Indian Health CareImprovement Act (IHCIA), primary sources of IHS funding, are funded andreauthorized at an appropriate level to provide adequate health services to Nativepopulations. The Indian Health Service’s mandate is to provide health care services tomembers of all federally-recognized tribes. The unique relationship between sovereignNative American tribes and the U.S. federal government was established through a series oftreaties, court decisions, and executive orders over the past 200 years. The Indian SelfDetermination and Education Assistance Act of 1975 allow tribes to elect to assumeresponsibility and administration of their health care services or to remain within the IHSsystem.IHS funding currently provides only 59% of the funding needed to provide for health careservices (IHS, 2005). The federal government actually budgeted nearly twice as much percapita for health care to federal prisoners, 3,803, compared to the IHS budget for AmericanIndian and Alaska Native health care, 1,914 (U.S. Commission on Civil Rights, 2003). Fullfunding of IHS is critical in order to ensure basic health care access to Native elders, beforeany of the suggested programs outlined below can be effective.17
1. Increase disease prevention efforts including health promotion and wellnessprograms.RationaleThirty-eight percent of Native elders are obese compared to 18% of the generalpopulation, ages 55 and older. Body mass index was identified as a factor in theprevalence of arthritis, asthma, diabetes, and high blood pressure in Native elders. Inaddition, some form of exercise was associated with a decreased likelihood of havingdiabetes, a functional limitation and high blood pressure.Policy Recommendations Federal agencies including the Indian Health Service (IHS), Administrationon Aging (AoA), Centers for Disease Control (CDC), Health Resources andServices Administration (HRSA), Bureau of Indian Affairs (BIA),Administration on Native Americans (ANA) and the Agency for HealthcareResearch and Quality (AHRQ) should allocate resources to develop andevaluate wellness programs that focus on healthy eating choices and physicalactivity for American Indians and Alaska Natives using a multigenerationalapproach. Addressing these issues through a community environmentperspective, may have the most positive impact on the health of all AmericanIndians and Alaska Natives. Wellness programs such as Minnesota’s WisdomSteps represent interventions that could potentially serve as models for thenation’s
(Frontier Education Center, 2004) to create a file that contained county level medical resources information and an urban-rural-frontier variable. The file was analyzed to . asthma, prostate cancer, high blood pressure and diabetes than the general population ages 55 and older (National Health and Nutrition Examination Survey III, 1988-1994)