Transcription
NICE PUBLIC SAFETY SOLUTIONSNICE INFORM REPORTER USERGUIDERelease 9.1November 2019Copyright 2019. All rights reserved.
Important NoticeSubject always to any existing terms and conditions agreed between you and NICE or any Affiliate with respect to the productswhich are the subject matter of this document. Neither NICE nor any of its Affiliates shall bear any responsibility or liability to a clientor to any person or entity with respect to liability, loss or damage caused or alleged to be caused directly or indirectly by any productsupplied or any reliance placed on the content of this document. This includes, but is not limited to, any interruption of service, lossof business or anticipatory profits or consequential damage resulting from the use or operation of any products supplied or thecontent of this document. Information in this document is subject to change without notice and does not represent a commitment onthe part of NICE or any Affiliate.All information included in this document, such as text, graphics, photos, logos and images, is the exclusive property of NICE or anAffiliate and is protected by United States and international copyright laws. Permission is granted to use, view and photocopy (orprint) materials from this document only in connection with the products to which this document relates and subject to the terms oflicense applicable to such products. Any other use, copying, distribution, retransmission or modification of the information in thisdocument without the express prior written permission of NICE or an Affiliate is strictly prohibited. In the event of any permittedcopying, redistribution or publication of copyrighted material, no changes in, or deletion of, author attribution, trademark legend orcopyright notice shall be made.Products supplied may be protected by one or more of the US patents listed at http://www.nice.com/patents.For the full list of trademarks of NICE and its Affiliates, visit http://www.nice.com/Nice-Trademarks. All other marks used are theproperty of their respective proprietors.Part number: OM812-120-09-01-02-01Date: November 2019MSR2437 Rev17
Contents1234Welcome . 11.1Navigating NICE Inform Reporter . 21.2Adding and removing items . 3Reports view . 42.1Reports table . 52.2Public Reports table . 62.3Reports and Public Reports view . 72.4Report templates . 8Dashboard view . 123.1Setting Dashboard preferences. 15Reporter button bars and context menus . 174.1Creating a new report from a template . 184.2Creating a new report from an existing report . 224.3Editing a report . 254.4Deleting a report . 274.5Running a report . 284.6Running all reports . 284.7Viewing a report . 284.8Refreshing all public reports . 294.9Saving a report . 294.10Printing a report . 304.11Emailing a report . 31
List of TablesTable 1-1: NICE Inform Reconstruction features . 2Table 2-1: Reports view features . 4Table 2-2: Reports table columns . 5Table 2-3: Public Reports table columns . 6Table 2-4: Call report templates . 8Table 2-5: Evaluation report templates . 10Table 4-1: Reporter button bars and context menus . 17List of FiguresFigure 1-1: Reporter main screen . 2Figure 2-1: Reports view . 4Figure 2-2: Report example . 7Figure 3-1: Dashboard view . 12Figure 3-2: Report example . 14
NICE PUBLIC SAFETY SOLUTIONSNICE INFORM REPORTER USER GUIDE1WelcomeWelcomeThe NICE Inform Reporter application is the statistical reporting tool for NICE Inform.It provides the ability to create and view reports on data from the following: NOTE:Data sources that are supported by NICE Inform.User evaluations that are created using NICE Inform Evaluator.You can create reports using resources, resource groups, users, user groups,and evaluation forms. However, you MUST be granted access to thesebefore you can create the report.Once a report has been created and run, it can be emailed and/or printed.NOTE:NICE Inform Reporter does NOT report on calls that started within the lasthour.Supported data sourcesThe following data sources are supported within NICE Inform Reporter: NOTE: NOTE:NICE Recording/NICE Inform Recorder.NLS audio data sources.NiceLog loggers only audio data sources are NOT supported in NICE InformReporter.NICE Interaction Management data sources (including NICE Perform and NICEPerform eXpress).NICE Inform Reporter will collect data from the warehouse start date. Toconfigure the warehouse start date, refer to Configuring Reporter warehouseand time zone in NICE Inform System Administration.All reports are displayed according to the Reporter reference time zone andNOT the time zone of the client. If the Reporter Reference time zone has notbeen set, a warning message is displayed each time the Reporter applicationis opened indicating that it has not been set. To set the Reference time zone,refer to Configuring Reporter Warehouse in NICE Inform SystemAdministration.Application privilegesTo use the Reporter application, you MUST have the required privilege allocated to you (seeApplication privileges in NICE Inform User Administration). If not, the Reporter option is notdisplayed in the Application selector bar when you log in.Page 1 of 31
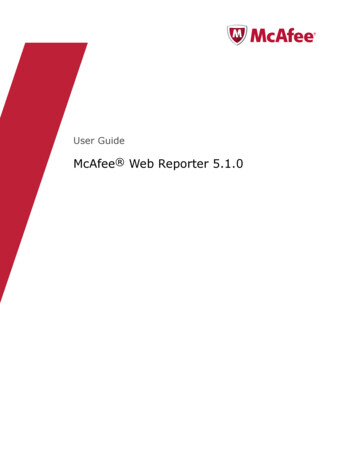
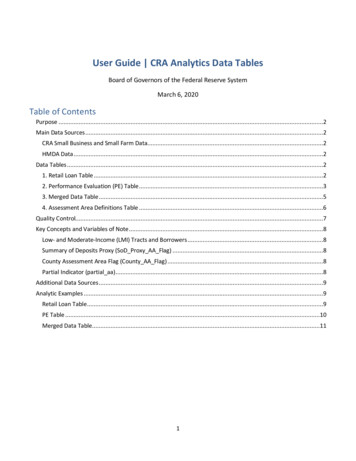
NICE PUBLIC SAFETY SOLUTIONSNICE INFORM REPORTER USER GUIDE1.1WelcomeNavigating NICE Inform ReporterThe NICE Inform Reporter application consists of two distinct panels which can bemaximized and minimized to provide the desired view:NOTE:Refer to the table below for a key to each feature.Figure 1-1: Reporter main screenTable 1-1: NICE Inform Reconstruction featuresFeature numberDescriptionDashboard view - displays regularly used reports. The Dashboard view is thedefault view which is always displayed when you open NICE Inform Reporter(refer to Dashboard view (see page 12))Reports view - enables you to view, run and configure reports (refer toReports view (see page 4)).Reporter preferences button - enables access to the Preferences control(refer to Setting Dashboard preferences (see page 15)).Page 2 of 31
NICE PUBLIC SAFETY SOLUTIONSNICE INFORM REPORTER USER GUIDETo minimize a panel, click thebutton associated with the panel that is open.To maximize a panel, click thebutton associated with the panel that is closed.NOTE:1.2WelcomeMaximizing the Reports view panel automatically minimizes the Dashboardview panel to provide as much screen as possible to display the Reports viewpanel. Similarly, when maximizing the Dashboard view panel, the Reportsview panel is minimized automatically.Adding and removing itemsAdding and removing items (e.g. resources, users or forms) to and from selected lists isfrequently used within NICE Inform Reporter. To add items to the list:1. Highlight the required item in the Available list.2. Click the Add button. The item is moved to the Selected list.3. Repeat for each required item. To remove items from the Selected list:1. Highlight the required item in the Selected list.2. Click the Remove button. The item is moved to the Available list.3. Repeat for each item required.–To move all items to the Selected list, click the Add All button.–To move all items from the Selected list, click the Remove All button.Additional Operations If you wish to select all but one or two items, click the Add All button to move allitems to the Selected list, then remove the items not required.The Quick Search facility enables you to find the required item. Enter the requiredtext in the box and click Go. The search returns all items containing that text as partof its name. The search is NOT case sensitive.Page 3 of 31
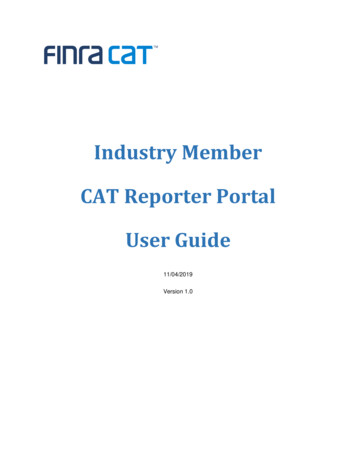
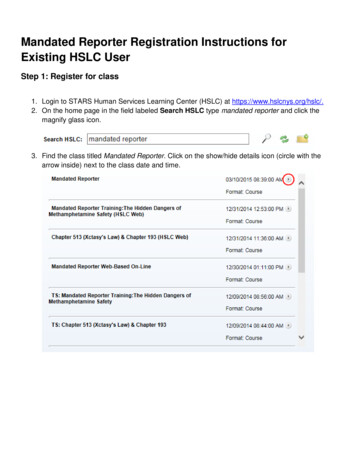
NICE PUBLIC SAFETY SOLUTIONSNICE INFORM REPORTER USER GUIDE2Reports viewReports viewNOTE:Refer to the table below for a key to each feature.Figure 2-1: Reports viewTable 2-1: Reports view featuresFeature numberDescriptionReports and Public Reports view - enables access to view reports you havecreated and/or public reports which are reports that had the Make reportpublic option set during its creation or during an edit (refer to Reports andPublic Reports view (see page 7))Reports table - displays all the reports that you have created (refer to Reportstable (see page 4)).Button bar (refer to Reporter button bar and context menu (see page 17)).Reporter preferences button - enables access to the Preferences control(refer to Setting Dashboard preferences (see page 15)).The Reports view enables you to: View, run and configure the reports that you have created using the Reports table(see page 4).View and run the reports that other NICE Inform Reporter users have created usingthe Public Reports table (see page 5).Once a report has been run or viewed within either the Reports or Public Reports table, thescreen changes to show the report (refer to Report and Public Report view (see page 7)).NOTE:All report data is based on the start times of the call records. For example, if areport has a data point per hour, then the value for any given hour is thenumber of calls that started within that hour.Page 4 of 31
NICE PUBLIC SAFETY SOLUTIONSNICE INFORM REPORTER USER GUIDE2.1Reports viewReports tableTo view the Reports table within the Reports view, select the Reportsoption.The Reports table displays all the reports that you have created.The following information is displayed within the Reports table:Table 2-2: Reports table columnsColumnDescriptionNameThe name created for the report.DescriptionThe description created for the report.StatusThe report status. It is only populated once it has been attempted to runa report. Otherwise this row is blank. The different status messagesare: Success - the report was successfully run.NOTE: The status resets the next time you edit the report.Running - the report is currently being run.Fail - the report failed to run.Last runThe date and time this report was last successfully run.Creation dateThe date and time the report was created.Report table button bar and context menusThere are a number of buttons and context menu options available in the Reports table.Refer to Reporter button bars and context menus (see page 17) for help as to each buttonand context menu function.Viewing or running a reportOnce you have run a report (refer to Running a report (see page 28)) or viewed a report thathas previously been run (refer to Viewing a report (see page 28)), the Reports table changesto display the report.Refer to Reports and Public Reports view (see page 7) for details of the report.Page 5 of 31
NICE PUBLIC SAFETY SOLUTIONSNICE INFORM REPORTER USER GUIDE2.2Reports viewPublic Reports tableTo view the Public Reports table within the Reports view, select the Public Reportsoption.The Public Reports table displays all the reports that have been created when the Makereport public option was selected (refer to Creating a new report from a template (see page18) or Creating a new report from an existing report (see page 21)). The user who createdthe report has full rights to the report but has provided it for public use so that other userscan run and view the report.The following information is displayed within the Public Reports table:Table 2-3: Public Reports table columnsColumnDescriptionNameThe name created for the report.DescriptionThe description created for the report.OwnerThe user that created the report and is the only person that can edit thereport (refer to Editing a report (see page 25)) and delete the report(refer to Deleting a report (see page 27)).StatusThe report status. It is only populated once it has been attempted to runa report. Otherwise this row is blank. The different status messagesare: Success - the report was successfully run.NOTE: The status resets the next time you edit the report.Running - the report is currently being run.Fail - the report failed to run.Last runThe date and time this report was last successfully run.Creation dateThe date and time the report was created.Public Reports table button bar and context menuThere are a number of buttons and context menu options available in the Public Reportstable. Refer to Reporter button bars and context menus (see page 17) for help as to eachbutton and context menu function.Viewing or running a reportOnce you have run a report (refer to Running a report (see page 28)) or viewed a report thathas previously been run (refer to Viewing a report (see page 28)), the Reports table changesto display the report.Refer to Reports and Public Reports view (see page 7) for details of the report.Page 6 of 31
NICE PUBLIC SAFETY SOLUTIONSNICE INFORM REPORTER USER GUIDE2.3Reports viewReports and Public Reports viewThe Reports or Public Reports view is displayed under the following conditions: Running a report (see page 28)Viewing a report (see page 28)Once a report has been run or viewed within either the Reports or Public Reports table, thescreen changes to show the report as shown here.Figure 2-2: Report exampleNOTE:NICE Inform Reporter does NOT report on calls that started within the lasthour.A report can be one of the following: Column chartClustered Column ChartStacked column chartLine chartPie chartTablePage 7 of 31
NICE PUBLIC SAFETY SOLUTIONSNICE INFORM REPORTER USER GUIDEReports viewReport detailsThe report is displayed with the X and Y axis and its name. These settings are all configuredwhen the report was created. In addition, time frame settings that were defined in the TimeFrame section when the report was created are displayed under the report name.NOTE:Hover the cursor over the column bar, line or pie chart segment and a tool tipis presented providing you with the exact value. For reports with multiple seriesof data or multiple colors (as for pie charts), the tool tip also provides the nameof the series/segment. For example, the Y axis value could be the resourcename and the X axis value could be the call count.Report table button barThere are a number of buttons and context menu options available in the Reports or PublicReports view. Refer to Reporter button bars and context menus (see page 17) for help as toeach button and context menu function.Closing the Reports or Public Reports viewClick the Close button to close the Reports or Public Reports view. The screen changesback to either the Reports table (see page 4) or Public Reports table (see page 5) dependingon what table you ran or viewed the report from initially.2.4Report templatesWhen creating a new report from a template (see page 18), there are a number of templatesto choose from.The following tables outline all the available report templates and provides a description ofwhat each one does.Call Report templatesNOTE:Call reports are based on the start time of the calls within the report.Table 2-4: Call report templatesCall report template nameDescriptionAverage call duration perresourceThe average call duration in seconds against resource (columnchart).Busiest radiosThe percentage utilization for the 10 busiest radios (column chart).NOTE:Busiest radios over timeOnly Radio resources with a reference type ofTalkgroup ID are selected in the query.The percentage utilization for the 10 busiest radios against time (linechart).NOTE:This report is ONLY applicable to radioresources.Call activity over timeThe call count against time, aggregated for all selected resources(column chart).Call activity over time perThe call count for each resource against time (line chart)Page 8 of 31
NICE PUBLIC SAFETY SOLUTIONSNICE INFORM REPORTER USER GUIDECall report template nameReports viewDescriptionresourceCall activity per hour of the day The sum of call counts per hour of the day over the selected timeperiod (column chart).NOTE:When creating the report the Time Framesection ONLY allows whole days to beselected.Call activity per resourceThe call count against resource (column chart).Most rejected radiosThe count of rejected recordings for the 10 radios with the mostrejections (column chart).NOTE:Radio call activity by typeThe call count for each call type (pie chart).NOTE:Radio call activity by type overtimeOnly Radio type resources with a referencetype of Talkgroup ID are selected in the query.The event count for each event type (pie chart).NOTE:Radio event activity by typeover timeThis report is ONLY applicable to radioresources.The total call duration in seconds for each call type against timedivided in to (stacked column chart).NOTE:Radio event activity by typeOnly Radio type resources with a referencetype of Talkgroup ID are selected in the query.The event count for each event type against time (stacked columnchart).NOTE:Radio call duration by typeover timeOnly Radio type resources with a referencetype of Talkgroup ID are selected in the query.This report is ONLY applicable to radioresources.The event count for each event type against time (stacked columnchart).NOTE:This report is ONLY applicable to radioresources.Resource utilizationThe percentage utilization against resource (column chart).Resource utilization per hourof the dayThe percentage utilization averaged over resources for each hour ofthe day over the selected time period (column chart).Page 9 of 31
NICE PUBLIC SAFETY SOLUTIONSNICE INFORM REPORTER USER GUIDEReports viewEvaluation report templatesThe following conditions apply to report templates based on evaluations: Evaluator report templates are ONLY listed if you are licensed for NICE InformEvaluator.Evaluation reports are based on the start time of the earliest item within theevaluation and not the time when the evaluation was created.Evaluations in the Incomplete, In progress and Awaiting review states are ignored inthe report.Table 2-5: Evaluation report templatesEvaluation report template nameDescriptionAverage evaluation score perquestion responseThe average score grouped by response to the selectedquestion (column chart).NOTE:Any n/a answers and conditionalresponses made when performingevaluations that are being reported onare not included in the report.Average score per operatorThe average evaluation percentage score per specifiedoperator for a single form (column chart).Average score per questionThe average score for each question on a single form for thespecified operators (column chart).NOTE:Average score per question peroperatorThe average score for each question on a single form foreach of the specified operators (clustered column chart).NOTE:Average score per question per usergroupAny n/a answers and conditionalresponses made when performingevaluations that are being reported onare not included in the report.Any n/a answers and conditionalresponses made when performingevaluations that are being reported onare not included in the report.The average score for each question on a single form foreach of the specified user groups (clustered column chart).NOTE:Any n/a answers and conditionalresponses made when performingevaluations that are being reported onare not included in the report.Average score per sectionThe average score for each section on a single form for thespecified operators (column chart).Average score per section peroperatorThe average evaluation percentage score for each section ona single form for each of the specified operators (clusteredcolumn chart).Page 10 of 31
NICE PUBLIC SAFETY SOLUTIONSNICE INFORM REPORTER USER GUIDEReports viewEvaluation report template nameDescriptionAverage score per section per usergroupThe average score for each section on a single form for eachof the specified user groups (clustered column chart).Average score per user groupThe average evaluation percentage score per specified usergroup for a single form (column chart).Individual scores per questionThe evaluation scores for each question on a single form forthe specified operators (table).NOTE:Any n/a answers and conditionalresponses made when performingevaluations that are being reported onappear as empty cells in the report.For information questions (which has ananswer with no score), the response isdisplayed instead of the score.The CSV export format of this report is amulti-column bar/wire chart as a tablewith comments sections.Number of evaluations completed per The total number of evaluations for each specified evaluatorQA Evaluatorover a specified time period (stacked column chart).Number of evaluations per operator(call start time)The total number of evaluations for each specified operator inthe specified time period (stacked column chart) based onevaluation earliest call start time.Number of evaluations per operator(evaluation creation time)The total number of evaluations for each specified operator inthe specified time period (stacked column chart) based onevaluation creation time.Number of evaluations that reachedthe target level per operatorThe number of evaluations which are at or above a targetvalue (percentage) vs the number of evaluations which arebelow the target value (percentage) for each selected user(clustered column chart).Reconsidered evaluationsThe percentage of evaluations which have been reconsideredfor each of the specified operators (stacked column chart)(split by evaluated by user).NOTE:The evaluated by user is from when theevaluation was initially set back to the Inprogress state.Response summary for questionSummary of responses for the selected question on a singleform (pie chart).Scoring trend per month permetadataThe average evaluation score % per month per meta data forspecified operators and a single form (line chart).Scoring trend per monthAverage evaluation percentage score per month for specifiedoperators and forms (line chart).Page 11 of 31
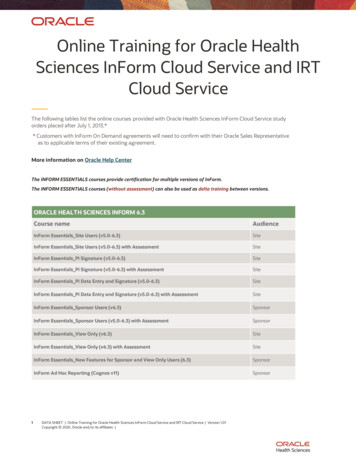
NICE PUBLIC SAFETY SOLUTIONSNICE INFORM REPORTER USER GUIDE3Dashboard viewDashboard viewThe Dashboard view displays a summary of your preferred, commonly used reports. This isthe default view every time you open NICE Inform Reporter.Figure 3-1: Dashboard viewNOTE:All report data is based on the start times of the call records. For example, if areport has a data point per hour, then the value for any given hour is thenumber of calls that started within that hour.NICE Inform Reporter does NOT report on calls that started within the lasthour.Once you log in to NICE Inform and open NICE Inform Reporter, the reports areautomatically run. This information is remembered when you navigate to the Reports view(see page 4) or to another NICE inform application. It is not remembered once you log out ofNICE inform.A label is displayed beneath each report providing the following information: Report nameDate and time when the report was last runPage 12 of 31
NICE PUBLIC SAFETY SOLUTIONSNICE INFORM REPORTER USER GUIDENOTE:Dashboard viewIf the warehouse has incomplete data for the time range and resourcesselected, extra information stating that the data may be incomplete isdisplayed. Data is still being collected for the resources that are used in thereport.Dragging reports between grid slots within the Dashboard viewThe Dashboard view supports dragging reports to a new grid slot location. To drag a report to a new grid slot location:1. Select the report.2. Keeping the mouse button pressed, drag the report to a slot in the Dashboard view.NOTE:The report is swapped if the slot is already occupied.3. Release the mouse button.NOTE:Use the Preferences control to configure the layout and to add or removereports from your Dashboard view (refer to Setting Dashboard preferences(see page 15)).InformationIf a Dashboard grid slot displays an information iconthe grid slot has either noreport allocated to it or no data is returned when the report is run.Maximizing a reportDouble click the report in the Dashboard view to maximize it as shown here.Page 13 of 31
NICE PUBLIC SAFETY SOLUTIONSNICE INFORM REPORTER USER GUIDEDashboard viewFigure 3-2: Report exampleA report can be one of the following: Column chartClustered Column ChartStacked column chartLine chartPie chartTableReport detailsThe report is displayed with the X and Y axis and its title. These settings are all configuredwhen the report was created. In addition, time frame settings that were defined in the TimeFrame section when the report was created are displayed under the report title.NOTE:Hover the cursor over the column bar, line or pie chart segment and a tool tipis presented providing you with the exact value. For reports with multiple seriesof data or multiple colors (as for pie charts), the tool tip also provides the nameof the series/segment. For example, the Y axis value could be the resourcename and the X axis value could be the call count.Maximized report button bar and context menuThere are a number of buttons and context menu options available in the maximized reportview. Refer to Reporter button bars and context menus (see page 17) for help as to eachbutton and context menu function.Page 14 of 31
NICE PUBLIC SAFETY SOLUTIONSNICE INFORM REPORTER USER GUIDEDashboard viewClosing the maximized report viewClick the Close button to close the Report or Public Report view. The screen changes backto your Dashboard view.3.1Setting Dashboard preferencesClick the Reporter preferencesbutton and the Preferences control for the Dashboardview is presented. It displays your current Dashboard configuration with previews of thereports (with mock data) appearing in each position (Dashboard grid slot).The Preferences control enables you to select the reports that you would like to be displayedon your Dashboard view (see page 12). This is referred to as your Dashboard preview. To set the reports to be displayed on your Dashboard view:1. Select the required view from the Dashboard grid view button bar. The screenchanges to reflect your selection.2. Select either the Reportsor Public Reportstable changes to reflect the available reports.NOTE:option. The associated reportsYour Dashboard view can consist of reports from both the Reports and PublicReports tables.3. Select the required report from the table.4. Keeping the mouse button pressed, drag the report to an available slot in theDashboard preview.5. Release the mouse button.NOTE:Double-clicking a report in the table adds the report to the next empty positionin the Dashboard preview.6. Repeat steps 3-5 to select all the reports that you want in your Dashboard preview.The Dashboard preview changes to show an example of each chart type and agreen tick is displayed alongside the report in the table to indicate that it has beenmoved to your Dashboard preview.7. Click the OK button. Your Dashboard preview now updates to reflect the changesyou have made.If you decide to change the Dashboard preview from four grid slots to two, any reportsoccupying slots three and four are removed. The configuration is remembered if you revertback to 4 grid slots and the reports are added back to the same grid slots. This memory islost once you click the OK button to commit your changes.Removing reports from the Dashboard preview To remove reports from the Dashboard view1. Select the required report from the Dashboard preview.Page 15 of 31
NICE PUBLIC SAFETY SOLUTIONSNICE INFORM REPORTER USER GUIDEDashboard view2. Keeping the mouse button pressed, drag the report to the table.3. Release the mouse button.NOTE:Double-clicking a report in the Dashboard view removes the report to the tableas well.Dragging reports between grid slots within the Dashboard previewThe Dashboard preview supports dragging reports
NICE Interaction Management data sources (including NICE Perform and NICE Perform eXpress). . NICE INFORM REPORTER USER GUIDE Reports view Page 6 of 31 . 2.2 Public Reports table . To view the Public Reports table within the Reports view, select the . Public Reports . option.