Transcription
User Guide CRA Analytics Data TablesBoard of Governors of the Federal Reserve SystemMarch 6, 2020Table of ContentsPurpose .2Main Data Sources .2CRA Small Business and Small Farm Data.2HMDA Data .2Data Tables .21. Retail Loan Table .22. Performance Evaluation (PE) Table .33. Merged Data Table .54. Assessment Area Definitions Table .6Quality Control.7Key Concepts and Variables of Note .8Low- and Moderate-Income (LMI) Tracts and Borrowers .8Summary of Deposits Proxy (SoD Proxy AA Flag) .8County Assessment Area Flag (County AA Flag) .8Partial Indicator (partial aa) .8Additional Data Sources .9Analytic Examples .9Retail Loan Table .9PE Table .10Merged Data Table.111
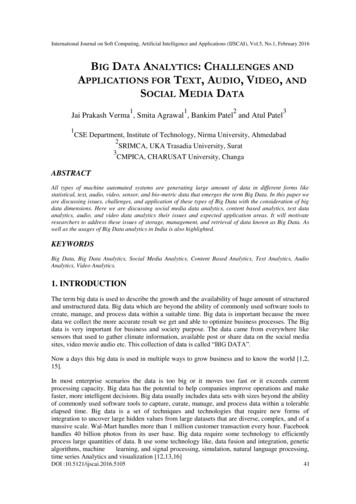
PurposeThe primary purpose of the data tables is to provide Community Reinvestment Act (CRA) stakeholders a betterunderstanding of the historical relationship between bank lending activity and the conclusions and ratings thatregulators assigned on CRA performance evaluations (PEs).For the purposes of this document, (1) “ratings” refer to assessment area (AA) performance conclusions andratings; (2) “AAs” refer to areas that received a conclusion or rating as a part of the exam and are capturedthrough different AA types (see “aa type” in Data Dictionary); and (3) “CRA data” refers to data reported underthe CRA.Main Data SourcesIn order to gain a comprehensive view of bank lending activities and connect it to the assigned ratings, HomeMortgage Disclosure Act (HMDA) data and CRA data were combined, and AA data were extracted from the PEs forbanks that did not report CRA data. HMDA and CRA small business and small farm loan data were collected for theyears of 2005 to 2017. The data were aggregated by tract income status and/or borrower income level, dependingon the variables. The coverage for the PE data is also 2005 to 2017.Please note that there may be discrepancies between the CRA Analytics Data Tables and publicly available data onthe Federal Financial Institutions Examination Council (FFIEC) website due to resubmissions.CRA Small Business and Small Farm DataThe census tract level CRA small business and small farm data are aggregated to the year, bank, and county level.Bank-provided AA delineations were used to aggregate the data to the county level with breakouts for total,inside AA and outside AA lending. The data tables use the post-publication version of the CRA data, which includesadditional updates to the yearly publications currently available on the FFIEC website.HMDA DataThe HMDA Loan Application Register (LAR) data are aggregated to the year, bank, and county level. Whereapplicable, these lending categories are further grouped into inside or outside of the banks’ AAs. This groupinguses the AA delineation files submitted with the CRA data. The data tables use the post-publication version of theHMDA data, which includes additional updates to the yearly publications currently available on the FFIEC website.Row level (year, bank, county) loan data only include depository institutions.Data TablesThere are four main tables: Retail Loan Table, Performance Evaluation (PE) Table, Merged Data Table, and AADefinitions Table. The fifth table, PE Accuracy Table Check, contains quality control data for the PE Table.Descriptions of variables across the four main tables are included in the table-specific data dictionaries and theData Dictionary Guide.1. Retail Loan TableThe Retail Loan Table contains HMDA LAR and CRA small business and small farm data for depository institutions,aggregated at the year, bank, and county level from 2005 through 2017. The table contains loan counts andamounts for originations and purchases, specified as inside or outside assessment area values and grouped byborrower and tract income categories, where applicable.2
A bank must be a HMDA reporter, or a CRA reporter, or both, to be included in the Retail Loan Table (figure 1).Figure 1. Reporters included in the Retail Loan Table - Green, solid boxes indicate inclusion in the Retail LoanTable, i.e., the bank must be either a HMDA reporter or a CRA reporter to be included in the Retail Loan Table. Ifneither HMDA nor CRA reporter (patterned white box), then the bank’s data are not included in the Retail LoanTable.2. Performance Evaluation (PE) TableThe PE data were hand collected from a sample of over 6,000 CRA PEs for a diverse sample of bank sizes andbusiness models. The PEs were selected using a semi-random sampling strategy (see Sampling Procedure).For each PE reviewed, the following data were extracted where available:1.2.3.Lending, Community Development, Investment and overall test ratings for institution, state, multi-statemetropolitan statistical area (MSA), MSAs, and non-MSA AAsEvaluation periods for each product the examiner included as a part of the PECommunity Development loan counts and amounts as well as investment amounts for each AAFor banks that were not required to report CRA data at the time of the exam, the following were collected:1.2.3.Geographical boundaries of their AAsNumber and amount of retail lending and community development lending and investments conductedinside and outside of the banks’ AAsInformation on Loan Production Offices (LPOs), where availableThe integration of these Retail Loan and PE data constitutes the Merged Data Table.Sampling ProcedureData were recorded from a stratified random sample of approximately 6,300 PEs. A number of considerationsdrove the sampling procedure design for selecting PEs to include in the assembled database. The sample wasdrawn from evaluations conducted from 2005 to 2017. Evaluations cover bank performance over a period of years3
preceding the evaluation start date, so this sample covers the market during a boom period, a severe recession,and then an extended recovery.Sampling was stratified by the existing three bank asset threshold categories: Small (roughly less than 300 millionin assets), Intermediate Small (roughly between 300 million and 1.2 billion), and Large (roughly greater than 1.2 billion).Historically, ratings below a “Satisfactory” have been relatively uncommon. Staff, therefore, oversampled bankswith “Needs to Improve” or “Substantial Noncompliance” ratings to obtain a sufficient sample size of theseperformances. PEs were grouped by year, regulator, bank size, and the performance category described above.PEs were randomly selected from each group for data collection. In all, approximately 22,000 PEs with anevaluation start date from 2005 through 2017 are on the websites of the Federal Reserve Board (the Board), theFederal Deposit Insurance Corporation (FDIC), and the Office of the Comptroller of the Currency (OCC). Of these,staff collected data from a sample of approximately 6,300 PEs.Additional Notes on Performance Evaluations The scope of information on performance ratings varies across agencies.Board staff had access to ratings for each test at the state and multi-state MSA level for Federal ReserveSystem (FRS) banks, to ratings for each test at the individual institution level for FDIC banks, and to overallinstitution level ratings for OCC banks. To address this variation in availability of digitized information, thefollowing evaluations were oversampled:i) FRS state member bank evaluations that received a “Needs to Improve” or worse on a lending testrating (or overall rating, for Small Banks) for any state or multi-state MSAii) FDIC bank evaluations where the bank level lending test rating (or overall rating, for Small Banks)was “Needs to Improve” or worseiii) OCC bank evaluations where the bank level overall rating was “Needs to Improve” or worseExaminers assign banks ratings on the various CRA tests at the state, multi-state MSA, and institution level,but only draw conclusions at the AA level.Currently, evaluation conclusions do not use the ratings terminology. As a result, staff often had to judgewhat language in a conclusion corresponded to a particular rating. For example, if an AA was within a statethat received an “Outstanding” rating, and the conclusion language for the AA stated that the bank’sperformance was consistent with its state level rating, the bank would be recorded in the database as havingreceived an “Outstanding” on the test in question for that AA. Alternatively, if the state level rating was“Satisfactory” but the AA conclusion was “poor” or “below state level performance,” then the bank would berecorded as “Needs to Improve” for that AA, i.e., below “Satisfactory.” Evaluation structure differs by regulatory agency.FRS and FDIC evaluations generally stated conclusions about banks’ retail and community developmentperformance, as applicable, at the AA levels. OCC evaluations, instead, recorded conclusions for componentsof those tests (i.e., geographic and borrower income distributions of various retail loan products) at the AAlevels, with ratings on the full test recorded at the state or multi-state MSA level. Therefore, for OCC banks,ratings on each test for an AA are available only when that AA was the only one the bank had in a particularstate or multi-state MSA.Retail Loan and PE Tables are used to produce the Merged Data Table by matching the bank, geography, andproduct evaluation period (figure 2).4
Figure 2. Merging the Retail Loan Table and PE Table to produce the Merged Data Table - Applicable originationsfrom the Retail Loan Table are summed and matched with the correct bank, MSA code, and evaluation period fromthe PE Table. The aggregated originations are then merged onto the original PE Table data to create the MergedData Table.3. Merged Data TableOne of the primary purposes of collecting the loan and PE data was to link each bank’s lending activity toindividual AAs and their corresponding ratings for a given exam period. The product evaluation period informationwas used to independently aggregate the HMDA and CRA lending data within each of the banks’ AAs for each ofthe filing years within the product-specific evaluation periods. For banks that did not report HMDA and/or CRAdata during an evaluation period, the lending activity AA information from the PEs was used to fill in the AAs andlending activity data fields, where applicable. This process led to the creation of the Merged Data Table, which hasone row per bank, exam, and AA and summarizes all of the bank’s lending activity in addition to the deposits,demographics, and vendor data (see Additional Data Sources). This process is carried out within an AA for a givenexam period and links these lending activity data to a lending test rating. There are fewer observations in theMerged Data Table compared to the PE Table, which results from losses in the merge process. These losses areexplained in greater detail in figure 3.5
Figure 3. Loss of observations from PE Table to Merged Data Table - This figure depicts the observations retainedand dropped in the merge process between the Retail Loan Table and the PE table. There are five light-coloredboxes in a horizontal line, each representing the number of observations in the table kept at a particular step in theprocess. There are arrow pointing downward from these boxes to a set of dark-colored boxes, annotated with theword, “Drop”; these represent the number of observations that were dropped at the corresponding step of theprocess. Starting with the first box on the left, which represents the initial 27,000 observations from 6,300 PEs, the“Drop” arrow indicates that 5,300 “Institution and State Assessment Area Ratings” were dropped. The second boxshows the remaining 21,700 observations with a drop of 9,100 observations due to “Assessment Areas withoutLending Test or overall Ratings”. The third box shows the remaining 12,600 observations with a drop of 3,300observations due to “Evaluation Periods Starting Before 2005 or Ending After 2017”. The fourth box shows theremaining 9,300 resulting observations with a drop of 1,300 observations due to miscellaneous reasons. The finalbox in the sequence represents the 8,000 observations in the Merged Data table.4. Assessment Area Definitions TableThis table combines AA geography data collected from PEs for Large Banks with AA information from CRA data.Joining these AA data together results in (approximate) county level geographic definitions for each AA included inthe Merged Data Table. AA geography definitions are also available for all of the Small Bank and IntermediateSmall Bank (ISB) AAs collected from the PEs. Banks that report their CRA lending data annually provide a list of all census tracts where they originated orpurchased loans and flag them if they were in their AA for the filing year. However, information to accuratelyassign these tracts to specific AAs and their respective ratings for a given exam were unavailable. To solvethis problem, MSA, state, and county geography codes for each AA in each exam were collected, whereavailable, and used to associate the reported lending with a specific AA. It should be noted that neither SmallBanks nor ISBs are required to report their CRA data, but both Small Banks and ISBs have the option toreport CRA data.6
“MSA AAs” refer to core based statistical areas (CBSA), metropolitan division (MD), or combined statisticalarea (CSA). These geography codes used in the exam for the AA were collected and mapped to all counties inthe CRA data within that same MSA code. These counties were also flagged by the lenders in the CRA data asbeing in the banks’ AA during the CRA evaluation period. For “non-MSA AAs,” only a single “seed” county was recorded during the PE data collection for each exam.These seed county codes were a starting point to build the whole, approximate non-MSA AA. First, the seedcounty was selected and matched to the same county inside the AA of the corresponding bank in the RetailLoan Table. Then, the list of non-MSA counties inside AA were examined to see if any of the remainingcounties were contiguous to the seed county, using the census’ contiguous counties files. If a candidatecounty was (1) contiguous to the seed county, (2) inside the bank’s AA, (3) in the same state as the seedcounty, and (4) not a seed county itself, then the county was assigned to the seed county’s AA. Iterations ofthis process continued until no new counties were added to the AA. Small Banks do not report CRA data; therefore, data defining their AA geographies were only availablethrough PEs. For these banks, the entire set of counties that were at least partially included in each AA wascollected. Census tract level information for partial counties was not collected; instead, a flag was created tonote when only a portion of a county was included in the AA.Quality ControlVarious quality control (QC) strategies were applied to assess the data tables. The sections below discuss theapproaches taken for each of the core tables.Retail Loan TableAs the content for the Retail Loan Table come from validated sources like CRA and HMDA, the QC process focusedon validating the application of the business requirements and programming procedures used to create the RetailLoan Table. After the knowledge transfer of the materials, an internal IT team independently and successfullyreplicated the Retail Loan Table components and the final table itself.PE TableTwo approaches were used to provide quality control and validation of the PE data. First, the data collectionincluded continuous monitoring. The data were processed and integrated into the internal database, whichincluded procedures to detect and correct errors in the data. Second, a separate QC process reevaluated and reextracted data from a sample of 200 PEs. The re-extracted data were compared to the previously collected datafor each major type of data point collected. The review found that the data were misreported one percent andmissing in error three percent of the time.A full breakdown of the percentages of misreported and underreported data for each of the PE Table data fieldscan be found in the “pe accuracy check” table included in this release. While the data collection process includedrobust quality control checks, the data may nevertheless be subject to error. To submit a question or feedback,please fill out our feedback form. To ensure that your question is properly routed, please select the CommunityReinvestment Act as the “staff group” and select no other options above the field labeled “Type your message.”Merged Data TableThe Merged Data Table was validated using a combination of code review and spot checks of random samples. Acode review to map the ratings, evaluation periods, and the AA code data from the PE tables to the matchingyear, bank, and county records in the Retail Loan Table was conducted to ensure that the code aggregated the7
data in accordance with the business requirements of the project. In addition to the code review, analystsrandomly sampled rows in the Merged Data Table (exam AAs) and manually validated the aggregated loan dataand compared it to the sum of the matching loan data from the Retail Loan Table (for the set of counties whichconstituted the AA over the specific evaluation period from the PE data).Key Concepts and Variables of NoteThis section provides additional information on key concepts across the data tables as well as notable variableswithin the data tables.Low- and Moderate-Income (LMI) Tracts and BorrowersLMI borrowers and geographies are key concepts in the CRA Analytics Data Tables.Definitions of LMI geographies are consistent across HMDA and CRA small business and small farm lending, wherecensus tracts with a median family income of less than 80 percent of the area median family income areconsidered LMI. However, each primary dataset provides different definitions for loans to LMI borrowers. ForHMDA purposes, LMI borrowers refer to borrowers with incomes less than 80 percent of the area median familyincome. For CRA small business and small farm lending, an LMI borrower refers to a small business with grossannual revenue of less than one million dollars.Summary of Deposits Proxy (SoD Proxy AA Flag)The Summary of Deposits (SoD) Proxy variable is a proxy for defining AAs in the loan data for banks that did notreport CRA lending data for a given year. If a bank operated a branch within a county for a given year, then thatcounty was assumed to be included in the bank’s AA for that year. The FDIC’s SoD data were used to create thisflag. They were aggregated into a table with one row per year, bank, and county. Each row contained the numberof branches within the county and a binary flag, indicating that the bank had at least one branch in this countyduring the time of reporting. These data were merged to the loan data by year, bank, and geography to create theSoD table. Records from the loan table which matched a row in the SoD table were flagged as“Inside SoD Proxy AA” and otherwise flagged as “Outside SoD Proxy AA”. For cases where the lender is not inthe annual SoD data, the value “Lender Not in SoD” was assigned.County Assessment Area Flag (County AA Flag)County AA Flag is used to indicate that at least one census tract within the county is inside the bank’s AA. If this flag is positive (value 1) and the Partial Indicator variable is negative (value “N”), then the entirecounty is within the bank’s AA.If the flag is positive (value 1), and the Partial Indicator variable is positive (value “Y”), then only a portionof the county is inside the bank’s AA.If the flag is negative (value 0), then the county is completely outside the bank’s AA.Partial Indicator (partial aa)The Partial Indicator is positive (value “Y”) when a bank claims part of the county in its AA. Banks that reportCRA lending data also provide a list of all tracts included within their AAs. However, banks are not required to addentire counties to their AAs. If the flag is positive (value “Y”), the bank includes only a portion of the county in its AA.8
If the flag is negative (value “N”), the bank includes the whole county in its AA.Additional Data SourcesNational Information Center (NIC) DataThe National Information Center (NIC) provides comprehensive information on banks and other institutions forwhich the FRS has a supervisory, regulatory, or research interest including both domestic and foreign bankingorganizations operating in the U.S.Summary of Deposits (SoD)The FDIC SoD data is an annually reported dataset, which contains the location of each branch office for all FDICinsured banks for the reporting year. SoD was used to aggregate the total sum of deposits within a given countyfor each bank and HMDA/CRA filing year and to count the number of branches (if any) that a bank has in a county.CensusThe FFIEC census data, available on the FFIEC Online Census Data System, identify LMI census tracts. They alsoprovide data for several county level demographic comparators, such as the count of LMI families and owneroccupied housing units within a given county.Vendor DataDun & Bradstreet (D&B) data identify the number of small businesses within a county for a given year. The D&B2010 census file data comprise all D&B records in the U.S., Puerto Rico, and the Virgin Islands. This data includesfields for two-digit North American Industry Classification System (NAICS) codes; annual sales volume; yearstarted; control year ranges; and census state, county, and tract codes. The 2018 data included updates to correctfor changes in census and American Community Survey (ACS) data.Analytic ExamplesBelow are analytic examples from the data tables using R code and the tidyverse package.Retail Loan TableThese scripts and tables show the ratio of banks’ LMI lending to overall lending for HMDA and CRA loans byborrower and tract income.HMDA lending in R Code#R Code, loans 2017 is the Retail Loan Table filtered for year 2017hmda lmi - loans 2017% %filter(Lender in HMDA “Lender in HMDA”) % %group by(state code fips, county code fips) % %mutate(hmda lmi ratio H L 1/ H 1,hmda lmi borrower ratio H bL 1/ H 1,hmda lmi tract ratio H tL 1/ H 1,hmda inside AA ratio H in 1/ H 1,hmda outside AA ratio H out 1/ H 1) % %select(state code fips, county code fips, id rssd, hmda lmi ratio, hmda lmi borrower ratio, hmda lmi tract ratio)9
#HMDA ratios for banks within Morgan County, Ohiohmda lmi Morgan OH - hmda lmi % %filter(state code fips "39" & county code fips "115",!is.na(hmda lmi ratio)) % %ungroup() % %select(id rssd, hmda lmi ratio, hmda lmi borrower ratio, hmda lmi tract ratio) % %head()id rssdhmda lmi ratio hmda lmi borrower ratio hmda lmi tract 000CRA lending in R Codecra lmi - loans 2017 % %filter(Lender in CRA “Lender in CRA”) % %mutate(cra lmi borrower ratio C bL 1/ C 1,sb lmi borrower ratio sb bL 1/ sb 1,sf lmi borrower ratio sf bL 1/ sf 1)#CRA ratios for banks within Morgan County, Ohiocra lmi Morgan OH - cra lmi % %filter(state code fips "39" & county code fips "115",!is.na(cra lmi borrower ratio)) % %ungroup() % %select(id rssd, cra lmi borrower ratio, sb lmi borrower ratio, sf lmi borrower ratio) % %head()id rssdcra lmi borrower ratio sb lmi borrower ratio sf lmi borrower 0.4285714NaNPE TableThe code and chart below show a distribution of PEs by bank agency and State lending test rating specifically forthe PE Table.10
PE 2017 lending test - PE 2017 % %filter(aa type "state")% %group by(lending test rating) % %summarise(count n()) % %mutate(lending test rating factor(lending test rating, levels c("Outstanding","High Satisfactory", "Satisfactory", "Low Satisfactory","Needs to Improve", "Substantial Non-Compliance")))Figure 4. Count of State Lending Test Ratings - 2017 - This is a bar chart titled “Count of State Lending TestRatings by Agency - 2017.” The chart was created using the PE table. The x-axis range is organized left to right bystate lending test “ratings,” starting with “Outstanding” (the highest rating), “High Satisfactory,” “Satisfactory,”“Low Satisfactory,” “Needs to Improve,” and lastly, ”Substantial Noncompliance" (the lowest rating). The y-axis isa count of 2017 ratings and ranges from 0 to 250. “Outstanding” ratings are approximately 40 in count. “HighSatisfactory” ratings are approximately 130 in count. “Satisfactory” ratings have the highest overall count ofapproximately 220. “Low Satisfactory” ratings are about 100 in count. There are approximately 20 “Needs toImprove” ratings and one “Substantial Noncompliance” state lending rating.Merged Data TableThe code and chart below show count of MSA and non-MSA AAs in the Merged Data Table by lending test ratingand regulatory agency.11
#R Code, merged 2017 is the Merged Data Table filtered for year 2017merged data 2017 lending test - merged data 2017 % %filter(aa type %in% c("msa", "non msa")) % %group by(lending test rating)% %summarise(AA count n())Figure 5. Count of MSA and Non-MSA AAs by lending test ratings - 2017 - This is a bar chart titled “Count of MSAand Non-MSA AAs by Agency and Lending Test Ratings - 2017.” The chart was created using the Merged DataTable. The x-axis range is organized left to right by lending test “ratings,” starting with “Outstanding” (the highestrating),“High Satisfactory,” “Satisfactory,” “Low Satisfactory,” “Needs to Improve,” and lastly, ”SubstantialNoncompliance" (the lowest rating). The y-axis is a count of 2017 ratings and ranges from 0 to 300. Approximately70 AAs received ”Outstanding" ratings. Approximately 210 AAs received “High Satisfactory” ratings.Approximately 330 AAs received “Satisfactory” ratings. Approximately 200 AAs received “Low Satisfactory”ratings. Approximately 50 AAs received “Needs to Improve” ratings and two AAs received “SubstantialNoncompliance” ratings12
Green, solid boxes indicate inclusion in the Retail Loan Table, i.e., the bank must be either a HMDA reporter or a CRA reporter to be included in the Retail Loan Table. If neither HrMDA no CRA reporter (patterned white box), then the bank's data are not included in the Retail Loan Table. 2. Performance Evaluation (PE) Table