Transcription
Wang et al. Journal of Hematology & 2019) 12:81RESEARCHOpen AccessThe long noncoding RNA H19 promotestamoxifen resistance in breast cancer viaautophagyJi Wang1,2, Shuduo Xie1,2, Jingjing Yang1,2, Hanchu Xiong1,2, Yunlu Jia1,2, Yulu Zhou1,2, Yongxia Chen1,2,Xiaogang Ying1,2, Cong Chen1,2, Chenyang Ye3, Linbo Wang1,2* and Jichun Zhou1,2*AbstractBackground: Tamoxifen resistance remains a clinical challenge for hormone receptor-positive breast cancer.Recently, dysregulations in autophagy have been suggested as a potential mechanism for tamoxifenresistance. Although the long noncoding RNA H19 is involved in various stages of tumorigenesis, its role intamoxifen resistance remains unknown. Here, we assessed the role of H19 in the development of tamoxifenresistant breast cancer.Methods: Quantitative real-time PCR analyzed expression of H19 in tamoxifen-resistant breast cancer tissues.Knockdown of H19 was used to assess the sensitivity to tamoxifen in vitro and in vivo. Both knockdown andoverexpression of H19 were used to analyze the status of autophagy. Real-time quantitative methylationspecific polymerase chain reaction, chromatin immunoprecipitation, immunofluorescence, and Western blotwere used to explore the tamoxifen resistance mechanism of H19.Results: In this study, we observed that the expression of H19 was substantially upregulated in tamoxifen-resistantbreast cancer cell line and tumor tissues, and knockdown of H19 enhanced the sensitivity to tamoxifen both in vitroand in vivo. Furthermore, knockdown of H19 significantly inhibited autophagy in MCF7 tamoxifen-resistant (MCF7/TAMR) cells. Conversely, overexpression of H19 promoted autophagy. Interestingly, overexpression of H19 in MCF7tamoxifen-sensitive cells could recapitulate tamoxifen resistance. Moreover, an increase in methylation in the promoterregion of Beclin1 was observed in MCF7/TAMR-shH19 cells. In the double knockdown groups, both shH19 shSAHHand shH19 shDNMT3B rescued the Beclin1 promoter region methylation levels and reactivated autophagy functions.A chromatin immunoprecipitation assay further validated that DNMT3B binds to the Beclin1 promoter region and theknockdown of H19 increases this binding.Conclusions: Our findings demonstrate that H19 induces autophagy activation via the H19/SAHH/DNMT3B axis, whichcould contribute to tamoxifen resistance in breast cancer.Keywords: LncRNA H19, Autophagy, Methylation, Beclin1, Breast cancer, Tamoxifen resistance* Correspondence: linbowang@zju.edu.cn; jichun-zhou@zju.edu.cn1Department of Surgical Oncology, Sir Run Run Shaw Hospital, ZhejiangUniversity School of Medicine, No.3 Eastern Qingchun Road, Hangzhou310016, Zhejiang, ChinaFull list of author information is available at the end of the article The Author(s). 2019 Open Access This article is distributed under the terms of the Creative Commons Attribution 4.0International License (http://creativecommons.org/licenses/by/4.0/), which permits unrestricted use, distribution, andreproduction in any medium, provided you give appropriate credit to the original author(s) and the source, provide a link tothe Creative Commons license, and indicate if changes were made. The Creative Commons Public Domain Dedication o/1.0/) applies to the data made available in this article, unless otherwise stated.
Wang et al. Journal of Hematology & Oncology(2019) 12:81BackgroundBreast cancer is the most frequently diagnosed malignancyand the second leading cause of cancer mortality in femalesworldwide [1]. Approximately 70% of breast cancer patientsare estrogen receptor (ER)-positive. Tamoxifen, an antiestrogen, competitively inhibits the binding of estrogen to theER and blocks the ER-mediated stimulation signal [2]. Fiveyears of tamoxifen adjuvant therapy has been shown tosafely reduce 15-year risks of breast cancer recurrence anddeath [3]; however, a substantial group of patients wasshown to eventually develop resistance (de novo oracquired) to tamoxifen [3, 4]. Although many molecularmechanisms of tamoxifen resistance have been revealed,including mutations in the ESR1 gene and the activation ofalternative growth pathways, such as ERBB2/HER2, EGFR,IGF1R, and cyclin D1/CDK4/6 pathways [5–7], it remainsnecessary to gain an improved understanding of the potential mechanisms of tamoxifen resistance.Autophagy is a cellular process through which intracellular misfolded proteins and malfunctioning organelles aretargeted to lysosomes or vacuoles for degradation [8, 9]. Recent studies have shown that autophagy is also a potentialmechanism for tamoxifen resistance. For instance, overexpression of Beclin1, the key mediator of autophagy, desensitizes estrogen-induced signaling, contributing to thedevelopment of tamoxifen resistance in ER-positive breastcancers [10]. Inhibition of autophagy genes, such as atg5,atg7, and Beclin1, results in resensitization of tamoxifenresistant breast cancer cells [11, 12]. The autophagy inhibitors 3-methyladenine (3-MA) and chloroquine (CQ) havebeen used to restore tamoxifen sensitivity in tamoxifenresistant cancer [13, 14]. However, the underlying mechanism by which autophagy mediates tamoxifen resistance inbreast cancer remains to be elucidated.Long noncoding RNAs (lncRNAs) ( 200 bp) have beenshown to participate in a variety of biological processes,including tamoxifen resistance [15–19]. For example, thelncRNA HOTAIR enhances ligand-independent ER function and contributes to tamoxifen resistance [20]. ThelncRNA DSCAM-AS1 facilitates estrogen-independentoncogenicity, which could also potentially promote tamoxifen resistance [21]. H19 lncRNA (H19) is an imprintinglncRNA that is exclusively transcribed from the maternallyinherited allele [22, 23]. H19 plays important roles in proliferation, metastasis, chemoresistance, and stem cellmaintenance of breast cancer cells [24–27]. Recent research has shown that H19 is more abundant in ERpositive breast cancer than in ER-negative breast tumortissues [28]. Moreover, some evidence has indicated thatblocking ERs in luminal progenitor cells results in downregulated H19 expression and smaller colony formation,similar to the H19-knockdown phenotype [29]. However,the role of H19 in the development of tamoxifen resistance remains vague.Page 2 of 14In this study, we showed that H19 promoted tamoxifenresistance in ER-positive breast cancer cells and autophagy, which occurs via downregulation of methylation inthe promoter of Beclin1 by the H19/SAHH/DNMT3Baxis. This novel molecular mechanism for tamoxifen resistance may serve as a promising biomarker for overcoming tamoxifen resistance.MethodsCell cultureThe tamoxifen-sensitive human breast cancer cell lineMCF7 was obtained from the American Type CultureCollection (ATCC, HTB-22). Tamoxifen-resistant cells(MCF7/TAM) were established by culturing MCF7 cellsin medium with 1 μM tamoxifen citrate salt (Sigma-Aldrich, T9262-1G) over 6 months, as previously described[30, 31]. All of the cells were cultured in RPMI 1640medium with 10% fetal bovine serum (FBS) at 37 C inthe presence of 5% CO2.Plasmid, siRNA, and transfectionTo generate H19-knockdown MCF7/TAM cells, wepurchased synthesized target sequences for scrambledsiRNA and H19 siRNA from Thermo Fisher (4390771).MCF7/TAM cells were transfected with 1 μg of LC3EGFP-mCherry plasmid using Lipofectamine 3000transfection reagent (Invitrogen, L3000001). The stablecell line was selected using G418 sulfate antibiotic (Calbiochem, 509290).Lentivirus-mediated transductionAccording to previous studies and results from NCBIBLAST, we used the following target sequences: H19 (5-′CAGCCCAACATCAAAGACA-3′), SAHH (5′-ACAACCTCTACAAGATGAT-3′), DNMT3B (5′-AGATGACGGATGCCTAGAG-3′), and scrambled sequence (5′-TTCTCCGAACGTGTCACGT-3′) [32, 33]. These sequenceswere cloned into GV248/GV307 vectors (GeneChem,Shanghai, China). The plasmid H19 was purchased fromGeneChem. All plasmids were transfected into 293T cells,together with the Lentivector Expression System (GeneChem, Shanghai, China), to produce lentiviruses. Thesespecific shRNAs were packaged into lentiviruses by Genechem Inc. For the infection, target cells were cultured at adensity of 100,000 cells per well in 6-well plates, coculturedwith 2.5E 6 Tu virus in the presence of 5 mg/ml polybreneand standard medium for 13 h, and then the medium waschanged to fresh medium. After 72 h of transfection, thecells were selected via incubation with 10 μg/ml puromycinfor 1 week. We used qRT-PCR and/or Western blotting toconfirm the expression of the target genes.
Wang et al. Journal of Hematology & Oncology(2019) 12:81Page 3 of 14Colony formationCell cycle analysisCells were seeded at a density of 300–1000 cells per wellin 6-well plates in standard medium. After 24 h, themedium was changed to medium with tamoxifen, andthe medium was regularly replaced every 2 days. After2 weeks, live cells were stained using crystal violet.Cells were collected at 48 h after transfection with ansiRNA, and then washed twice with PBS, and the CellCycle Staining Kit (MULTISCIENCES, CCS012) wasused following the manufacturer’s instructions. Cell cycleanalyses were performed by flow cytometry (Accurimodel C6).Cell viabilityRNA extraction and quantitative real-time PCRCells were seeded at a density of 3000 cells per well in96-well plates (in triplicate). Tamoxifen was added (day0) 24 h after cell seeding and redosed along with themedium changes every 48 h after the first dose. A cellcounting kit-8 (CCK-8, Dojindo, Japan, CK04) was usedto analyze the number of viable cells from day 0 to day5. Following the manufacturer’s instructions, 10 μl ofCCK-8 reagent was mixed with 100 μl of normalmedium in each well. After incubating for 4 h at 37 C,the absorbance was recorded at a wavelength of 450 nm.Total RNA was extracted using an E.Z.N.A. Total RNAKit I (OMEGA, Norcross, USA). The RNA concentration was measured using a Nanodrop 2000c (ThermoScientific, USA). One microgram of RNA was reversetranscribed using a HiFiScript cDNA Synthesis Kit(CWBIO, Beijing, China) with random primers. The expression of H19, SAHH, DNMT3B, Beclin1, and tubulingenes was determined by real-time PCR using SYBRGreen Master Mix (CWBIO, Beijing, China) with theprimers (Sangon Biotech, Shanghai, China) listed inAdditional file 2: Table S2. A final volume of 25 μl wasused for qPCR in an ABI 7500 Real-Time PCR System(Applied Biosystems, USA). The amplification conditionswere 95 C for 5 min, followed by 40 cycles at 95 C for15 s, 60 C for 30 s, and 72 C for 30 s. Tubulin was usedto correct the difference in template input. The relativeRNA expression was calculated using the 2 ΔCT method.Analysis of autophagy by flow cytometryCells were seeded in 6-well plates for 24 h, then changedinto fresh media containing 10 μM tamoxifen and incubated for 24 h. The cells were washed, and the autophagic vacuoles were quantified using a cyto-ID autophagydetection kit (Enzo, ENZ-51031) according to the manufacturer’s instructions. The signals of labeled autophagicvacuoles were analyzed using a flow cytometer with anFL1 (488 nm excitation, green) channel.Fluorescent confocal microscopyMCF7/TAMR cells stably expressing tandem mCherryEGFP-LC3 (described previously) were further infected withshCtrl, shH19, shH19 shSAHH, or shH19 shDNMT3Band selected using puromycin for 1 week. Then, the cellswere seeded on a coverglass for growth and cultured inmedium with 10 μM tamoxifen. After 24 h, the cells werefixed, stained with DAPI (300 nM), and then examinedusing a confocal microscope (Nikon A1 Ti).Apoptosis analysisFloating and attached cells were collected, and apoptosiswas measured using a FITC Annexin V Apoptosis Detection Kit I (BD Biosciences, 556547) according to themanufacturer’s protocol. Briefly, a total of 50,000 cellsper replicate (three independent experiments) werewashed and incubated with FITC Annexin V and PI, andthe green fluorescence of annexin V and red fluorescence of PI were analyzed by flow cytometry using FL1(488 nm excitation, green) and FL3 (585 nm excitation,red) channels. A minimum of 10,000 events was collected for each sample.Real-time quantitative methylation-specific polymerasechain reaction analysisGenomic DNA was extracted using a Quick-gDNAMicroPrep Kit (Zymo, D3021) and eluted in 20 μl ofDNase-free water. Then, 500 ng of DNA was bisulfitedusing a EZ DNA Methylation-Gold Kit (Zymo, D5006).RT-qPCR was performed using ChamQ SYBR (Vazyme)in the ABI 7500 Real-Time PCR System (Applied Biosystems, USA). The PCR primers for methylated DNA arelisted in Additional file 2: Table S1. PCR was performedby initial denaturation at 95 C for 30 s, followed by 40cycles at 95 C for 10 s and 60 C for 30 s. Specificity wasverified by melting curve analysis. The Ct values of eachsample were used for subsequent data analysis. AlbuminDNA was used as a loading control for all quantitativemethylation-specific polymerase chain reaction (QMSP)data normalization.Chromatin immunoprecipitation assayA SimpleChIP Enzymatic Chromatin IP Kit (MagneticBeads) (Cell Signaling Technology, #9003) was used following the manufacturer’s instructions. Briefly, crosslinkingwas performed by fixing 4 106 cells with 37% formaldehyde for 10 min at room temperature, and the crosslinkingreaction was quenched by glycine. Sonication and enzymatic digestion were used to digest chromatin from the lysedcells. Chromatin was then immunoprecipitated using anti-
Wang et al. Journal of Hematology & Oncology(2019) 12:81DNMT3B (Cell Signaling Technology, D7070) and standard rabbit-IgG antibodies. Next, chromatin immunoprecipitation (ChIP)-enriched DNA was amplified using PCR, andthe primer sets were designed as follows: Beclin1: 5′GGTCAGCGAGACCCTTGGAA-3′ (sense) and 5′AGAATTATATCACCAAAGCTGCCC-3′ (anti-sense). The PCRproducts were loaded onto 2% agarose gels and observedusing ultraviolet light.Western blot analysisA total of 1 106 cells were plated in each 60-mm dishand allowed to attach for 24 h before the treatments.After the treatments, the cells were lysed using RIPAbuffer (Pierce, Rockford, USA) mixed with a protease inhibitor cocktail. The concentrations of proteins were determined using a Bio-Rad protein assay kit II (Bio-RadLaboratories, 500-0002EDU). A total of 15 μg of proteinfrom each sample was mixed with 5 Lane Marker Reducing Sample Buffer (Pierce, Rockford, USA), separatedon a 12% SDS-polyacrylamide gel, then transferred toPVDF membranes (Merck Millipore, Billerica, USA),and incubated with 1:500 to 1:1000 dilutions of primaryantibodies, including GAPDH (Santa Cruz Biotechnology, sc-47724), Beclin1 (Cell Signaling Technology,3495S), LC3 (Sigma-Aldrich, L7543), P62 (MBL International, PM045), SAHH (Santa Cruz Biotechnology, sc271389), and DNMT3B (Cell Signaling Technology,D7070). The protein bands were stained with horseradish peroxidase-conjugated secondary antibodies (MultiSciences, GAM0072, and GAR007). The protein bandswere visualized by enhanced chemiluminescence (MerckMillipore, Billerica, USA). Fold changes in the intensityof the protein signals were reported as the mean of theresults from three experiments.Xenograft studiesAnimal studies were reviewed and approved by the EthicsCommittee for Animal Studies of Zhejiang University.MCF7/TAMR-Tet-shH19 xenografts were established in 5week-old nude mice (Shanghai SLAC Laboratory AnimalCorporation) by inoculating 1 107 cells (together with50% Matrigel, BD Biosciences) into the abdominal mammary fat pad. Tumor sizes were measured, and tumor volumes were calculated as follows: length width2 0.5.When the tumors reached a volume of approximately 200mm3 (2 to 3 weeks), mice bearing MCF7/TAMR-TetshH19 xenografts were randomized to / doxycycline(Dox, 1 mg/mouse) and / tamoxifen (50 mg/kg) treatment groups. Each group consisted of a minimum of 5mice. The diameters of the tumors were measured every4 days. After 22 days of treatment, all mice were euthanized, and the tumors were surgically removed. Portions ofthe tumors were immediately frozen in liquid nitrogen forPage 4 of 14the following extraction of RNA and protein or fixed in10% buffered formalin for immunohistochemistry.Immunohistochemical analysisAll formalin-fixed and paraffin-embedded tumor sectionswere treated with xylene and ethanol for deparaffinizationand rehydration. After blocking endogenous peroxidasewith 3% H2O2 in methanol, antigen retrieval was conductedby boiling the sections in sodium citrate buffer (0.1 mM,pH 6.0) for 5 min. The sections were then blocked withgoat serum (C-0005, Bioss) for 30 min and incubated overnight at 4 C with antibodies against LC3 (1:1000, SigmaAldrich, L7543), P62 (1:1000; MBL International, PM045),and Beclin1 (1:50; Cell Signaling Technology, 3495S). GTvisionIII Immunohistochemical Assay Kit (HRP/DAB, rabbit/mouse-general, two-step) (GK500710, Gene Tech Shanghai) and Maye’s hematoxylin were used to detect the primary antibody and the cell nucleus. Images were acquiredusing a polarized light microscope (Nikon, Eclipse 80i).Two independent pathologists in our hospital analyzed thestaining results.Sample collection and patient characteristicsFourteen tamoxifen-sensitive and 23 tamoxifen-resistantbreast cancer tissues were surgically obtained from theDepartment of Surgical Oncology, Sir Run Run ShawHospital, Zhejiang University School of Medicine, andfrozen at 80 C. Written informed consent was obtained from each patient. The Ethics Committee of theSir Run Run Shaw Hospital at Zhejiang UniversitySchool of Medicine approved this study.Public Gene Expression Omnibus dataset analysisTwo publicly available datasets (GSE26459 and GSE28645)containing gene expression information from tamoxifenresistant breast cancer cell lines and parental tamoxifensensitive cell lines were downloaded from Gene ExpressionOmnibus (GEO; http://www.ncbi.nlm.nih.gov/geo/). Theprocessed data including normalization procedures wereobtained from the corresponding websites, and no additional transformations were performed.Statistical analysisStatistical analysis was performed by using SPSS software 22.0 version or GraphPad Prism. The significancewas evaluated by the simple t test or two-way ANOVAfor normally distributed data. Non-normally distributeddata was analyzed by using a two-tailed Wilcoxonsigned-rank test for matched pairs. Correlation was investigated by a two-tailed Spearman parametric correlation test. A P value less than 0.05 was deemed to bestatistically significant.
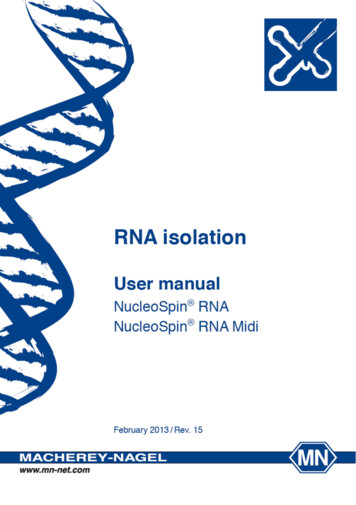
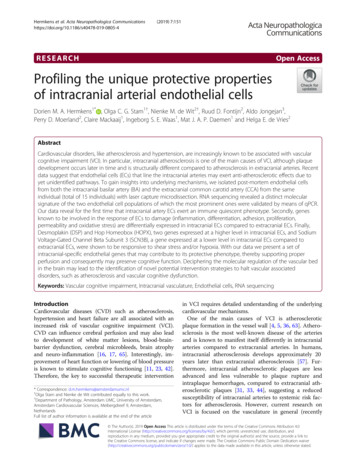
Wang et al. Journal of Hematology & Oncology(2019) 12:81Page 5 of 14ResultsAutophagy facilitates tamoxifen resistance in breastcancer cell linesTo investigate the role of autophagy in the development of tamoxifen resistance, we established atamoxifen-resistant MCF7 cell line (MCF7/TAMR) byculturing a tamoxifen-sensitive MCF7 cell line inmedium with 1 μM tamoxifen for over 6 months, aspreviously described [30, 31]. To confirm the establishment of the cell line, we performed a monolayercolony formation assay (Fig. 1a). After 14 days, parental MCF7 cells showed a significant decrease in survival rates with 5 or 10 μM tamoxifen treatment,whereas MCF7/TAMR cells were not affected by tamoxifen at these concentrations. Additionally, MCF7/TAMR cells had a greater IC50 value than MCF7cells (IC50: 37.29 μM for MCF7/TAMR cells compared with 5.03 μM for MCF7 cells; P 0.01)(Additional file 1: Figure S1a). To investigate whetherautophagy has an impact on tamoxifen resistance, weanalyzed autophagic vacuoles in both cell lines usinga Cyto-ID autophagy detection assay and found thatMCF7/TAMR cells showed stronger -II11.96M–– Fn.s.12.5***10.0**150Apoptosis (%)Colony Numbers– –GAPDHC***200 – /TAM110ME –Beclin-1*0 5 100 5 10Tamoxifen (µM) F7MCF7/TAMR20040UnstainTAMRMCF7MCF7 Stv CQTAMR Stv CQMCF7MCF7/TAMRM250CF7TAF7 MRTA Stv CMRQStv CQ10Colony Numbers5CBTamoxifen (µM)0Relative fluorescenceAsignals, which is indicative of increased autophagy,compared with MCF7 cells (Fig. 1b). Furthermore,Western blotting indicated that MCF7/TAMR cellsshowed a stronger induction of autophagy than MCF7cells based on greater expression of LC3-II (Fig. 1c).To further verify the role of autophagy in tamoxifenresistance, we used two autophagic inhibitors, 3-MAand CQ, which inhibit autophagy at upstream ordownstream levels, respectively. After treating cellswith 5 mM 3-MA or 5 μM CQ for 14 days (mediumwas changed to fresh medium every 3 days), MCF7/TAMR cells showed a decrease in resistance to 10 μMtamoxifen, indicated by a decreased number of cellcolonies (Fig. 1d (upper row), e). To exclude whetherthe decrease in proliferation was affected by apoptosis, we compared the apoptotic levels in thesegroups as well. Flow cytometry results showed similarapoptotic levels among MCF7/TAMR cells culturedfor 24 h in medium with blank, tamoxifen, 3-MA,CQ, or tamoxifen combined with the two autophagyinhibitors (Fig. 1d (lower row), f ). These data indicated that autophagy promotes tamoxifen resistancein MCF7/TAMR cells.1005007.55.52.5Tamoxifen– ––0Tamoxifen– ––3-MA– –– –3-MA–– – –CQ–– –– CQ––– – Fig. 1 Increased autophagy promotes tamoxifen resistance. a Representative images of the colony formation assays using MCF7 or MCF7/TAMRcells under 0, 5, and 10 μM tamoxifen treatment for 14 days. The bar graphs show the quantification of the colony formation assay data. The dataare presented as the mean SD of three independent experiments. Student’s t test was used for statistical analysis. b Autophagic vacuolesstimulated by 10 μM tamoxifen for 12 h in MCF7 or MCF7/TAMR cells were analyzed using a Cyto-ID autophagy detection assay. Stv: starvation.The data are presented as the mean SD of three independent experiments. Student’s t test was used for statistical analysis. c. Both MCF7 cellsand MCF7/TAMR cells were exposed to 10 μM tamoxifen for 12 h. Western blotting was performed to examine the expression of Beclin1 and LC3.The value next to each blot is the quantification of the relative expression of the indicated band normalized to GAPDH expression. d.Representative images of the colony formation and cell apoptosis assays using MCF7/TAMR cells that were cultured in blank, tamoxifen, 3-MA,CQ, or tamoxifen combined with 3-MA or CQ media. e. Bar graphs showing the quantification of the colony formation assay data. The data arepresented as the mean SD of three independent experiments. Student’s t test was used for statistical analysis. f. Bar graphs showing thepercentage of apoptotic cells. The data are presented as the mean SD of three independent experiments. Student’s t test was used forstatistical analysis. **P 0.01, ***P 0.001, and ****P 0.0001 compared with the control group. n.s. indicates no significant difference
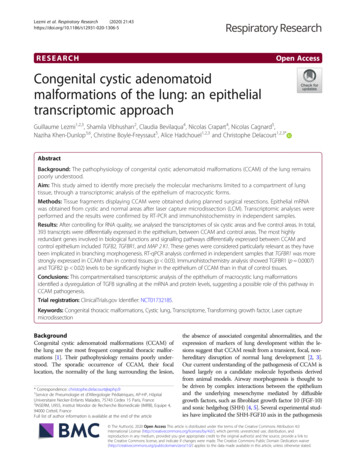
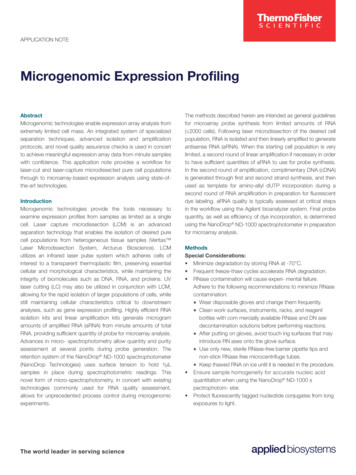
Wang et al. Journal of Hematology & Oncology(2019) 12:81Page 6 of 14tamoxifen-resistant cell groups were significantly upregulated compared with the tamoxifen-sensitive MCF7 cellgroups (Fig. 2c) [35, 36]. To determine the role of H19 intamoxifen resistance, we silenced H19 via lentivirusmediated short hairpin RNAs (shRNAs). qRT-PCR confirmed a decrease of at least 80% in the RNA expressionlevel of MCF7/TAMR-shH19 cells compared to that ofMCF7/TAMR-control cells (Fig. 2d). Then, we evaluatedthe sensitivity of tamoxifen using a monolayer colony formation assay and a CCK-8 assay. The monolayer colonyformation assay confirmed that MCF7/TAMR-shH19 cellsformed fewer colonies than the MCF7/TAMR-controlcells under the 10-μM tamoxifen treatment (Fig. 2e). Similarly, the CCK-8 assay indicated that MCF7/TAMRshH19 cells showed a greater sensitivity than MCF7/TAMR-control cells under the 10-μM tamoxifen treatment (Additional file 1: Figure S2a). Consistently, similarH19 is upregulated in tamoxifen-resistant breast cancercell line and tumor tissues and promotes resistance totamoxifenWe analyzed clinical breast cancer tissues from 37 casesof breast cancer, including 14 tamoxifen-sensitive samplesand 23 tamoxifen-resistant samples (cancer recurred withthe adjuvant tamoxifen treatment). Overexpression ofH19 was statistically more frequent in the tamoxifenresistant group compared with the tamoxifen-sensitivegroup (P 0.0119; Fisher’s exact test) (Fig. 2a). We furthermeasured the level of H19 in MCF7/TAMR and parentalMCF7 cell lines. The qRT-PCR results revealed that theexpression level of H19 in MCF7/TAMR cells was significantly higher than parental MCF7 cells (Fig. 2b), which isconsistent with previous study [34]. Similarly, GSE26459and GSE28645 datasets from Gene Expression Omnibus(GEO) both indicated that H19 expression levels ofAFBGCHDIEJFig. 2 LncRNA H19 is overexpressed in tamoxifen-resistant cell line and tumor samples and facilitates tamoxifen resistance. a mRNA expression ofH19 in 37 breast cancer tissue samples. The data are presented as the mean SD; n 37. The Wilcoxon signed-rank test was used for statisticalanalysis. b mRNA expression of H19 in MCF7/TAMR cells and parental MCF7 cells. The data are presented as the mean SD of three independentexperiments. Student’s t test was used for statistical analysis. c H19 expression statuses in tamoxifen-resistant and tamoxifen-sensitive MCF7 cellswere obtained from GSE26459 and GSE28645. The data are presented as the mean SD of three independent experiments. Student’s t test wasused for statistical analysis. d MCF7/TAMR cells were stably infected with the shControl (shCtrl) lentiviral vector or the shH19 lentiviral vector. Theefficiency of RNA interference-mediated knockdown of target gene expression was determined by qRT-PCR analysis. The data are presented asthe mean SD of three independent experiments. Student’s t test was used for statistical analysis. e Representative images of the colonyformation assays using MCF7/TAMR cells that stably expressed shCtrl or shH19 under 10 μM tamoxifen treatment. The bar graphs show thequantification of the colony formation assay data. The data are presented as the mean SD of three independent experiments. Student’s t testwas used for statistical analysis. f MCF7/TAMR cells were transfected with the siCtrl or the siH19. The efficiency of RNA interference-mediatedknockdown of target gene expression was determined by qRT-PCR analysis. The data are presented as the mean SD of three independentexperiments. Student’s t test was used for statistical analysis. g Under 10 μM tamoxifen treatment, the viability of MCF7/TAMR cells thattransfected with siH19 or shCtrl was analyzed using a CCK-8 assay. The data are presented as the mean SD of three independent experiments.Student’s t test was used for statistical analysis. h MCF7 cells were stably infected with the lentiviral empty vector or the H19 overexpressionlentiviral vector. The overexpression efficiency of target gene expression was determined by qRT-PCR analysis. The data are presented as themean SD of three independent experiments. Student’s t test was used for statistical analysis. i H19-overexpressing MCF7 cells or parentaltamoxifen-sensitive MCF7 with empty vector cultured in different concentrations of tamoxifen was analyzed using a CCK-8 assay. The data werethen used to calculate the IC50 of each cell line. The data are presented as the mean SD of three independent experiments. Student’s t testwas used for statistical analysis. j Cell cycle analysis after knockdown of H19 was conducted using flow cytometry. The data are presented as themean SD of three independent experiments. Student’s t test was used for statistical analysis. *P 0.05, **P 0.01, ***P 0.001, and ****P 0.0001compared with the control group
Wang et al. Journal of Hematology & Oncology(2019) 12:81cell viability results were obtained by using two independent siH19 in MCF7/TAMR cells (Fig. 2f, g). Intriguingly,we also generated stable H19-overexpressing MCF7 cellsand found H19 overexpression in wild-type MCF7 can recapitulate tamoxifen resistance (Fig. 2h, i). As expected,knockdown of H19 enhanced the sensitivity of wild-typeMCF7 to tamoxifen (Additional file 1: Figure S2b). To investigate the impact of H19 on cell cycle progression, weconducted cell cycle analysis using flow cytometry. Cellcycle analysis revealed that loss of H19 induced cell-cyclearrest at the G2/M phase (Fig. 2j). Collectively, we confirmed that H19 promotes tamoxifen resistance, and H19silencing induces greater sensitivity of tamoxifen.H19 promotes autophagy activity in tamoxifen-resistantbreast cancerTo determine the relationship between H19 and autophagy, we conducted flow cytometry and found that H19knockdown decreased the fluorescent signal of autophagosomes compared with the control group in MCF7/TAMR cells (Fig. 3a). To determine whether inhibition ofH19 influences autophagic flux in MCF7/TAMR cells, weconducted analyses using autophagy protein LC3-II andthe lysosomal inhibitor CQ. As indicated by increasedlevels of LC3-II in the presence of CQ, decreased autophagic flux was observed in the H19 silencing groups compared with that in control group, indicating knockdown ofH19 inhibited autophagic synthesis (Fig. 3b). Then, weused stable H19-overexpressing MCF7/TAMR cell line toperform flow cytometry. Ectopically, H19 expression promoted the fluorescence of autophagosomes and increasedthe expression of LC3-II (Fig. 3c, d). Then, we utilized themCherry-EGFP-LC3 reporter, which can distinguish between autophagosomes and autolysosomes whose GFPsignal is vulnerable to acidic conditions after autolysosomeformation, whereas the mCherry signal is less affected.Therefore, the yellow puncta indicate autophagosomes,and the red puncta indicate autolysosomes in the mergedfigures. By overexpressing H19, the formation of bothautophagosomes and autolysosomes increased (Fig. 3e),indicating increased autophagy. The decreased formationsof both autophagosome
analyses were performed by flow cytometry (Accuri model C6). RNA extraction and quantitative real-time PCR Total RNA was extracted using an E.Z.N.A. Total RNA Kit I (OMEGA, Norcross, USA). The RNA concentra-tion was measured using a Nanodrop 2000c (Thermo Scientific, USA). One microgram of RNA was reverse transcribed using a HiFiScript cDNA .