Transcription
APPLICATION NOTEMicrogenomic Expression ProfilingAbstractMicrogenomic technologies enable expression array analysis fromextremely limited cell mass. An integrated system of specializedseparation techniques, advanced isolation and amplificationprotocols, and novel quality assurance checks is used in concertto achieve meaningful expression array data from minute sampleswith confidence. This application note provides a workflow forlaser-cut and laser-capture microdissected pure cell populationsthrough to microarray-based expression analysis using state-ofthe-art technologies.IntroductionMicrogenomic technologies provide the tools necessary toexamine expression profiles from samples as limited as a singlecell. Laser capture microdissection (LCM) is an advancedseparation technology that enables the isolation of desired purecell populations from heterogeneous tissue samples (Veritas Laser Microdissection System, Arcturus Bioscience). LCMutilizes an infrared laser pulse system which adheres cells ofinterest to a transparent thermoplastic film, preserving essentialcellular and morphological characteristics, while maintaining theintegrity of biomolecules such as DNA, RNA, and proteins. UVlaser cutting (LC) may also be utilized in conjunction with LCM,allowing for the rapid isolation of larger populations of cells, whilestill maintaining cellular characteristics critical to downstreamanalyses, such as gene expression profiling. Highly efficient RNAisolation kits and linear amplification kits generate microgramamounts of amplified RNA (aRNA) from minute amounts of totalRNA, providing sufficient quantity of probe for microarray analysis.Advances in micro- spectrophotometry allow quantity and purityassessment at several points during probe generation. Theretention system of the NanoDrop ND-1000 spectrophotometer(NanoDrop Technologies) uses surface tension to hold 1μLsamples in place during spectrophotometric readings. Thisnovel form of micro-spectrophotometry, in concert with exisitngtechnologies commonly used for RNA quality assessment,allows for unprecedented process control during microgenomicexperiments.The methods described herein are intended as general guidelinesfor microarray probe synthesis from limited amounts of RNA( 2000 cells). Following laser microdissection of the desired cellpopulation, RNA is isolated and then linearly amplified to generateantisense RNA (aRNA). When the starting cell population is verylimited, a second round of linear amplification if necessary in orderto have sufficient quantities of aRNA to use for probe synthesis.In the second round of amplification, complimentary DNA (cDNA)is generated through first and second strand synthesis, and thenused as template for amino-allyl dUTP incorporation during asecond round of RNA amplification in preparation for fluorescentdye labeling. aRNA quality is typically assessed at critical stepsin the workflow using the Agilent bioanalyzer system. Final probequantity, as well as efficiency of dye incorporation, is determinedusing the NanoDrop ND-1000 spectrophotometer in preparationfor microarray analysis.MethodsSpecial Considerations: Minimize degradation by storing RNA at -70 C. Frequent freeze-thaw cycles accelerate RNA degradation. RNase contamination will cause experi- mental failure.Adhere to the following recommendations to minimize RNasecontamination:* Wear disposable gloves and change them frequently.* Clean work surfaces, instruments, racks, and reagentbottles with com mercially available RNase and DN asedecontamination solutions before performing reactions.* After putting on gloves, avoid touch ing surfaces that mayintroduce RN ases onto the glove surface.Useonly new, sterile RNase-free barrier pipette tips and*non-stick RNase free microcentrifuge tubes.* Keep thawed RNA on ice until it is needed in the procedure. Ensure sample homogeneity for accurate nucleic acidquantitation when using the NanoDrop ND-1000 spectrophotom- eter. Protect fluorescently tagged nucleotide conjugates from longexposures to light.
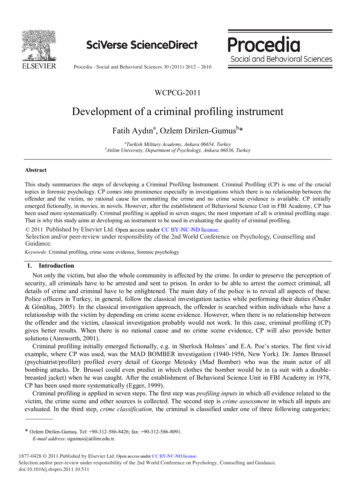
1. Laser Cut and Laser Capture Microdis- section:Isolate specific cells of interest using laser capture microdissection instrumentation from Arcturus according to the manufacturer’sprotocol.2. RNA Extraction and Isolation:Perform RNA extractions and isola- tions using the Arcturus PicoPure RNA Isolation Kit or the Paradise Reagent System accordingto the manufacturer’s protocol. Expected total RNA yield will vary depending on starting material. Note: The quantity of total RNA extracted is dependent on several factors, including cell type and tissue quality. Certain cell types, such as monocytes, may yieldextremely low RNA quanti- ties, and may fall below the guidelines mentioned here. Please contact Arcturus Technical Support forquestions related to RNA yield.3. RNA Quantity and Purity Assessment:This step is optional and may be per- formed if the starting cell number is 1000 cells. Total RNA can be quanti- tated, and thepurity assessed, using the NanoDrop ND-1000 Spectropho-tometer (figure 1a), while the quality of the total RNA can be determinedusing the RNA 6000 PicoLabChip on the Agilent 2100 bioanalyzer (figure 1b). RNA concentrations 2ng/μL or 260/280 ratios 1.6,as determined by NanoDrop ND-1000, may indicate incomplete extraction, inefficient isolation, or copurification of other cellularmateri- al. Furthermore, if the 2100 bioanalyzer output profiles do not exhibit clean 28S and 18S peaks as shown in Figure 1b, it maysuggest degradation of the extracted RNA. If problems with RNA quantity and quality are observed, it is recommended beforeproceeding, to evaluate tissue processing, LCM and RNA extraction procedures, and repeat steps as necessary.Instrumentation and Kits
Figure 1a. NanoDrop ND-1000 spectropho-tometer display output for2-5ng of total RNA.Figure 1b. Bioanalyzer profile of total RNA isolated using ArcturusPicoPure RNA Isolation Kit and run on the Agilent 2100 bioanalyzer usingthe RNA 6000 Pico LabChip .4. First Round RNA Amplification:Estimated total RNA quantity is used to determine the appropriate kit for RNA amplification (see Table 1).5. Check Yield (optional):Note: Checking the yield after one round of amplification is optional and serves the purpose of assessing the success of the firstround of amplification only. It is recommended to use all of the material generated after the first round of amplification to processthrough a second round of amplification in order to generate mi- crogram quantities of aRNA. Yield and quality assessment after thefirst round of amplification may significantly reduce the end product yield when starting with very limited material.Quantitate 1 μL of amplified RNA (aRNA) product using the NanoDrop ND-1000 Spectrophotometer according to the manufacturer’sspecifications.5.1 Using the Nucleic Acids module of the NanoDrop software, select RNA-40 as the constant for measuring aRNA.5.2 For optimal results, thoroughly mix and briefly spin down the aRNA sample prior to removing 1 μL from the top of the solution.This step will prevent inter- ference caused by potential residual silica from the column purification procedure.5.3 The yield can be theoretically calculated based on starting cell input. Example of yield assessment: With a starting cell input of1000 cells and assuming 10pg of RNA per cell, one can expect a yield of 10ng of total RNA. Message content in 10ng of totalRNA will be approximately 100-200pg. One round of amplification using the Arcturus Amplification kits will produce 1000-3000fold amplification, resulting in at least 100-600ng of total aRNA.6. First and Second Strand Synthesis (Sec- ond Round of RNA Amplification):Use the materials and protocols provided in the primary RNA amplification kit to produce cDNA from aRNA made during the first round ofRNA amplification.7. Amino Allyl UTP Incorporation (Sec- ond Round of RNA Amplification):Use the double-stranded cDNA as the template for a second round of amplifica- tion with simultaneous labeling using a commercialkit (Fluorescent Linear Amplification Kit, Agilent), then perform 5-(3-aminoallyl)-UTP (aaUTP) incor- poration according to themanufacturer’s protocol.8. Check Yield:Quantitate 1μL of aaUTP aRNA product using the NanoDrop ND-1000 Spectrophotometer according to the manufacturer’sspecifications.Under the Nucleic Acids module of the NanoDrop software, select RNA-40 as the constant for measuring the aaUTP aRNA. Expectedyield is approximately 30-70μg of total aaUTP aRNA, from a starting input of 10ng of total RNA.Note: Due to the large amount of aRNA generated after the second round of am- plification, a 2 to 4-fold dilution of final aRNA maybe required for accurate read- ing on the ND-1000 spectrophotometer.Table 2. Amino-allyl incorporation rates as measured by the NanoDrop ND-1000. A ratio of 0.2- 0.3indicates adequate incorporation of amino allyl.
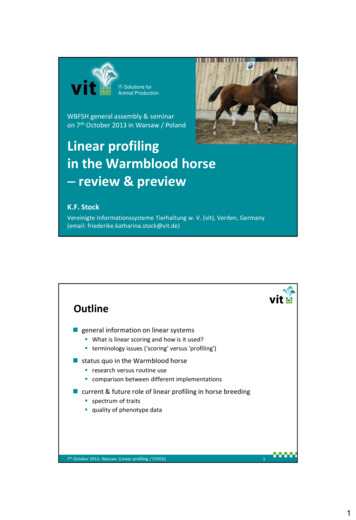
Table 3. Chart of example FOI data as derived from NanoDrop ND-1000.Figure 2a. Agilent 2100 bionalyzer profiles of amino allyl-labeled aRNA.Figure 2b. Agilent 2100 bioanalyzer profile of biotin labeled aRNA.Figure 3. NanoDrop ND-1000 as used for FOI assessment. Cy3 and Cy5dyes are ob- served at the expected wavelengths of 550nm and 650 nmrespectively.9. Check aaUTP Incorporation:By measuring the amount of amino allyl that is incorporatedinto the aRNA, one can better estimate how well the aRNAwill label with the dye. Poor incorporation of the amino allylcan result in inef- ficient labeling which will lead to reduced dyesignal and loss of data. Assess the incorporation of aaUTP bychecking the 289/260 ratio using the ND-1000. Generally, aratio of 0.22-0.32 indicates adequate incorporation of amino allyl.In such instances that the ratio is not within this desired range,the relation of the amino allyl RNA to nonamino allyl RNA shouldbe noted. A ratio for the amino allyl RNA of at least 0.06 higherthan that of the non-amino allyl RNA is equally acceptable.Using the ND-1000 to assess the incorporation of amino allylis a useful tool for preventing experimental failure due to poorlabeling (See Table 2 for an example of amino allyl incorporationassessment using the NanoDrop ND-1000).10. Check RNA Quality:Assess aaUTP aRNA quality using the RNA 6000 Nano LabChip on the Agilent 2100 bioanalyzer according to manufacturer’sprotocol (Figures 2a and 2b).11. Fluorescent Dye Coupling:Prepare NHS ester dye according to manufacturer’s protocol,using one of the following recommended commercial kits: AmershamBiosciencesCyDyePostLa-beling Reactive Dyes Perkin Elmer Cy Dyes Molecular Probes Alexa Dyes.12. Check Labeling Efficiency:Measure 1μL of labeled aRNA probe using the NanoDrop ND-1000 Spectro- photometer. Using a sample with sub-optimal frequency of incorporation (FOI) may result in low signalon the array, leading to loss of data.12.1 Using the Microarray module of the NanoDrop software,select RNA-40 as the constant for measuring the aRNAcomponent of the labeled probe. Ensure the appropriatedye type has been selected for measuring the dyecomponent of the labeled probe.12.2 The guidelines below can be used to determine if theFOI of the fluorescent dye is suitable for microarrayhybridization. The example shows the use of Cy3 andCy5 dyes: Measure the absorbance of the fluorescent componentof the labeled probe by selecting the appropriate dyefrom the drop down menu in the Microarray module.In this case, Cy3 and Cy5 are selected which will placethe spectrum cursors at the appropriate wavelengths(550 nm and 650 nm respectively). Calculate the FOI of Cy3 (OD550/ 0.15)*(324)/(OD260*40) Calculate the FOI of Cy5 (OD650/ 0.25)*(324)/(OD260*40) FOI readings 20 indicates adequate- ly labeled probe,suitable for array hy- bridization. FOI readings between 15 and 20 are lower thanrecommended but still useable. The investigator shouldnote that signal issues with the final array data mightbe due to the lower FOI.
FOI readings lower than 15 should be treated withcaution. These samples may not be suitable forhybridization to microarrays.13. Perform Expression Array Analysis:Labeled RNA input will depend on the desired type of expressionarray platform.ConclusionThe concerted use of several new technologies allows researchinvestigators to perform microgenomic expression profiling fromextremely limited cell mass. LCM and LC provide the means ofprecise cell separation from heterogeneous tissue. Advancedisolation systems and amplification protocols produce sufficientmaterial for microarray probe labeling. Bioanalyzer systems aswell as novel microspectrophotometry bring a high level of qualityassurance and confidence. The combined use of these varioustechnologies provides a micogenomic work flow from cell separationthrough expression analysis with unprecedented process control.Systems for Microgenomics, Veritas, PixCell, RiboAmp, PicoPure,Histogene, MiraCol, and CapSure are trademarks owned byArcturus. All other trademarks shown are the property of theirrespective owners.For Research Use Only. Not For Use In Diagnostic Procedures.
2. RNA Extraction and Isolation: Perform RNA extractions and isola- tions using the Arcturus PicoPure RNA Isolation Kit or the Paradise Reagent System according to the manufacturer's protocol. Expected total RNA yield will vary depending on starting material. Note: The quantity of total RNA ex-