Transcription
Zhou and Zhao Genome Medicine (2018) ODOpen AccessPrioritization and functional assessment ofnoncoding variants associated withcomplex diseasesLin Zhou1,2 and Fangqing Zhao1,2,3*AbstractUnraveling functional noncoding variants associated with complex diseases is still a great challenge. We present anovel algorithm, Prioritization And Functional Assessment (PAFA), that prioritizes and assesses the functionality ofgenetic variants by introducing population differentiation measures and recalibrating training variants.Comprehensive evaluations demonstrate that PAFA exhibits much higher sensitivity and specificity in prioritizingnoncoding risk variants than existing methods. PAFA achieves improved performance in distinguishing bothcommon and rare recurrent variants from non-recurrent variants by integrating multiple annotations and metrics.An integrated platform was developed, providing comprehensive functional annotations for noncoding variants byintegrating functional genomic data, which can be accessed at http://159.226.67.237:8080/pafa.Keywords: Complex disease, Functional annotation, Genetic variant, Variant prioritization, Noncoding variantBackgroundRecent advances in sequencing technologies haveenabled the identification of an increasingly largespectrum of variants within the human genome [1].However, unraveling the genetic architecture of complexdiseases is still a great challenge, particularly identifyingfunctionally relevant variants in noncoding regions [2,3]. Previous studies have interpreted coding variantsbased on our understanding of the genetic code andsplicing [4]. Many existing computational approacheshave been developed for prioritizing these variants, suchas SIFT [5] and PolyPhen [6]. Noncoding variants,however, are noticeably understudied due to our poorunderstanding of noncoding regions in the humangenome. Most recently, tremendous progress has beenachieved in both large-scale functional genome projects(e.g., ENCODE [7] and FANTOM5 [8]) and humangenome resequencing projects (e.g., 1000 GenomesProject [9]), which provide a rich resource of genomic* Correspondence: zhfq@biols.ac.cn1Computational Genomics Lab, Beijing Institutes of Life Science, ChineseAcademy of Sciences, Beijing 100101, China2University of Chinese Academy of Sciences, Beijing 100049, ChinaFull list of author information is available at the end of the articleannotations for analyzing and predicting the functionaleffects of both coding and noncoding variants.Recently, several computational approaches, including both unsupervised and supervised algorithms,have been developed to prioritize noncoding variantsby integrating various genomic features, includingfunctional annotations and evolutionary conservation.To prioritize risk variants, unsupervised statisticalmethods (e.g., GenoCanyon [10] and Eigen [11]) construct discriminative models based on conditionalprobability distributions, which rely on strong modelassumptions. Supervised methods (e.g., CADD [12],FATHMM series [13–15], DANN [16], GWAVA [17],and DIVAN [18]) do not rely on a priori assumptions;instead, they label the training data as deleterious orbenign and fit a model that best separates the twosets. These integrative supervised methods generallyoutperform those based on any single individual feature [11, 12] and frequently provide more than onescore depending on the regions considered (e.g., coding, noncoding) and the appropriate feature sets forthat region. The scores, however, sometimes may leadto conflicting evaluation results for variants. Besides,some of these methods have intrinsic limitations inprioritizing specific categories of risk variants. For The Author(s). 2018 Open Access This article is distributed under the terms of the Creative Commons Attribution 4.0International License (http://creativecommons.org/licenses/by/4.0/), which permits unrestricted use, distribution, andreproduction in any medium, provided you give appropriate credit to the original author(s) and the source, provide a link tothe Creative Commons license, and indicate if changes were made. The Creative Commons Public Domain Dedication o/1.0/) applies to the data made available in this article, unless otherwise stated.
Zhou and Zhao Genome Medicine (2018) 10:53example, CADD constructed a model based on thetraining variants that have been under long-termselective pressure, which made it perform less well oncertain disease-associated variants under weak evolutionary constraint, such as those influencing the riskof complex traits [11, 12]. LINSIGHT [19] wasconstructed based on the premise of inferring theselective pressure on noncoding sites and worked verywell on identifying human noncoding variants associated with inherited diseases; however, this premisemay not hold in all cases, such as those in which thevariants increase the risk for post-reproductive diseases[19]. In addition, except for genomic annotations andconservation measures, all the currently available methodsseldom consider population-level statistical measures (e.g.,F statistics [20]), which may be helpful to prioritizecommon variants. Although supervised learning demandsa representative and correctly labeled training set, a majorproblem for these methods is the use of mislabeled variants in the training stage, which may lead to false predictions by supervised classifiers. For example, DIVANlabeled variants from the 1000 Genomes Project as benignwith few controlling or filtration steps. A considerablefraction of the variants in the 1000 Genomes is reportedto be involved in various complex diseases or traits [21,22]. CADD labeled fixed or nearly fixed derived alleles inhumans as benign and simulated de novo variants asdeleterious. However, such simulated de novo variantsmay contain a substantial proportion of benign variants,which thus may lead to false predictions.Here, we present a novel supervised algorithm forPrioritization And Functional Assessment (PAFA) ofgenetic variants associated with complex diseases ortraits, especially for population-specific noncodingvariants. PAFA can prioritize functional variants innoncoding regions by utilizing all kinds of availableannotations and metrics, including genomic annotations,evolutionary conservation metrics, and population levelmeasures. In particular, a newly introduced feature, FST,which is frequently used as a summary of genetic differentiation among groups [20], can significantly helpPAFA prioritize population-relevant functional variantsin noncoding regions over background variants. Inaddition, to obtain more reliable training variants, PAFAutilizes training data from various curated databases,and it employs multiple filtration strategies for variantlabeling. Through comprehensive evaluations of bothcommon and rare variants, we demonstrate that PAFAexhibits a much better performance on prioritizing bothcommon and rare complex disease-associated variantsover benign variants as well as discriminating betweennoncoding recurrent variants and non-recurrent variantsthrough the incorporation of multiple features andthe optimization of training datasets. Moreover, aPage 2 of 18user-friendly web server (http://159.226.67.237:8080/pafa) was constructed that not only allows users toevaluate variants by PAFA but also provides comprehensive functional annotations by integrating abundant functional genomic elements.MethodsData and annotation sourcesGenetic and genomic resources used to construct andvalidate the PAFA algorithm are mainly divided intothree categories (Fig. 1 and Additional file 1: Figure S1).Firstly, PAFA selected variants from the 1000 GenomesProject (Phase 3) [9], ClinVar (released in 2018/3/1)[23], and GWASdb (v2) [24] as the training set of PAFA.The functional variant dataset included variants labeled“pathogenic” in ClinVar and significant SNPs associatedwith complex traits or diseases (cSNPs) that overlap withknown genomic elements from GWASdb. Correspondingly, variants labeled “benign” in ClinVar and variantsin 1000 Genomes were treated as a control dataset. Thecalculation of PAFA scores is based on the GRCh37/hg19 human genome assembly, as the new genome build(GRCh38) still lacks enough genomic annotations compared with GRCh37. Here, we integrated a lift-over tool[25] for users who choose GRCh38 as the reference.Secondly, PAFA selected annotations from knowndatabases as features to annotate training variants and toevaluate new variants. These features can be dividedinto three classes: evolutionary conservation metrics,genomic annotations, and population differentiationmeasures. For evolutionary conservation, two measures,phastCons [26] and phyloP [27], were obtained. Conservation scores based on the comparison of both 46 and 100vertebrate genomes were used. For genomic annotations,PAFA used both genic context information, such asdistance to nearest transcript start site (TSS) fromGENCODE v19 annotation [28] and information fromthousands of functional genomic elements across differentcell types, including histone modifications, RNA polymerase binding, and transcription factor binding sites (TFBSPeakSeq). For population differentiation measures, FSTand dispersion score (DS) were calculated based on allelefrequencies and sample sizes of the five super populations.Based on the coding and noncoding annotations, we alsobuilt a gene-centric database to provide gene-level annotations for variants. To determine which variants may affectgene expression, we retrieved annotated exons and transcription start site information from GENCODE v19 [28]and 5′-UTR and 3′-UTR data from UTRdb [29]. Thepredicted enhancers that regulate the target genes werealso obtained [30]. In addition, we recorded intron regionsthat are overlapped with any annotations, such as openchromatin and transcription factor binding sites (TFBS),from ENCODE [31]. With this integrated genomic
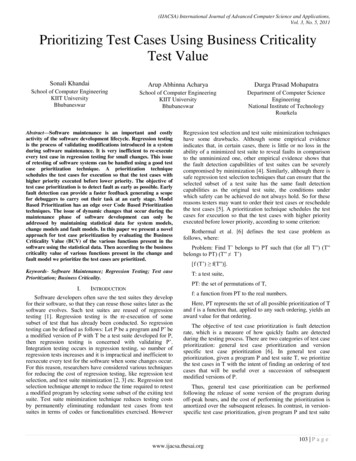
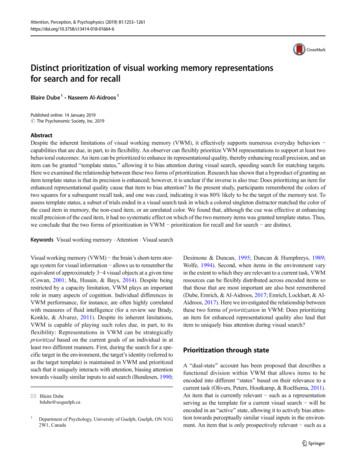
Zhou and Zhao Genome Medicine (2018) 10:53Page 3 of 18Population level metricsFST & DSAllele frequenciesEvolutionary conservationphastCons (46 & 100 way)phyloP (46 & 100 way)Genomic tated enhancerTSSExonHistone ChIP-seqRNA polymerase bindingTF ChIP-seqDnase/FAIRE-seqDistance to nearest TSSTraining dataannotated by featuresControlvariantsBenignClinVarSparse logisticregression with L1regularizationPAFA classifierPAFA gene-centricannotation1000 GenomesFeaturesFeaturesGWASdbPrioritization andfunctional assessmentSimulated benignvariantsTest datasetFig. 1 Flowchart of the PAFA approach. The flowchart contains the construction of the PAFA classifier and the gene-centric annotation. The PAFAclassifier is based on sparse logistic regression with L1 regularization. We label the variants used in the training stage of PAFA as the functionaland control sets. The features used in PAFA include three categories: population-level metrics, evolutionary conservation, and genomicannotations. Gene-centric annotation is based on curated genomic databases, including ENCODE and UTRdbannotation system, PAFA can link a variant to knowngenes or genomic elements.Thirdly, we used test sets from seven public databases(the 1000 Genomes Project Phase 3, ClinVar, GWASCatalog [32], COSMIC v79 [33], TCGA [34], GRASPv2.0 [35], and ICGC [36]) and variants from three recentstudies including 916 breast cancer variants [37], 221human blood metabolites variants [38], and 1764 macular telangiectasia type 2 variants [39], to compare PAFAwith other available methods (Additional file 1: FigureS1). We used five different types of variant sets fromfour databases to perform a comprehensive evaluation,including benign and pathogenic coding variants ofClinVar, common variants with frequencies of at least1% in the population studied in 1000 Genomes, complexdiseases or trait-associated SNPs (cSNPs) of the GWASCatalog, and recurrent noncoding variants of COSMIC.Then, we used Mendelian disease-associated variants ofClinVar and complex disease-associated variants from560 breast cancer samples in a recent study andTCGA database to compare their performance onprioritizing coding risk variants. We used variants ofGRASP, 221 variants associated with human bloodmetabolites, and 647 common variants associated withmacular telangiectasia type 2 to assess PAFA’sperformance in prioritizing noncoding variants associated with complex diseases or traits. Finally, we usedvariants from ICGC Cancer Genome Projects toassess PAFA’s ability in discriminating both commonand rare recurrent from non-recurrent variants and inprioritizing noncoding rare risk variants from adjacentcommon variants.For the PAFA online platform, it was integrated withseveral additional utilities, including 1000 GENOMES,ANNOTATION, VSEA, and SEARCH (Additional file 1:Figure S2–5). Due to the population-scale sequencingfeature of variants in the 1000 Genomes Project, the1000 GENOMES part of the online platform utilized thepopulation differentiation index and allele frequency of aspecific variant among human populations to assist theprioritization and annotation of target variants. Correspondingly, except for known variants and genomicresources mentioned above, these utilities were also integrated with other resources. First, the ANNOTATIONpart of online platform integrated variants from dbSNP[40], NHLBI-Exome Sequencing Project v2 (ESP) [41],YanHuang Project [42], CNV of 100 pancreatic ductaladenocarcinomas (PDACs) [43], schizophrenia somatic
Zhou and Zhao Genome Medicine (2018) 10:53deletions in brain [44], and 996 ASD rare CNVs [45] toannotate input variants. With these annotated resources,we can determine whether the input variants overlapwith known variants through the online platform.Simultaneously, the ANNOTATION part also integratedwith a variety of curated databases containingdisease-associated genes, including Online MendelianInheritance in Man (OMIM) [46], the GeneticAssociation Database (GAD) [47], and COSMIC [33], torecognize potential disease-related variants. In addition,the VSEA part incorporated canonical pathways fromthe Molecular Signatures Database (MSigDB v6.1) [48],to perform enrichment analysis on variants based onthese included pathways.In total, 23 curated genetic and genomic resourceswere integrated into the PAFA online platform (Additional file 1: Figure S6), including known variants,various annotations, disease-associated genes, and pathways. All annotations are represented in the GRCh37assembly of the human genome.Construction of functional and control variant sets inPAFAThe training set of PAFA was mainly derived fromcurated databases, including ClinVar, GWASdb, and1000 Genomes. Considering that these public databases may contain redundancies and erroneous orconflicted records, we employed multiple filtrations toremove low-confidence variants (Additional file 1:Figure S7). We firstly eliminated conflicted records inthe training set that are labeled “benign” and “pathogenic” in ClinVar at the same time. A possibleexplanation is that these variants do not cause certaindiseases, but they may contribute to the developmentof diseases in other cases [49, 50]. Therefore, theywere removed from the control dataset, but they werekept in the functional dataset. In total, 30,277 “pathogenic” and 13,010 “benign” variants from ClinVarwere included in PAFA. Twenty four thousand ninehundred ninety-three cSNPs from GWASdb wereselected as extremely significant variants using athreshold of p 10E 8. After removing cSNPs thatshare no overlap with known genomic elements,11,570 variants from GWASdb were used in PAFA. Toselect non-functional variants from 1000 Genomes, werandomly selected 100,000 variants from 1000 Genomeswith a low FST ( 0.01) along with the filtration ofredundant records in GWASdb and constructed aregression model for cSNPs in the training set on the basisof 7131 evaluation features. L1-regularized logistic regression, which is provided by LIBLINEAR [51], was used toconstruct the model. Using the constructed regressionmodel, we determined the numerical measures of these100,000 variants with little genetic differentiation. WePage 4 of 18ranked these variants according to their numerical output,as negative values mean variants inversely associated withcSNPs in the training set. According to their ranking,28,837 inversely associated variants were selected as acontrol dataset by PAFA.As described above, we introduced variants fromClinVar, GWASdb, and 1000 Genomes, includingpathogenic/benign coding variants and common functional/benign variants. Ultimately, 41,847 functional and41,847 control variant datasets were used by PAFA(Additional file 1: Figure S7).Selection and analysis of features in PAFABased on the existing classifiers, PAFA first pre-selected7131 features that may be sensitive to noncodingvariants, which can be divided into three classes,including conservation metrics, genomic annotations,and population differentiation measures. We introducedfour evolutionary conservation scores, including 46 and100 ways of phastCons and phyloP measures. Forgenomic annotations, we introduced eight types offeature groups from ENCODE [7], including histonemodifications (ChIP-Seq), RNA contigs (Long RNA-seq),transcription factor binding sites (TFBS PeakSeq andSPP), open chromatin (DNase-Seq and FAIRE), andtranscript start site (TSS).For population differentiation measures, we introducedallele frequencies of five super populations, includingAfrican, American, East Asian, European, and SouthAsian. We calculated FST and dispersion score (DS) basedon allele frequencies and sample sizes of the five superpopulations. For a given genomic locus, consider isubpopulations (where i 1, , s) and suppose that theobserved allele frequencies are p1, , ps and the samplePPsizes are n1, , ns. Let n ¼ si¼1 ni and n ¼ si¼1 ni s.Wright’s unbiased FST [52] is estimated asF ST ¼MSP MSGMSP þ ðnc 1Þ MSGwhere MSG denotes the observed mean square errorsfor loci within populationssX1ni pi ð1 pi Þi¼1 ni 1 iMSG ¼ Psand MSP denotes the observed mean square errors forloci between populations,MSP ¼s1 Xni ðpi pÞ2s 1 iwith p as a weighted average of pi across populations
Zhou and Zhao Genome Medicine (2018) 10:53p ¼ n i pi Xni iand nc is the average sample size across samples thatalso incorporates and corrects for the variance in samplesize over populations.nc ¼P 2s1 Xnni Xi is 1 i¼1niiThe dispersion score is calculated �ffiffiffiffiffiffiffiffiffiffiffiPs¼2i¼1 ðpi p ÞDS ¼nwith¼ Xp ¼pi ssi¼1We constructed feature vectors for variants. Thesefeatures had fixed unique sequence numbers. Weperformed tenfold cross-validation with the training setmentioned above to assess the pre-selected features inPAFA, including four conservation scores, seven types offeature groups for genomic annotations, and threepopulation differentiation measures (Additional file 1:Figure S8). All annotation feature groups employed byPAFA have the ability to prioritize functional variantsfrom a control set, with AUC values larger than 0.5.Thus, PAFA adopted all these features to annotatevariants.Model training and performance comparisonWith a mass of instances and features, PAFA employedLIBLINEAR [51] to construct an ensemble discrimination model against variants. LIBLINEAR is an efficientand open source library for large-scale linear classification. PAFA treated features of a variant without anoverlapping relationship as missing values and took L1regularization to construct a sparse model. PAFAadopted the logistic regression implemented in LIBLINEAR, which was used to calculate the probabilityPAFA scores for variants.To evaluate the performance of PAFA in prioritizingfunctional variants, seven widely used classifiers werecompared with PAFA, namely, CADD, FATHMM-MKL,DANN, GWAVA, DIVAN, LINSIGHT, and Eigen.CADD has updated three versions since its publication.Here, the latest version of CADD was used to generateC scores for variants. By using different genomic annotations, FATHMM-MKL provided two different scores,namely, a “coding score” and a “noncoding score,” whichPage 5 of 18were deemed to prioritize coding and noncodingvariants, respectively. We used both scores for comparison. Based on different training sets from 1000Genomes, GWAVA provided three independent scores,Region, TSS, and Unmatched, which were all used forperformance comparisons. Similar to GWAVA, DIVANalso provided Region and TSS scores. Considering thatDIVAN provided disease-specific scores for SNPsassociated with 45 diseases or phenotypes, PAFA wascompared to DIVAN on discriminating these disease- orphenotype-related variants. Moreover, Eigen providedtwo scores for evaluating variants by using differentalgorithms. To compare with Eigen, we downloaded theEigen scores of the testing sets from its website (http://www.columbia.edu/ ii2135/download.html) and alsocompared with their pre-computed Eigen and Eigen-PCscores. In addition, we also obtained testing sets fromthe latest publications and public databases, includingGRASP and TCGA. We removed all the variants thatoccurred in the training set of PAFA from these testingsets. We used AUC values and p values (Wilcoxonrank-sum test) to evaluate the performance of thesemethods.Construction of the online platformTo facilitate the use of PAFA, we built an onlineplatform for the navigation or batch download of targetvariants. This platform was developed using Java andwas deployed on a Tomcat server. We developed theuser interface using HTML5, JavaScript, and D3.js. Inaddition to conveniently accessing PAFA scores, theonline platform incorporates other functions, such asevaluating target variants relying on prior databasescontaining disease-associated genes, providing enrichment analysis on variant set and relevant annotationinformation from 1000 Genomes and genomic databases,such as ENCODE and OMIM.To evaluate variants using information fromgene-disease databases (e.g., OMIM, GAD), we firstmapped the variants to a range of annotated elements,such as exons, TSS, 3′-UTR, 5′-UTR, enhancers, TFBS,and open chromatin, based on the abundant annotationsource integrated in our database. As variants in different types of elements cause discrepant influences ongene expression, we set empirical weights to variantsbased on different types of elements. In addition, theproportion of overlapping section was considered. Afterretrieving the involved genes, a quantitative value wasassigned to the variants in the following way, accordingto the occurrence frequency of genes in currentgene-disease databases.Assume that the target variant overlapped with mdifferent genes and n different elements were influencedby each gene. Then, let Le j be the ith gene’s jth element’s
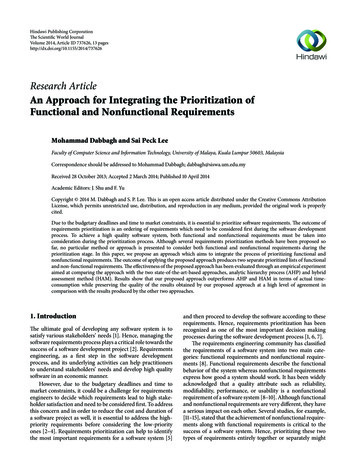
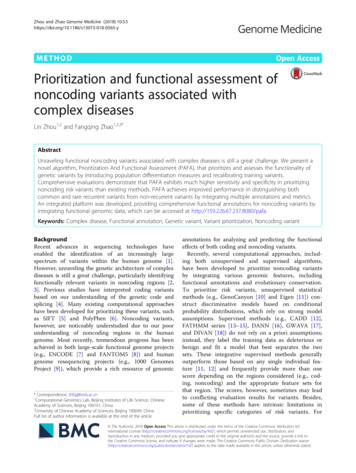
Zhou and Zhao Genome Medicine (2018) 10:53length and Loij be the overlapped length between variantand the ith gene’s jth element. WT represents the weightvalue of the type of element, which is set to 1.0 for exonand TSS, 0.5 for 3′-UTR and 5′-UTR, 0.3 for enhancer,0.2 for TFBS (PeakSeq) and TFBS (SPP) in the gene, and0.1 for the gene’s open chromatin. si indicates the ithgene’s frequency as it appears in gene-disease databases.The score is calculated asscore ¼XmSi¼1 itest variants and background variants (user uploaded orselected) to a range of annotated elements. Then, weobtained genes related to the test and backgroundvariants. Next, we extracted the related pathways ofthese genes in MSigDB. Finally, according to therelationships among variants, genes, and pathways, wecalculated the p value to estimate the enrichment degreein relevant pathways using Fisher’s exact test.ResultsPopulation differentiation of genetic variants associatedwith complex diseases or traitswithS i ¼ si min1;Page 6 of 18XnLoij WTj¼1 LejTo provide enrichment analysis for the target variantsets, we included background variant sets, such asvariants from 1000 Genomes, genomic annotations fromENCODE, and canonical pathways in the MolecularSignatures Database (MSigDB). First, we mapped theTo explore the relationship between the populationdifferentiation of genetic variants and common complexdiseases or traits, we extracted SNPs associated withcomplex traits or diseases (cSNPs) from GWASdb [24].Multiple categories of diseases/traits were chosen,including cancers, cardiovascular diseases, and mentaldisorders, as well as complex traits, such as hair color,adiposity, and intelligence (Fig. 2). Subsequently, weobtained population-specific allele frequencies of theseFig. 2 Population differentiation of genetic variants associated with complex diseases or traits. Thirty-five complex trait-/disease-associated SNP(cSNP) sets from GWASdb are listed. The color of the left-most bars represents the different types of diseases/traits, and the length of the barsrepresents the number of cSNPs in the sets. Adjacent stack bars represent the percentage of different differentiation degrees among each cSNPsset. The following four column stack bars exhibit different degrees of allele frequencies among super populations, namely, African (AFR), EastAsian (EAS), European (EUR), and South Asian (SAS)
Zhou and Zhao Genome Medicine (2018) 10:53cSNPs in four super populations (AFR, EAS, EUR, andSAS) derived from the 1000 Genomes project (Phase 3variant calls). The corresponding allele frequency spectrain super populations for each disease/trait category werevisualized in violin graphs. As shown in Additional file 1:Figure S9–12, cSNPs associated with different diseasesor traits exhibited noticeably different allele frequencies,with certain diseases overrepresented in specific populations. For example, over 50% of testicular cancer-relatedSNPs occurred in more than half of Europeans, but inless than 25% of Africans. This is consistent withepidemiologic findings that testicular cancer incidenceconsistently remained the highest in Northern Europeanpopulations and the lowest in African populations [53,54]. To investigate the population genetic predispositions underlying these cSNPs, we introduced the fixationindex (FST), which is a measure of population differentiation due to genetic structure. With allele frequenciesand sample sizes of the five super populations availablefrom 1000 Genomes, we calculated the unbiasedestimates of FST for cSNPs. The frequency distributionof FST for each disease/trait category was shown inAdditional file 1: Figure S13. According to the criteria[55] that FST lower than 0.05 means little genetic differentiation and FST larger than 0.25 means high geneticdifferentiation, most of the cSNPs exhibited high geneticdifferentiations in human populations.Furthermore, we examined 35 cSNP sets to get acomprehensive look at the relationship between thepopulation differentiation of cSNPs and their associatedcomplex diseases/traits. As shown in Fig. 2, the proportion of cSNPs with large (FST 0.25), moderate (0.05 FST 0.25), and little (FST 0.05) genetic differentiationwas displayed in different colors. The number of cSNPswith 10% allele frequencies that were higher or lowerthan all other populations was calculated in eachcategory based on known allele frequencies in humanpopulations. As illustrated in the four right-most columnstack bars of Fig. 2, the dark gray bar represents thefrequency of cSNPs in a super population that is higherthan all other super populations, and the light gray barrepresents the frequency of cSNPs in a super populationthat is lower than all other super populations. Clearly,the majority of cSNPs display a strong preference towards specific human populations. For example, cSNPsassociated with hair color showed a high occurrence inthe European population, with nearly a half of themfrequently occurring in European populations, which isconsistent with previous studies [56, 57]. More examplescan be seen in cancer-related diseases. Of the 1828prostate cancer-related SNPs curated from multipleliterature sources, more than half showed great geneticdifferentiation among super populations. Out of thesecSNPs, 720 were reported to likely occur in the AfricanPage 7 of 18population, but not in other populations. In fact, AfricanAmerican men have the highest prostate cancerincidence rate in the world, although the rate in theAfrican population is unclear [58, 59]. Taken together,these examples indicate that different cSNPs exhibitvarious levels of population differentiation, and theincorporation of FST or other allele frequency featuresmay help evaluate the significance of human geneticvariants.The PAFA approachThe PAFA algorithm contains two components: prioritizing functional genetic variants and annotating variantsby integrating a priori functional genomic data (Fig. 1).To discriminate potential functional variants frombackground variants, sparse logistic regression with L1regularization was applied to train a noncoding sensitivediscriminative model. To be noncoding sensitive, PAFAutilizes training data sets located in noncoding regionsand selects features with the ability to prioritize noncoding variants. First, the training variants were partlyderived from ClinVar, GWASdb v2, and 1000 Genomes.PAFA classified them into two distinct variant sets (functional and control) with multiple filtration steps, including filtering duplicates and conflicting records, selectingelement-overlapping SNPs associated with complextraits or diseases, and measuring the similarity betweencommon variants from 1000 Genomes and functionalvariants based on various annotations. For the functionalvariant set, variants annotated as “pathogenic” inClinVar were first selected; these variants are mainly located in coding regions. Considering that genome-wideassociation studies have reliably linked coding ornoncoding genetic variants to complex diseases or traits,significant cSNPs (p value 10E 8) in GWASdb wereselected as another source of the functional variant set.Noncoding SNPs may affect target gene
which thus may lead to false predictions. Here, we present a novel supervised algorithm for Prioritization And Functional Assessment (PAFA) of genetic variants associated with complex diseases or traits, especially for population-specific noncoding variants. PAFA can prioritize functional variants in noncoding regions by utilizing all kinds of .