Transcription
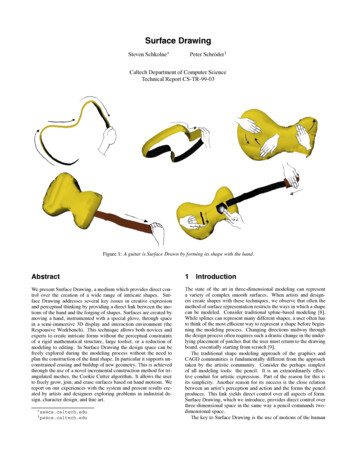
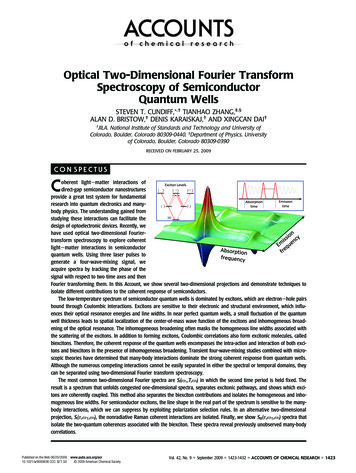
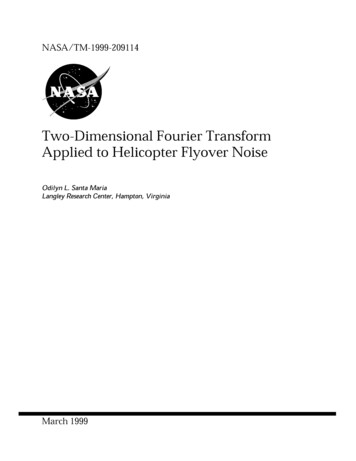
Analytical and Bioanalytical 3RESEARCH PAPERDevelopment of a two‑dimensional liquid chromatography‑tandemmass‑spectrometry method for the determination of vitamin D2in mushroomsSieglinde Zelzer1,2· Andreas Meinitzer1 · Dietmar Enko1,3 · Markus Herrmann1 · Walter Goessler2Received: 30 May 2022 / Revised: 5 August 2022 / Accepted: 10 August 2022 The Author(s) 2022AbstractDifferent foods, especially mushrooms, are a valuable source of vitamin D2. However, published concentrations in mushrooms show large variabilities. One reason for this is certainly the high biological variability caused by growth conditions,and another could also be found in the analytical methodology. Therefore, this study aimed to develop a sensitive and highlyselective two-dimensional liquid chromatography mass spectrometry (LC–MS/MS) method for vitamin D2 analysis inmushrooms. After validation, the method was applied to four different mushroom species. The developed method with aone-step extraction procedure showed a limit of detection of 0.01 µg vitamin D2/g dry mass (DM), a limit of quantificationof 0.05 µg vitamin D2/g DM, and recovery rates between 87.6 and 94.8%. The total run time including the re-equilibrationof the columns for the next injection was 7.5 min. After adding increased concentrations of pure substance to Pleurotusostreatus, Lentinula edodes, and brown and white button mushrooms the standard addition plot showed excellent correlationcoefficients (R2) of 0.9994. Mean vitamin D2 concentrations were observed at 0.122 0.007, 0.074 0.005, 0.099 0.007,and 0.073 0.005 µg/g DM. The coefficient of variation (CV) was between 5.1 and 7.6%. This well-optimized, sensitiveLC–MS/MS method, with a fast and simple sample preparation and a short run time, can be applied to future studies especially in different mushroom species with variable growing conditions. This will improve our knowledge about the vitaminD2 content in mushrooms.Keywords Vitamin D2 · LC–MS/MS · Mushrooms · Standard addition · IrradiationIntroductionVitamin D deficiency is a worldwide common condition,which is assessed with 25 hydroxyvitamin D (25(OH)D)blood concentrations. Independently of the 25(OH)D measurement methodology, a very large number of children andadults suffer from it [1]. Many studies have suggested that aninadequate intake of vitamin D is associated with differentpathophysiological processes. This fact may increase the riskof osteomalacia, rickets and several other diseases including* Sieglinde al Institute of Medical and Chemical LaboratoryDiagnostics, Medical University of Graz, Graz, Austria2Institute of Chemistry, University of Graz, Graz, Austria3Institute of Clinical Chemistry and Laboratory Medicine,General Hospital Hochsteiermark, Leoben, Austriapsoriasis, multiple sclerosis, inflammatory bowel disease,type 1 and 2 diabetes, hypertension, cardiovascular disease,metabolic syndrome, and various forms of cancer [2–4]. Ageneral public health intervention, which includes vitaminD supplementation and systemic vitamin D food fortification to avoid severe vitamin D deficiency, would appear tobe important [5].The recommended daily vitamin D intake is age-dependent, namely an intake of 5 µg/day from 0 to 50 years, 10 µg/day between 51 and 65 years, and 15 µg/day above 65 yearsis suggested [6]. Vitamin D3 (cholecalciferol) is mostlyformed from 7-dehydrocholesterol (provitamin D3) throughultraviolet-B (UV-B) irradiation of the skin [7]. However,this amount is very often insufficient especially in winter, because the direct sun light in the north hemisphere isinsufficient for adequate vitamin D production. Since different foods are a source of vitamin D, this uptake shouldbe increased. Vitamin D3 is found only in animal sourcessuch as fish oil and liver. The second previtamin, vitamin D213Vol.:(0123456789)
Zelzer S. et al.(ergocalciferol), is produced in plants, mainly in fungi [8],and the richest sources of vitamin D may be found in wildmushrooms [4].Mushrooms, wild, and edible or cultivated containvarying levels of vitamin D2, depending on the exposureto incidental UV light during growth [9]. Wild and edible mushrooms, e.g., Cantharellus tubaeformis contain13.6–29.8 µg/100 g dry mass (DM), and large scale produced Agaricus bisporus in the dark 0.2 µg/100 g DM [4]. Incomparison, fortified cereals only contain vitamin D2 levelsof between 2.8 and 8.3 µg/100 g, whereas mushrooms produced under UV-light exposure are reported to contain above10 µg/100 g fresh weight (approx. 100 µg/100 g DM). Oneportion of this mushroom has higher vitamin D levels thanmost foods containing vitamin D, and the vitamin D levelsin this one mushroom portion are higher than the daily international requirements of vitamin D [10]. Therefore, mushrooms could be an important source for vegetarians as wellas for non-vegetarians.Previous studies reported that there is a large variancein the content of vitamin D2 in the same types of mushrooms similarly produced [11–13]. Salemi et al. describeda vitamin D2 concentration of 0.004 µg/g DM in Agaricusbisporus, while Urbain et al. determined 0.1 µg/g DM in thesame species [14]. In both studies high performance liquidchromatography (HPLC) was used for analyte separationfollowed by UV absorbance detection [13, 14]. Byrdwellet al. [15] reported that the extraction of vitamin D fromfood is a difficult and elaborate process which makes detecting vitamin D by UV absorption highly problematic. Thisis particularly relevant in the case of mushrooms, wherethe sample heterogeneity can be caused by different protein contents (10 and 30% DM) and high concentrations ofcarbohydrates such as structural polysaccharides like chitin,for example [16].Other reasons for the variability of vitamin D2 concentrations, in general, are the lack of standardized referencematerials as well as the lack of standardized methods [15].Most of the published methods to date used HPLC–UV systems, but mass spectrometry (MS) is an upcoming analytical technique used in the determination of vitamin D. Massselection can be made with a quadrupole mass filter [14] orwith time of flight (Q-TOF/MS) [17]. Mass spectrometryprovides extreme selectivity in the identification of complexfocused analytes, but high ion suppression occurs with coeluting components leading to dramatically reduced sensitivity. The sample preparation, which is just as extensive as thatapplied to UV absorbance detection, is necessary, and longchromatographic run times can resolve this analytical issue.Therefore, the aim of the present work was to developand validate an LC–MS/MS method for the determinationof vitamin D2 in different mushroom species using a relativesimple sample preparation procedure and a short run time.13ExperimentalChemicals and reagentsVitamin D2-d3, the deuterated internal standard (6,19,19-d3) (1 mg, chemically pure (CP) 98%), and the puresubstance vitamin D2 (1 mg; reference standard; 98%(HPLC)) were obtained from Sigma-Aldrich (Steinheim,Germany). The organic solvent methanol, hexane (bothLC–MS grade), and the analytical grade chemicals, formicacid (FA) ( 99%) and dimethyl sulfoxide (DMSO), werepurchased from Merck (Darmstadt, Germany). LC–MSgrade water was obtained from Honeywell Riedel-deHaën (Seelze, Germany).Examined mushroom speciesPleurotus ostreatus was provided from an urban organic oyster mushroom farm in Graz (Pilzkiste, Graz, Austria) usingbiological organic straw as the culture medium. For the firstthree weeks, the mushrooms grew in the dark at 25 C followed by two weeks at 15 C, 85–95% moisture, and illuminated by a LED lamp (365–405 nm) for 10 h per day. Allthe other mushroom species (Lentinula edodes, brown andwhite button mushrooms) were purchased at the “Interspar”food shop (Graz, Austria). Extractions from all four of themushroom species (Pleurotus ostreatus, Lentinula edodes,brown and white button mushrooms) were carried for standard additional analyses.Sample preparationThe mushrooms were cleaned with deionized water, subsequently frozen at 80 C, lyophilized, powdered, and storedat room temperature in the dark. Fifty mg of each samplewas weighted in Pyrex glass tubes (16 100 mm, SigmaAldrich, Steinheim, Germany). One hundred µL of the internal standard vitamin D2-d3 (1.00 µg/mL in methanol) wereadded, and the mixture was vortexed for 30 s. Then, 1.5 mLmethanol was added, and after short vortexing, the samplesunderwent ultrasonic oscillation at 45 C for 30 min usinga SONOREX Digital 10 P Ultrasonic bath (BANDELIN electronic GmbH & Co. KG, Berlin, Germany). Then,1.5 mL of methanol/water (1 1, v/v) was added, and afterfurther vortex-mixing and the addition of 6 mL of hexane,the mixture underwent ultrasonic oscillation again at 45 Cfor 30 min. After cooling, the samples were rotated for10 min and centrifuged at 3000 g for 10 min. The organiclayer was transferred to a glass tube with a peaked base andblown dry with oil-free compressed air at 50 C using aTurboVap LV Evaporator (Biotage, Uppsala, Sweden) and
Development of a two‑dimensional liquid chromatography‑tandem mass‑spectrometry method re-dissolved with 150 µL of methanol in the ultrasonic bathfor 5 min at 25 C. Re-dissolved samples were centrifugedfor 5 min at 3000 g. Clear supernatants were transferredto autosampler vials with polyethylene snap-caps (La-PhaPack GmbH, Langerwehe, Germany), and 50 µL wasinjected into the LC–MS/MS system.Table 1 Optimized instrument settings for vitamin D2 and the internal standard vitamin D2-d3 measurements on the SCIEX QTRAP6500 triple quad mass spectrometerParameterOperation conditionsIon sourceIon spray voltage (V)Temperature of ion source ( C)Curtain gas (kPa)Nebulizer gas (gas 1) (kPa)Heater gas (gas 2) (kPa)Collision gas (kPa)Scan time (sec)Declustering potential (V)Entrance potential (V)Collision energy (V)Collision cell exit potential (V)Vitamin D2 (m/z ratio)Vitamin D2-d3 (m/z ratio)Turbo Spray Ion /107.1400.2/162.1V, volts; C, degree Celsius; psi, pound-force per square inch; sec,secondTable 2 Operation conditionsof the ultra-high performanceliquid chromatographyHPLCLoading systemFirst columnPump pressure (bar)Column temperature ( C)Mobile phaseFlow rate (mL m in 1)Injection volume (µL)Eluting systemSecond columnPump pressure (bar)Column temperature ( C)Mobile phase AMobile phase BGradientFlow rate (mL m in 1)InstrumentationSeparations were carried out using an HPLC (SHIMADZUNexera, Kyoto, Japan) coupled to a SCIEX QTRAP 6500triple quadrupole mass spectrometer (Applied Biosystems,Framingham, MA, USA). The HPLC system was equippedwith a SIL-30AC autosampler, a degasser, two binary LCloading pumps (LC-30AD) and one eluting (quaternary)pump (LC-20ADXR), a thermostatic column compartment(CTO-20AC), a sub-controller (SUBCvp) with two rotaryvalves, and the system controller CBM-20A. Detection wasachieved using an electrospray ionization (ESI) source inthe multiple reaction monitoring (MRM) positive ionizationmode. The optimized instrument settings are summarizedin Table 1. Analyte concentrations were calculated usingAnalyst 1.6.2 Software (SCIEX).Chromatographic conditionsA dual-column heart cutting LC–MS/MS method was usedfor the quantification of vitamin D2. The conditions aresummarized in Table 2. Fifty µL was loaded on the firstcolumn, Kinetex 5 µm F5 100 Å, LC Column 50 4.6 mm(Phenomenex, Aschaffenburg, Germany) using 85% methanol as the mobile phase. At 3.00 min, when the vitaminD2 had eluted, the flow was switched to the second column(Zorbax Eclipse XDB C18; 3.0 100 mm; 3.5 µm, AgilentTechnologies, Santa Clara, CA, USA). After the transferof the analyte and the internal standard at 3.30 min to theOperation conditionsKinetex 5 µm F5 100 Å, LC Column 50 4.6 mm3940Methanol (85%); 0–7.50 min1.050Zorbax Eclipse XDB C18; 3.0 100 mm; 3.5 µm16540Methanol with 0.1% formic acid (v/v)0.1% formic acid (v/v) in LC-grade water0–3.60 min (50% A and B)3.61–4.80 min (50% to 100% A)4.81–7.00 min (100% A)7.01–7.10 min (100% to 50% A)7.11–7.50 min (50% A and B)0.7 C, degree Celsius13
Zelzer S. et al.second column, the valve was switched to the initial position; column one was rinsed with 85% methanol; and the cutpeak was separated on the second column with a mixture of100% methanol, 0.1% formic acid (v/v, mobile phase A),and 0.1% formic acid in MS grade water (mobile phase B).The retention time was 6.27 min for vitamin D2. Equilibration occurred with the initial conditions for 0.40 min. Thistype of column switching was necessary to minimize thehigh number of ion-suppressing and co-eluting substances.Detailed information concerning the chromatographic optimization is presented in Supplementary Table S1.Standard additionFor the quantitative analysis of vitamin D2 concentrations,the method of standard addition was used [18]. Therefore,a standard curve was generated with 0.0.0, 0.1, 0.2, and0.5 µg/g DM by adding a series of different amounts ofvitamin D2 (stock solution 1 µg/mL vitamin D2 in methanol) to the mushroom samples. The increasing vitamin D2concentrations were added step-by-step to each sample, followed by the measurement of the responses resulting fromthe amounts of analyte added to the samples.Method validationMethod validation of the bioanalytical chromatographicmethods, based on the recommendations published by theFood and Drug Administration (FDA), postulates the precision acceptance criteria of 15% [19, 20]. The intra- andinter-assay imprecisions of vitamin D2 were assessed bymeasuring five replicates of Pleurotus ostreatus and Lentinula edodes on 5 consecutive days. The limit of detection(LOD) was defined as the lowest concentration, which produced a signal at least three times higher than the averageTable 3 Analytical performanceof the optimized vitamin D2LC–MS/MS methodbackground noise. The limit of quantification (LOQ) wasdefined as the lowest concentration which allowed quantification with an imprecision of 10% [20]. Both indices weredetermined by analyzing the serial dilutions of the lowestcalibrator. Each dilution was measured five times. The recovery of vitamin D2 was determined three times in three different concentrations (0.10, 0.20, and 0.50 µg/g DM) by adding the authentic pure substance to the mushroom samplesbefore and after extraction. The recovery was calculated asa percentage of the measured concentration in relation to theexpected concentration. In order to evaluate the accuracy,the actual concentrations of vitamin D2 were determined bycomparison using an external calibration curve.An overview of different methods for the analysis ofvitamin D2, the various procedures of mushroom irradiation, and their concentrations are shown in SupplementaryTable S2. Despite the high analytical selectivity and sensitivity of mass spectrometry, the usage of these instruments forthe determination of vitamins has not been used very oftenfor mushrooms, so far.Results and discussionThe characteristics of the analytical method are presentedin Table 3. The target analyte of the method is linear overthe investigated concentration range with correlation coefficients (R2) of 0.999. The intra- and inter-day imprecisions were 4.1% and 5.8%. The LOD and LOQ werebetween 0.01 and 0.05 µg/g. The extraction efficiencies fromthe biological matrix were 91.5 4.3% for vitamin D2 and89.7 2.1% for vitamin D2 d3 (Supplementary Table S1).The vitamin D2 retention time was 6.27 min, while thewhole run time until the next injection was 7.50 min.Vitamin D2Mushroom speciesLinear range (µg/g vitamin D2)Correlation coefficient (r2)Intra-day precision (µg/g DM)(Mean SD)(CV %)Inter-day precision (µg/g DM)(Mean SD)(CV %)LoD (µg vitamin D2/g DM)LoQ (µg vitamin D2/g DM)Recovery (%)Pleurotus ostreatus0.999Lentinula edodes0.1–0.51.0000.119 0.0063.90.078 0.0034.10.122 0.0075.80.078 0.0045.191.5 4.30.010.0589.7 2.1m/z, mass to charge ratio; DM, dry mass; SD, standard deviation; CV, coefficient of variation; LoD, limit ofdetection; LoQ, limit of quantification;13
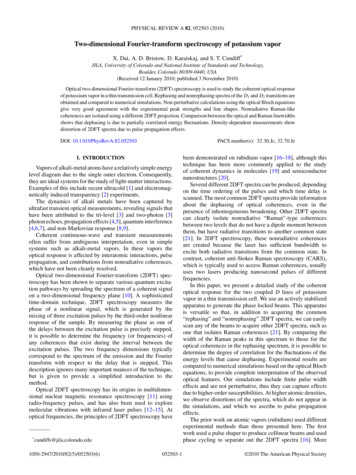
Development of a two‑dimensional liquid chromatography‑tandem mass‑spectrometry method The vitamin D2 concentrations of the mushroom sampleswere calculated using a standard addition analysis. Chromatograms from both mushroom species without vitaminD2 and spiked with 0.1 µg/g of vitamin D2 are shown inFig. 1. Furthermore, calibration curves were generated forFig. 1 LC–MS/MS chromatograms from different mushroomspecies. A Pleurotus ostreatus,native (50 mg); vitamin D2with m/z 397.2/107.1 and aretention time (RT) at 6.27 min.B Pleurotus ostreatus spikedwith 0.1 µg/g vitamin D2with a retention time (RT)at 6.27 min. C Lentinulaedodes, native (50 mg); vitaminD2 with m/z 397.2/107.1 and aretention time (RT) at 6.27 min.D Lentinula edodes spiked with0.1 µg/g vitamin D2 with a RTat 6.27 minAPleurotus ostreatus –native Vitamin D2S/N 38.7BPleurotus ostreatus –spiked with 0.1 µg/g Vitamin D2S/N 89.2CDthe four mushroom species in order to ensure accuracy (Supplementary Figure S1). A mean vitamin D2 concentration of0.122 0.007 µg/g DM was determined in Pleurotus ostreatus. Lentinula edodes samples contained a mean vitamin D2concentration of 0.078 0.004 µg/g DM (Table 3). BrownLentinula edodes –native Vitamin D2S/N 34.1Lentinula edodes –spiked with 0.1 µg/g Vitamin D2S/N 73.813
Zelzer S. et al.and white button mushrooms had mean vitamin D2 concentrations of 0.099 0.007 µg/g DM and 0.073 0.005 µg/gDM.Similar low vitamin D2 concentrations were published byMattila et al. [21]. They reported vitamin D2 concentrationsranging from 0.026 to 3.72 µg/g DM in differently cultivatedmushroom species [21]. This study does not describe theUV irradiation of the samples. Jasinghe and Perera measured vitamin D2 concentrations of 6.05 0.07 µg/g DM inLentinula edodes and 4.4 0.08 µg/g DM [22] in Pleurotus ostreatus purchased from a supermarket in Singapore.After 2 h of UV irradiation, the concentrations increased to22.8 1.07 and 45.1 3.07 µg/g DM.Another study by Gyôrfi et al. described a vitamin D2content of 0.67 µg/g DM in cultivated pre-harvest UVirradiated Pleurotus ostreatus samples [11]. Huang et al.found up to 12.7 1.54 µg/g DM in Pleurotus ostreatus and17.16 0.47 µg/g DM in Lentinula edodes samples beforeUV irradiation. After a 60-min light treatment, the concentrations reached 229 µg/g DM. [23]. The Pleurotus ostreatussamples examined were indeed irradiated with LED light(365–405 nm). However, the wavelength did not provide anoptimal range for vitamin D2 formation. Román-Hidalgoet al. reported that UV-B radiation (280–315 nm) is the mosteffective wavelength in stimulating the production of vitaminD2 in mushrooms [17]. This could be one explanation forthe low level of vitamin D in our Pleurotus ostreatus samples, where higher values were expected. As for the othersamples (Lentinula edodes, brown and white button mushrooms), there were no information about the UV irradiationnor about the sunlight exposure and the growing conditions.Therefore, the present results cannot be compared with thepublished values of 0.005 µg/g DM [24] or even 0.004 µg/gDM in untreated mushrooms [13]. The studies mentionedabove applied HPLCUV methods to measure vitamin D concentrations [11, 13, 21, 22]. Moreover, high vitamin D levelshave also been published using mass spectrometry methods.Sławinska et al. reported vitamin D2 amounts in untreatedPleurotus ostreatus species of 56.6 0.82, of 29.3 2.24 inLentinula edodes and of 13.1 1.6 µg/g DM in white button mushrooms using an UHPLC system coupled to a triplequadrupole with electrospray ionization [25].What could the potential reasons for these discrepancies be? At the beginning of the twenty-first century, it hadalready been postulated that vitamin D2 is totally absent incultivated mushrooms ( 0.1 µg/ g DM) due to the lack ofsunlight exposure and the harvest in the dark [26, 27]. Incontrast to the cultivated species without UV irradiation,wild mushrooms contain higher vitamin D2 concentrations[4, 28]. However, cultivated mushrooms with UV irradiation have markedly higher vitamin D2 content than in mushrooms, which grow in the wood. Various studies (listed inSupplementary Table S2) investigated UV-irritation using13different wavelengths and exposure times and numerousmushroom species with differently prepared pieces, whichdemonstrated highly variable amounts of vitamin D2 levels[12, 23, 25, 29].There are a few analytical reasons why such differentvitamin D2 results have been obtained. Numerous organicsolvents are used for several clean-up steps (e.g., saponification, the extraction, and purification of the extract) to avoidthe matrix effects of the mushroom ingredients [21, 23, 24].Up to now, the determination of vitamin D2 has been mainlyperformed using the reversed-phase HPLC with UV absorbance detection ranging from 250 to 280 nm [30, 31]. Massspectrometry methods certainly fit better for this approachand were used by few authors [17, 25, 32, 33]. This analytical technique has the advantage of simultaneously quantifying multiple compounds with high sensitivity and selectivity[34]. However, ion suppression and the occurrence of interferences also require elaborate sample preparation steps andlong separation run times.Therefore, the present study aimed at developing aLC–MS/MS method with a relative simple extraction procedure, selective chromatographic separation, and a shortrun time.First, a one-column method was tested with a selectivesample procedure including saponification and differentextraction steps to generate a clean, interference-free extract.Although a complex sample preparation method was used,the ion suppression of the coeluted substances was so highthat only a 10% response of added pure substance in themushroom extract was found compared to the same amountof analyte injected in the mobile phase. In this form, themethod was unsuitable for vitamin D2 measurement inmushroom samples. Based on these findings, the strategywas changed to a simplified sample procedure. The mushroom samples were sonicated with methanol/water (1 1,v/v), extracted with hexane, and were successfully analyzedusing the two-dimensional method. The attempt to increasethe vitamin D concentration by multiple extractions provided only slight increases in yield. The increase in yieldwas always associated with a higher proportion of interferingfactors. The recovery of the target analyte is at a reasonable level ( 90%). It does not seem necessary to increase itbecause a labeled internal standard has been inserted into thematrix. This internal standard distributes in the matrix likethe endogenous analyte and can compensate the extractionlosses very well.It is a common practice to re-dissolve the sample in themobile phase to achieve optimum peak shape and to avoidthe deposition of substances when the methanol contentof the mobile is reduced. To bring the whole amount ofanalyte in solution of the dried samples, 100% methanolwas used. Injection of samples containing higher methanol concentration than the mobile phase often results in
Development of a two‑dimensional liquid chromatography‑tandem mass‑spectrometry method problems. Switching to the second column with post-focuschromatographic separation gave a good peak shape, sowe did not further optimize the injection solvent and firstmobile phase. The rinsing of the first column was donewith 100% methanol so that possible substance depositionson the first column are removed again.To the best of our knowledge, this is the first methodfor vitamin D measurement in mushrooms using two different columns in a heart cutting setting in combinationwith a triple quadrupole system to analyze vitamin D content with a low impairment in ionization. Our LC–MS/MSmethod has an interference free stable LOQ of 0.05 µg/gDM. This LOQ is adjusted to the concentration presentin the mushrooms and can still be lowered considerablyby increasing the amount of tissue used, by lowering thedissolution volume, or by increasing the injection volume.Our study harbors some limitations that should be mentioned. In this developed two-dimensional LC–MS/MSmethod, vitamin D2 from Sigma-Aldrich was used, which isa certified reference material (CRM). However, no standardreference controls were available for vitamin D2 analysis inmushrooms. Such certified materials are necessary to generate accuracy concentrations. Additionally, the developmentof standardized reference methods would be very important.Furthermore, it must be mentioned that only cultivated mushrooms were determined in this work; only information on thegrowing conditions of one species was available.In conclusion, the well-optimized, sensitive LC–MS/MS method with a simple sample preparation and a shortrun time presented here demonstrates that vitamin D2detection in different mushroom species is possible evenwithout UV-treatment. In order to get accurate informationabout mushrooms as a rich source of vitamin D2, furtherstudies especially with UV irradiation are necessary. Theymay improve our current knowledge about vitamin D2 levels in mushrooms. The method presented here is a reliabletool for vitamin D2 quantification in mushrooms.Supplementary Information The online version contains supplementary material available at https://d oi.o rg/1 0.1 007/s 00216-0 22-0 4281-3.Acknowledgements This study is part of the PhD of the first authorS. Zelzer.Author contribution Conceptualization: W. Goessler. Methodology: S.Zelzer, A. Meinitzer, W. Goessler. Validation, S. Zelzer. Analysis: S.Zelzer, A. Meinitzer, D. Enko. Resources: M. Herrmann, W. Goessler.Writing—original draft: S. Zelzer, A. Meinitzer, D. Enko, W. Goessler.Writing—review and editing: S. Zelzer, A. Meinitzer, D. Enko, M. Herrmann, W. Goessler. Supervision: A Meinitzer, W. Goessler. Projectadministration: M. Herrmann, W. Goessler. All authors have read andagreed to the published version of the manuscript.Funding Open access funding provided by University of Graz. Theauthors acknowledge the financial support by the University of Graz.DeclarationsCompeting interest The authors declare no competing interests.Open Access This article is licensed under a Creative Commons Attribution 4.0 International License, which permits use, sharing, adaptation, distribution and reproduction in any medium or format, as longas you give appropriate credit to the original author(s) and the source,provide a link to the Creative Commons licence, and indicate if changeswere made. The images or other third party material in this article areincluded in the article's Creative Commons licence, unless indicatedotherwise in a credit line to the material. If material is not included inthe article's Creative Commons licence and your intended use is notpermitted by statutory regulation or exceeds the permitted use, you willneed to obtain permission directly from the copyright holder. To view acopy of this licence, visit http:// creat iveco mmons. org/ licen ses/ by/4. 0/.References1. Holick MF. The vitamin D deficiency pandemic: approaches fordiagnosis, treatment and prevention. Rev Endocr Metab Disord.2017;18:153–65.2. Bikle DD. Vitamin D metabolism, mechanism of action, and clinical applications. Chem Biol. 2014;21:319–29.3. Holick MF. Vitamin D deficiency. N Engl J Med. 2007;357:266–81.4. O’Mahony L, Stepien M, Gibney MJ, Nugent AP, Brennan L. Thepotential role of vitamin D enhanced foods in improving vitaminD status. Nutrients. 2011;3:1023–41.5. Amrein K, Scherkl M, Hoffmann M, Neuwersch-Sommeregger S,Köstenberger M, Tmava Berisha A, Martucci G, Pilz S, Malle O.Vitamin D deficiency 2.0: an update on the current status worldwide. Eur J Clin Nutr. 2020;74(11):1498–513.6. WHO/FAO. Vitamin and mineral requirements in human nutrition, 2nd ed.; WHO Library: Geneva, The Netherlands, 2004.(accessed on 31. September January 2022) Available online:https:// www. who. int/ publi catio ns/i/ item/ 92415 46123.7. Prosser DE, Jones G. Enzymes involved in the activation and inactivation of vitamin D. Trends Biochem Sci. 2004;29(12):664–73.8. Proserpio C, Lavelli V, Gallotti F, Laureati M, Pagliarini E.Effect of Vitamin D2 Fortification Using Pleurotus ostreatus ina Whole-Grain Cereal Product on Child Acceptability. Nutrients.2019;11(10):2441.9. Roberts JS, Teichert A, Mchugh TH. Vitamin D2 Formationfrom post-harvest UV-B treatment of mushrooms (Agaricusbisporus) and retention during storage. J Agric Food Chem.2008;56:4541–4.10. Cardwell G, Bornman JF, James AP, Black LJ. A review ofmushrooms as a potential source of dietary vitamin D. Nutrients.2018;10(10):1498.11. Gyôrfi GJ, Kovács A, Szabó A. Increasing the vitamin Dlevel of oyster mushrooms by UV light. Int J Horticult Sci.2011;17(4–5):119–23.12. Huang SJ, Lin CP, Tsai SY. Vitamin D2 content and antioxidantproperties of fruit body and mycelia of edible mushrooms byUV-B irradiation. J Food Compos Anal. 2015;42:38–45.13. Salemi S, Saedisomeolia A, Azimi F, Zolfigol S, Mohajerani E,Mohammadi M, Yaseri M. Optimizing the production of vitaminD in white button mushrooms (Agaricus bisporus) using ultraviolet radiation and measurement of its stability. Lebensm WissTechnol. 2021;137:110401.14. Urbain P, Valverde J, Jakobsen J. Impact on Vitamin D2, VitaminD4 and agaritine in Agaricus bisporus mushrooms after artificial13
Zelzer S. et al.15.16.17.18.19.20.21.22.23.24.25.and natural solar UV light exposure. Plant Foods Hum Nutr.2016;71(3):314–21.Byrdwell WC, Devries J, Exler J, Harnly JM, Holden JM, HolickMF, Hollis BW, Horst RL, Lada M, Lemar LE, Patterson KY,Philips KM, Tarrago-Trani MT, Wolf WR. Analyzing vitamin Din foods and supplements: methodologic challenges. Am J ClinNutr. 2008;88(2):554S-557S.Wang X, Zhang J, Wu L, Zhao Y, Li T, Li J, Wang Y, Liu H.A mini-review of chemical
to autosampler vials with polyethylene snap-caps (La-Pha-Pack GmbH, Langerwehe, Germany), and 50 µL was injected into the LC-MS/MS system. Instrumentation Nexera, Kyoto, Japan) coupled to a SCIEX QTRAP 6500 triple quadrupole mass spectrometer (Applied Biosystems, Framingham, MA, USA). The HPLC system was equipped