Transcription
DOCUMENT RESUMEED 368 935AUTHORTITLEPUB DATENOTECE 066 246Kashef, Ali E.A Comparison of the Effectiveness between ComputerAided Drafting and the Traditional DraftingTechniques as Methods of Teaching Pictorial andMultiview Drawings.[Dec 93]23p.; Paper presented at the American VocationalAssociation Convention (Nashville, TN, December1993).PUB TYPESpeeches/Conference Papers (150)Research/Technical (143)EDRS PRICEDESCRIPTORSMF01/PC01 Plus Postage.*Computer Assisted Design; *Computer Graphics;*Drafting; Higher Education; InstructionalEffectiveness; *Outcomes of Education; TeachingMethods*AutoCADIDENTIFIERSReportsABSTRACTA study was conducted to determine the effectivenessof teaching multiview and pictorial drawing using traditional methodsand using computer-aided drafting (CAD). Research used aquasi-experimental design; subjects were 37 full- and part-timeundergraduate students in industrial technology or technologyeducation courses. The students were enrolled in two sections of thesame drafting course, and both groups were pretested. The controlgroup members were taught the traditional method of drafting, and theexperimental group used AutoCAD. Performance tests administered afterstudents had completed 7 weeks of the courses showed no significantdifference in either group's ability to do multiview and pictorialdrawings. The study recommended that, since CAD is as effective astraditional teaching methods and is the way of the future, thismethod be used in teaching drafting. (Contains 24 s supplied by EDRS are the best that can be madefrom the original ******************************
A Comparison of the Effectiveness BetweenComputer Aided Drafting and the Traditional Drafting Techniquesas Methods of Teaching Pictorial and Multiview Drawings.11)00re)AuE. KashefCompetition in the world's markets has driven most educatorsand executives in educational instii-utions and manufacturingfirms to search for greater efficiency and productivity.Therefore, the communication of engineering data is becomingincreasingly crucial in the global educational and manufacturingenvironment. In the last twenty years, technological advanceshave prompted a gradual transition from a reliance on traditionaldrafting tools to the use of computer aided design (CAD). Today,personnel in almost every institution and industry in the westernworld are using more CAD in their work than in the past.As CAD technology has become an essential part of the designprocess in industry and education, a debate has also arisen amongthe concerned trainer as to how students can learn and visualizedifferently with CAD than with traditional metnods.Can studentslearn and visualize the principles and concepts of multiview andpictorial drawing skills by using a CAD system equally as well asby using traditional drafting equipment?This question should beaddressed in a serious and organized manner.This paper is a summary of research that was designed toaddress the question of whether or not there is a statisticallysignificant difference between groups of students who were taughtby using CAD tools and those who were taught by using traditionaldrafting tools. This type of study should help trainers determinethe curriculum content and the most efficient method of teachingU.S. DEPARTMENT OF EDUCATIONOnine cd Educational Research and Improvementpictorial and multiview drawings.EDUCATIONAL RESOURCES IN'ORMATIONCENTER (MOThis document has been rep AuCed asreceived Iron, the person or organizationerepnating it;hare been made le improvereproduction QualityBEST COPY AVAILABLE2"PERMISSION TO REPRODUCE THISMATERIAL HAS BEEN GRANTED BYPoints of view or opinions slated in thisdocumere dO not necessarily represent officialOE RI position or policyZ.TO THE EDUCATIONAL RESOURCESINFORMATION CENTER (ERIC)"
2The Problem StatementDo students, instructed in beginning technical draftingusing CAD methods, learn and visualize multiview drawings frompictorial drawings (and vice versa) as well as those who wereinstructed using traditional drafting methods?Review of the Research and the Related LiteratureDrawing is one of the oldest forms of communication, datingback further than verbal communication. It is a language used tocommunicate ideas into lines and symbols, and it has been auseful tool for understanding that which cannot be understood bythe use of verbal communication. (Goetsch, Nelson & Chalk, 1989).Showing the shape of a part is a primary purpose of graphiccommunication.The trainer, drafter, engineer, and designer mustselect the best method available to visualize and draw a part.The two basic techniques used are two-dimensional (multiview)drawing and three-dimensional (pictorial) drawing. The twodimensional technique is known as multiview drawing.Perspectiveprojection, oblique projection, and axonometric are threedimensional techniques of "pictorial representation" (French,Viercik & Foster, 1986).French, Svensen, Helsel and Urbanick (1985) indicated thatvisualization is the ability to see clearly what a machine,device, or other object looks like in the mind's eye.Implementation is the drawing of the object that has beenvisualized.These requirements, experts agree, may be learnedduring the study of multiview and pictorial drawings.3
3To create a three-dimensional (3D) drawing requires spatialvisualization skill. Visualization in this context is the processof creating a 3D image of an object in a person's mind by usingthe evidence and clues provided by multiview drawings (twoThus, the goal of reading adimensional) or other presentations.multiview drawing is to visualize information about the relativepositions of an object's surfaces and geometric features(Goetsch, Nelson & Chalk, 1989). It is the most effective way todescribe the size and shape of a three-dimensional (pictorialdrawing) object in a flat, two-dimensional drawing space byeither freehand or with the aid of instruments. Each of theseTraining inmethods have specific merits and applications.freehand work emphasizes form, speed, hand control, andappreciation of proportion.It is valuable because it allowsdrafters to use sketches to communicate deaign ideas, explainproblem solutions, or suggest changes in design, construction, orproduction methods.Traditional working instruments may be usedto formalize a high-quality, realistidally detailed, andaccurately proportioned record of the design.But, these toolsare being replaced by CAD systems.Duelm (1989) reported for all the differences betweentraditional drafting and CAD, the process of drafting stillrequires the technical knowledge of the drafter.A CAD system isonly a tool of the draftsman, and it cannot create a drawingwithout human skills.CAD does not change what draftsmen do, butrather how they do it.4
4Mandell & Mandell (1989) reported that computers are a moreefficient and effective tool to represent design graphically thanthe traditional tools. Hawkins (1989) stated that CAD is one ofthe more popular forms of computer simulation. It improvestutorials and drills through enhanced motivation, transfer oflearning, and efficiency.CAD simulation has the advantages ofconvenience, safety, and controllability over real experience, isa good forerunner to real experiences, and is useful for givingstudents experiences that would not otherwise be possible.Friedhoff & Benzon (1989) noted the claim, "computerinteraction allows visualization to take off from our familiarworld of objects, even to further dimensions of space.So acomputer generated four-dimensional hypercube, although at firsta meaningless jumble of lines, becomes a richly meaningful objectas it is explored by moving it around under the control of .theviewer.A fascinating question is how powerful computer graphicswill ultimately enhance visual awareness and conceptual power tounderstand and invent" (p. 8).Fitzgerald, Lindblom, Zetterbers,and Dalton (1971) defined a hypercube as a four-dimensionalFive-dimensional, or even n-object with a point-sdt in 4-space.dimensional objects may be described mathematically, but drawingsof them are quite complicated. These communication skills requirean understanding of language fundamentals and an ability tovisualize in three-dimensional form.While visualizing in threedimensions can generally be learned through the study ofmultiview and pictorial drawings, students often have difficulty5
5mastering this important communication skill.Because of itsimportance in technological society, educators continue to seekteaching methods and instructional strqtegies to enhance theteaching and learning of visualization.Shumaker and Madsen (1989) indicated that three-dimensionalvisualization and drawing are skills that every drafter,designer, and engineer should possess.This is especiallyimportant now that with most CAD systems, it is possible torotate a 3D model on the display screen to provide views fromdifferent angles.While the computer actually calculates thepoints, lines, and surfaces of the object in space, the persongiving the computer information must have good 3D visualizationskills.Dimarco (1989) advised, "Stress the fundamentals, but startnow to help your students think about new technology" (p. 30).Dimarco believes that CAD is here to stay and curriculums must beupdated.Resetarits (1989) believes that students can learn theprinciples and concepts of drafting by using a CAD system equallyas well as by using traditional drafting tools.Hardy (1989)indicated that CAD and traditional drafting will each serve aneed and must coexist.Gorman (1990) believed that traditionaldrafting has effectively served drafting programs in the past andwill continue to serve students in the future.This is thetraditional position of some educators in that drafting is not atask or operation, but a way of thinking that thrives on changeand is a central part of change.Students who understand this
6tradition can adapt to the changes that technology will requirethroughout their careers.With change a certainty for thefuture, it is important to teach attitudes and flexibility(whether they use a T-square and tri-angle, a keyboard, or evenvoice-operated equipment) rather than particular technicalcontent.Perkins and Rivers (1991) stated that CAD has been usedin diverse industries, therefore, its use is coming to be seen asa basic skill. They also reported that teachers are finding allkinds of new ways to put CAD to work in helping studentsconceptualize, organize, manipulate, and learn.Giesecke, Mitchell, Spencer, Hill, Loving and Dygdon (1990)described the current connection between engineering and scienceand that the universal graphic language is more vital than everbefore.The old days of fine-line drawing and of shading andwashes are gone forever; artistic talent is no longer aprerequisite to learning the fundamentals of the graphiclanguage.Instead, today's students must understand thefundamental principles, or the grammar of the language, and beable to execute the work with reasonable skills of penmanship.Lewis (1990) reported that engineering drawings make heavydemands on intellectual skills, recluiring a good mathematicalfoundation, and an ability to understand and visualize the objectdepicted. Not all students can do this. The combination of skillsneeded and the prospect of spending hour after hour sitting at atable drawing and erasing lines was not attracting students. CADis an attractive skill for the twenty first century.7
7Hull & Jacobs (1992) have designated a ten step list ofdesign processes for industry that can be used to reach the bestsolution to a design problem. In short, all steps directlyinvolve using computer graphics application software.Lowrey (1992) has reported that design, analysis,manufacturing, testing, marketing, and others involved in theproduct development process can work more closely together toimprove the development time, cost, and quality benefits to theproduct. This can be achieved only by integration of computergraphic applications software such as CAD, CAM, CAE, and CIM.In the last five years, most studies (Ross, 1989; Bertoline,1991; Miller, 1992) have stated that computer-generated modelsinengineering graphics have aided in advancing students' spatialabilities. As both computer power and capabilities of softwaretools increase, interactive computer graphics have also becomethe most effective tools in visualization for engineers(Hamilton, 1990)Those involved in the integration of CAD into the designcurriculums such as engineering, technology, and relateddisciplines question the value of using CAD for draftinginstruction.One question which needs answering is: can CADsystems be used to teach pictorial and multiview orthographicdrawings as effective as traditional tools? To answer the aboveproblem, six research questions were proposed for this researcheffort.8
8Research OugstionsThe purpose of This study was to contribute to anunderstanding of the relative effectiveness of two differentmethods of teaching multiview and pictorial drawing. Aftercontrolling for initial differences on the pre-test, thefollowing questions were in this study.1. Is there a difference in scores acquired on visualizationtests that were developed to identify pictorial equivalents ofgiven multiview drawings between students who were instructed inbeginning technical drafting using CAD and those instructed usingtraditional drafting methods?2. Is there a difference in scores acquired on visualizationtests that were developed to identify multiview equivalents ofgiven pictorial drawings between students who were instructed inbeginning technical drafting using CAD and those instructed usingtraditional drafting methods?3. Is there a difference in the amount of time required toidentify pictorial equivalents of given multiview drawings onvisualization tests between students who were instructed inbeginning technical drafting using CAD and those instructed usingtraditional drafting methods?4. Is there a difference in the amount of time required toidentify multiview equivalents of given pictorial drawings onvisualization tests between students who were instructed inbeginning technical drafting using CAD and those instructed usingtraditional drafting methods?
5. What is the relationship between test scores andTIcompletion time on the pictorial to multiview visualization testsfor students who were instructed using CAD and those who wereinstructed using traditional drafting methods?6. What is the relationship between test scores andcompletion time on the multiview to pictorial visualization testsfor students who were instructed using CAD and those who wereinstructed using traditional drafting methods?MethodsA quasi-experimental design of the nonequivalent controlgroup was utilized for the study (Tuckman, 1988). The proceduresfor quasi-experimental design are the same as for a trueexperimental design except that intact groups rather thanrandomly assigned ones are used. This created a control problemin terms of selection bias, but this problem was solved byadministrating a pre-test to all subjects in each group todetermine whether the two intact groups were equal as to thedependent variable at the beginning of the instructional program.The cluster method of sampling was used to draw two sectionsfrom the three sections of technical graphics offered during thefall semester. Two intact (the subjects were not assignedrandomly to treatments) groups of subjects were selected. Onesection was assigned randomly to a CAD (experimental) group andthe other one assigned randomly to a tradil-ional (control) group.The subjects for this study were 37 full-and part-timeundergraduate male and female students who volunteered to10
10participate in this study in industrial technology, or technologyeducation at Montclair State college (NJ). Students in theseclasses were chosen because technical graphics is a typicaltechnical course at the college and university levels, and thestudy of multiview and pictorial drawings is the most importantpart of the course. Technical graphics at Montclair State collegewas a three hour course with no prerequisites. Enrollment in eachof the two sections was restricted to 20 students, although onesection of the two (CAD) drew only 17 during the period of thisresearch. According to Gay (1987) a minimum of 15 subjects pergroup for experimental studies is sufficient and valid.In aneffort to improve the external validity of the study, the sameinstructor with six years of teaching and three years of theindustrial experience was assigned to both classes. Both groupsof CAD and traditional students spent a considerable amount oftime (six weeks) to learn the tools without exposing them to theconcept of pictorial and multiview drawings.A single testing instrument was developed for both the CADand the traditional groups and validated by a panel of expertswhich consisted of six members: three educators, each of whom hada minimum of eight semesters of experience teaching pictorialdrawing and multiview drawing; and three industry representativeswith work experience in both CAD and traditional drafting. Eachsection was tested at the beginning of the study (seventh week)to determine whether the two intact groups were equal as to thedependent variable at the beginning of the instructional program11
11and post-tested at the end of the study (twelfth week).Theinstrument consisted of two parts. The first part was designed tomeasure 2D (multiview drawings) to 3D (pictorial drawings)perception and the second part was designed to measure 3D to 2Dperception as they related to the research questions. Eachsection was limited to twenty-five questions to minimize anyfatigue factor that might influence test results. The content ofthe post-test was the same as that of the pre-test except thatthe questions were reordered to determine the reliability of thetesting instrument. The Pearson correlation coefficientstechnique (Pearson's r) was used to determine the relationshipand reliability of the instrument. Since no manipulation of thedrawings was required, both groups were tested on paper, i.e.there were no computers used in the testing situation.The CAD system usld for the experimental group was AUTOCADversion 10 software, which provided both two-dimension and threedimension drafting.The computer hardware included the IBMcompatible XT 8088-level 8-bit machines equipped with 8087 MathCo-Processor chips, 640K of random access memory, EGA standardmonitors containing 16 colors and 640 x 350 resolution, anddigitizing tablets.In support of the drafting concepts andprinciples, both groups used the same drafting textbooks.This research was designed to investigate differences whichexisted between the two groups for each test using the twocomponents of the dependent variable performance (i.e. score andtime).While there was no time limitation on the test, the time12
12measure indicated the amount of time (in minutes) required by thestudents in each group to complete the test.A higher mean scorefor either group indicated that the students were slower (i.e:took a longer time to complete the test).Scores on the testcomponent of the tests were computed by tabulating correctanswers. The descriptive statistics and inferential statisticaltests were performed.Means and standard deviations for thescores and time were presented and discussed. Results of several"t" tests conducted on the data were also documented.The datacollected were analyzed using the "t" test statistical technique,in order to examine whether the differences between group meanswere significantly large enough to assume that the two groupmeans were different. Data were analyzed using the "t" test,Pearson correlation coefficient and transformation of r toFisher'. Z.The "t" test was used to compare group mean scoreson the test and to compare the amount of time needed to completevarious parts of the test.Pearson r and Fisher's Z was used tocompare the difference between two independent correlations. Thelevel of significance was established at .05. A preliminary teston the pre-test was used to check group equivalency.FindingsThe statistical analyses applied to the data was performed.The findings of data can be categorized in three major parts:A) Group equivalency--A pre-test, designed by the instructorand validated by a panel of experts, was given to determine theequivalency (homogeneity) of two groups. This was important in13
13establishing the internal validity of the study because randomassignment of subjects was not possible. A "t" test was performedbetween the mean of the two groups for score and time on the pretest.The values of the "t" tests for determining the differencebetween the two groups on pre-tests for scores were -1.82, -0.93,-1.19, and -1.31. These values show that there were nosignificant differences between group means at the .05probability level, indicating that the two groups were equal atthe beginning of the instructional program. To reject the nullhypotheses an actual "t" value of 2.031 for 35 degrees of freedomat the .05 probability level would have been required.The values of "t" tests for the difference between the twoaroups on pre-tests for time scores were 0.38, -1.62, -1.21, and-1.61. These values also showed that they were not statisticallysignificant at the .05 probability level, therefore, theregistration process employed apparently formed similar groupsfor the experiment.B) The Test Reliability-- The test was composed of two-parts. It was designed to measure 2D to 3D perception as well as3D to 2D perception as they related to the research questions.The instrument was an objective, paper-and-pencil test with eachpart containing 25 questions.The Pearson correlationcoefficient technique was used to determine the relationship andreliability of the two parts.Each part of this test wasadministered a total of four times.The reliability coefficientsfor part 1 were 0.94319, 0.88881, 0.76129, and 0.87827, and for14
14part 2 they were 0.82990, 0.84484, 0.89783, and 0.85510.Therefore, according to Balian (1982) the reliability of part 1and part 2 were determined to be within the "very good" range( 0.85 to 0.89).C)Six hypotheses were tested at the .05 level ofsignificance and none of them was rejected.There was nosignificant difference in score or in the amount of time requiredto identify pictorial equivalents of given multiview drawings ona test between students who were instructed in beginningtechnical drafting using CAD and those instructed usingtraditional drafting methods.Research ResultsSix hypotheses were tested at the .05 level of significance.The hypotheses and the summary of the results are presented.1.HO: There was no significant difference in scoresacquired on visualization tests that were developed toidentify pictorial equivalents of given orthographicdrawings between students who were instructed inbeginning technical drafting using CAD and thoseinstructed using traditional drafting methods.2.HO: There was no significant difference in scoresacquired on visualization tests that were developed toidentify orthographic equivalents of given pictorialdrawings between students who were instructed inbeginning technical drafting using CAD and thoseinstructed using traditional drafting methods.15
15The procedure to test the first two hypotheses involved the useof the "t" test to compare the mean on post-tests of each groupin the study. The "t" values for the first hypothesis were 0.06and -0.70, which were not statistically significant at the .05probability level. The "t" values for the second hypotheses were-1.38 and -1.40, which also were not statistically significant atthe .05 probability level.To reject the null hypotheses, an actual "t" value of 2.031for 35 degrees of freedom would have been required. In result,there were no significant differences in scores between the twogroups on the post-tests. Therefore, the two different teachingmethods, CAD and traditional, are assumed to be equally effectivefor teaching pictorial and multiview drawings.3.HO:There was no significant difference In the amount oftime required to identify pictorial equivalents ofgiven multiview drawings on visualization tests betweenstudents who were instructed in beginning technicaldrafting using CAD and those instructed usingtraditional drafting methods.4.HO:There was no significant difference in the amount oftime required to identify multiview equivalents ofgiven pictorial drawings on visualization tests betweenstudents who were instructed in beginning technicaldrafting using CAD and those instructed usingtraditional drafting methods.The procedure to test hypotheses three and four involved the use16
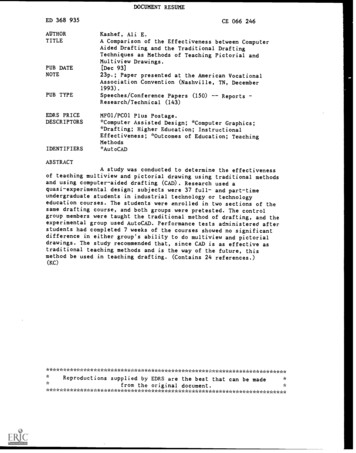
16of the "t" test to compare the mean on post-test TIME scores(time in minutes) of each group in the study. The "t" values of1.56 and -0.04 for the third hypothesis were not statisticallysignificant at the .05 probability level. The "t" values of 0.78and 0.53 for the fourth hypothesis were not statisticallysignificant at the .05 probability level.To reject the null hypotheses, an actual "t" value of 2.031for 35 degrees of freedom was required. In result, there were nosignificant differences in TIME scores between the two groups onthe post-tests. Therefore, the two different teaching methods,CAD and traditional, were assumed to be equally effective forteaching pictorial and multiview drawing.5.HO: There was no significant difference in therelationship between completion time and test scores onthe pictorial to multiview visualization tests forstudents who were instructed using CAD and those whowere instructed using traditional drafting methods.6.HO: There was no significant difference in therelationship between completion time and test scores onthe multiview to pictorial visualization tests forstudents who were instructed using CAD and those whowere instructed using traditional drafting methods.Correlation between time required to complete the tests andscores obtained on the tests are reported in Tables I and II.PRE1, PRE2, PRE3, and PRE4 are pre-tests for scores; TPRE1,TPRE2, TPRE3, and TPRE4 are pre-tests for times; POST1, POST2,17
17POST3, and POST4 are post-tests for scores; and, TPOST1, TPOST2,TPOST3, TPOST4 are post-tests for times.Numbers in parenthesesindicate the p values, and the others indicate the correlationcoefficients.TABLE ICORRELATION BETWEEN TIME :77QUIRED TO COMPLETE THE TEST ANDSCORE OBTAINED ON THE TESTGROUP A (TRADITIONAL)TPRE1 TPRE2PRE1 0.3795TPOST1TPRE4TPRE3TPOST2 TPOST3 )-0.3215POST3(0.167)0.2888POST4(0.217)GROUP B (CAD)TPRE1 TPRE2PRE1 0.3729TPRE3TPRE4TPOST1TPOST2 TPOST3 )0.1860POST3(0.475)0.2024POST4(0.436)18
18As shown in Table I, none of the correlation values betweentime required to complete the tests and scores obtained on thetests were significant at the .05 level.To reject the nullhypotheses the P value needed to be less than 0.05.TABLE IIRESULTS OF THE DIFFERENCE BETWEEN TWOINDEPENDENT CAD0.202319
19The results of the differences between two independentcorrelations (CAD, Traditional) which was not statisticallysignificant at the .05 probability level is shown in table II. AP value greater than 0.05 indicates that was no significantdifference in the scores.Therefore, there was no significantdifference in the relationship between completion times and testscores on the pictorial to multiview visualization tests forstudents who were instructed using CAD and those who wereinstructed using traditional drafting methods.ConclusionsBased upon the findings of this study, and withconsideration of the assumptions, limitations and delimitations,and the researcher's experience, it was concluded that multiviewand pictorial concepts can be taught with CAD as well as withtraditional tools.RecommendationsSeveral recommendations can be made as a result of thisresearch. They are based upon the development, execution,evaluation, and findings of this study plus the presenter'sexperl:ise.The study should be replicated with larger samples, a longerperiod of learning, random assignment of subjects, and with theutilization of other powerful software packages designed for 3Dsuch as catia, pro-engineering, etc. or with a future version ofAutoCAD and a more advanced hardware.Based on the presenter'sexpertise, there is no doubt it is extremely important to focus20
20on the future of CAD to bring a new dimension for learning andempower students by computer software applications.Studentsshould use the best tool to optimum a design within a given setof parameters. Learning multiview & pictorial drawing methods onCAD systems is important to technology and engineering majors.Today's CAD systems can support 3D modeling of complex objectsand assemblies, however, CAD 3D software packages are difficultto use for beginners. This may require a longer period oflearning for students.It is time for drafting trainers and educators to starthelping students work, think, visualize, and draw objects in 3Dwith CAD systems.Drawing on CAD is an effective way tocommunicate and express ideas.Actually, CAD is the firststepping stone into several new technologies such as solidmodeling, rendering, finite element analysis, simulation,animation, and last but not least, rapid prototy
The two basic techniques used are two-dimensional (multiview) drawing and three-dimensional (pictorial) drawing. The two-dimensional technique is known as multiview drawing. Perspective projection, oblique projection, and axonometric are three-dimensional techniques of "pictor