Transcription
Course chapter 9:Data Warehousing –Dimensional modelingF. Radulescu - Data warehousing - Dimensional modeling1
Dimensional Modeling Data modeling for Data WarehousesBased on Fact tables Dimension tablesF. Radulescu - Data warehousing - Dimensional modeling2
Fact Tables Represent a business processContain the measurements or metrics or facts ofbusiness processes "monthly sales number" in the Sales business process most are additive (sales this month), some are semiadditive (balance as of), some are not additive (unitprice)the level of detail is called the “grain” of the tablecontain foreign keys for the dimension tablesF. Radulescu - Data warehousing - Dimensional modeling3
Dimension Tables Represent the who, what, where, when and how of ameasurement/artifactRepresent real-world entities not business processesGive the context of a measurement (subject)For example for the Sales fact table, the characteristicsof the 'monthly sales number' measurement can be aLocation (Where), Time (When), Product Sold (What).The Dimension Attributes are the various columns in adimension table.F. Radulescu - Data warehousing - Dimensional modeling4
Dimension Tables In the Location dimension, the attributes can be LocationCode, State, Country, Zip code.Generally the Dimension Attributes are used in reportlabels, and query constraints such as whereCountry 'USA'. The dimension attributes also containone or more hierarchical relationships.Before designing your data warehouse, you need todecide what this data warehouse contains. Say if youwant to build a data warehouse containing monthly salesnumbers across multiple store locations, across time andacross products then your dimensions are: Location,Time and ProductF. Radulescu - Data warehousing - Dimensional modeling5
Star SchemasSelect the measurementsSELECT P.Name, SUM(F.Sales) . . .JOIN the FACT table with DimensionsFROM Sales F, Time T, Product P,Location LWHERE F.TM Dim Id T.Dim IdAND F.PR Dim Id P.Dim IdAND F.LOC Dim Id L.Dim IdConstrain the DimensionsAND T.Month 'Jan' AND T.Year '2003' ANDL.Country Name 'USA'Advantages:-easy to understand-better performance-extensibleF. Radulescu - Data warehousing - Dimensional modeling‘Group by' for the aggregation levelGROUP BY P.Category6
Snow-flake SchemasIf we did not de-normalizethe dimensionsF. Radulescu - Data warehousing - Dimensional modelingRule of thumb:don’t use them7
Four-Step Dimensional Design Process 1.2.3.4.Objective: design of a dimensional databaseby considering four steps in a particular order:Select the business process to modelDeclare the grain of the business processChoose the dimensions that apply to eachfact table row.Identify the numeric facts that will populateeach fact table row(Presentation based on Ralph Kimball, Margy Ross - The Data Warehouse Toolkit,Second Edition, Wiley & Sons, 2002, pp.29-65)F. Radulescu - Data warehousing - Dimensional modeling8
1. Select the business process A process is a natural business activityperformed in the organizationTypically is supported by a source datacollection system.Example business processes include: raw materials neral ledgerF. Radulescu - Data warehousing - Dimensional modeling9
1. Select the business process – cont. It is not an organizational businessdepartment or function.For example, we build a single dimensionalmodel to handle orders data rather thanbuilding separate models for the sales andmarketing departments, which both want toaccess orders data.F. Radulescu - Data warehousing - Dimensional modeling10
1. Select the business process – cont. If we establish departmentally bounddimensional models, we’ll inevitably duplicatedata with different labels and terminology.Multiple data flows into separate dimensionalmodels will make us vulnerable to datainconsistencies.The best way to ensure consistency is topublish the data once.A single publishing reduces the extracttransformation-load development effortF. Radulescu - Data warehousing - Dimensional modeling11
2. Declare the grain Declaring the grain means specifying exactlywhat an individual fact table row represents.The grain conveys the level of detailassociated with the fact table measurements.It provides the answer to the question, “Howdo you describe a single row in the facttable?”F. Radulescu - Data warehousing - Dimensional modeling12
2. Declare the grain – cont.Example grain declarations include: An individual line item on a customer’s retailsales ticket as measured by a scanner device A line item on a bill received from a doctor An individual boarding pass to get on a flight A daily snapshot of the inventory levels foreach product in a warehouse A monthly snapshot for each bank accountF. Radulescu - Data warehousing - Dimensional modeling13
2. Declare the grain – cont. An inappropriate grain declaration will haunta data warehouse implementation.Declaring the grain is a critical step that can’tbe taken lightly.If in steps 3 or 4 we see that the grainstatement is wrong we must return to step 2,redeclare the grain correctly, and revisit steps3 and 4 again.F. Radulescu - Data warehousing - Dimensional modeling14
3. Choose the dimensions If we are clear about the grain, then thedimensions typically can be identified quiteeasily.Represent all possible descriptions that takeon single values in the context of eachmeasurement.F. Radulescu - Data warehousing - Dimensional modeling15
3. Choose the dimensions – cont. Examples of common dimensions include: date,product,customer,transaction type,status.F. Radulescu - Data warehousing - Dimensional modeling16
4. Identify the facts Facts are determined by answering thequestion, “What are we measuring?”All candidate facts in a design must be true tothe grain defined in step 2.Facts that clearly belong to a different grainmust be in a separate fact table.Typical facts are numeric additive figuressuch as quantity ordered or dollar costamount.F. Radulescu - Data warehousing - Dimensional modeling17
Retail Case Study Let us consider a large grocery chain with100 grocery stores spread over a five-statearea.Each store has a full complement ofdepartments, including grocery, frozen foods,dairy, meat, produce, bakery, floral, andhealth/beauty aids.Each store has roughly 60,000 individualproducts on its shelves.F. Radulescu - Data warehousing - Dimensional modeling18
Retail Case Study The individual products are called stockkeeping units (SKUs).About 55,000 of the SKUs come from outsidemanufacturers and have bar codes imprintedon the product package. These bar codes arecalled universal product codes (UPCs).UPCs are at the same grain as individualSKUs.Each different package variation of a producthas a separate UPC and hence is a separateSKU.F. Radulescu - Data warehousing - Dimensional modeling19
Retail Case Study The remaining 5,000 SKUs come fromdepartments such as meat, produce, bakery,or floral.While these products don’t have nationallyrecognized UPCs, the grocery chain assignsSKU numbers to them.Since our grocery chain is highly automated,we stick scanner labels on many of the itemsin these other departments.F. Radulescu - Data warehousing - Dimensional modeling20
Retail Case Study Although the bar codes are not UPCs, theyare certainly SKU numbers.Data is collected at several places in agrocery store. Some of the most useful datais collected at the cash registers ascustomers purchase products.The POS system is at the front door of thegrocery store where consumer takeaway ismeasured.The back door, where vendors makedeliveries, is another interesting datacollection point.F. Radulescu - Data warehousing - Dimensional modeling21
Retail Case Study Both store management and headquartersmarketing spend a great deal of timetinkering with pricing and promotions.Promotions in a grocery store includetemporary price reductions, ads innewspapers and newspaper inserts, displaysin the grocery store (including end-aisledisplays), and coupons.F. Radulescu - Data warehousing - Dimensional modeling22
Retail Case Study The most direct and effective way to create a surge in thevolume of product sold is to lower the price dramatically.A 50-cent reduction in the price of paper towels, especiallywhen coupled with an ad and display, can cause the sale ofthe paper towels to jump by a factor of 10.Unfortunately, such a big price reduction usually is notsustainable because the towels probably are being sold ata loss.Based on this business case study, we’llbegin to design the dimensional model.F. Radulescu - Data warehousing - Dimensional modeling23
Step 1. Select the Business Process The first step in the design is to decide whatbusiness process(es) to model by combiningan understanding of the businessrequirements with an understanding of theavailable data.The first dimensional model built should bethe one with the most impact—it shouldanswer the most pressing business questionsand be readily accessible for data extraction.F. Radulescu - Data warehousing - Dimensional modeling24
Step 1. Select the Business Process In retail case study, management wants tobetter understand customer purchases ascaptured by the POS system.Thus the business process we’re going tomodel is POS retail sales.This data will allow us to analyze whatproducts are selling in which stores on whatdays under what promotional conditions.F. Radulescu - Data warehousing - Dimensional modeling25
Step 2. Declare the Grain Preferably you should develop dimensionalmodels for the most atomic informationcaptured by a business process.Atomic data is the most detailed informationcollected; such data cannot be subdividedfurther.Atomic data is highly dimensional – so is aperfect match for the dimensional approach.The less granular model is vulnerable tounexpected user requests to drill down intothe details.F. Radulescu - Data warehousing - Dimensional modeling26
Step 2. Declare the Grain Aggregated summary data plays an important roleas a performance-tuning tool, but it is not asubstitute for giving users access to the lowest-leveldetails.A data warehouse almost always demands dataexpressed at the lowest possible grain of eachdimension not because queries want to seeindividual low-level rows, but because queries needto cut through the details in very precise ways.In our case study, the most granular data is anindividual line item on a POS transaction.F. Radulescu - Data warehousing - Dimensional modeling27
Step 3. Choose the Dimensions A careful grain statement determines theprimary dimensionality of the fact table.It is then often possible to add moredimensions to the basic grain of the facttable, where these additional dimensionsnaturally take on only one value under eachcombination of the primary dimensions.If the additional dimension violates the grainby causing additional fact rows to begenerated, then the grain statement must berevised to accommodate this dimension.F. Radulescu - Data warehousing - Dimensional modeling28
Step 3. Choose the Dimensions In our case study we identify 3 primarydimensions: the date, product, and storedimensions.Additionally we can add new dimensions, asthe promotion under which the product issold.In our case study we decide on the followingdescriptive dimensions: date, product, store,and promotion.In addition, we’ll include the POS transactionticket number as a special dimension(described later)F. Radulescu - Data warehousing - Dimensional modeling29
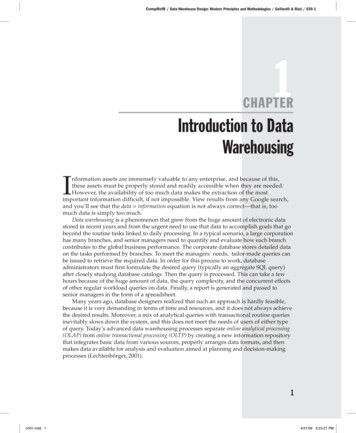
Step 3. Choose the DimensionsProduct DimensionDate DimensionDate Key (PK)Date Attributes TBDStore DimensionStore Key (PK)Store Attributes TBD POS Retail SalesTransaction FactDate Key (FK)Product Key (FK)Store Key (FK)Promotion Key (FK)POS Transaction NumberFacts TBDProduct Key (PK)Product Attributes TBDPromotion DimensionPromotion Key (PK)Promotion Attributes TBDTBD – To be determinedF. Radulescu - Data warehousing - Dimensional modeling30
Step 4. Identify the Facts The facts must be true to the grain (in thiscase the individual line item on the POStransaction).The facts collected by the POS systeminclude the sales quantity, per unit sales priceand the sales dollar amount ( sales quantity* unit price).Some POS systems provide a standard dollarcost for the product as delivered to the storeby the vendor.F. Radulescu - Data warehousing - Dimensional modeling31
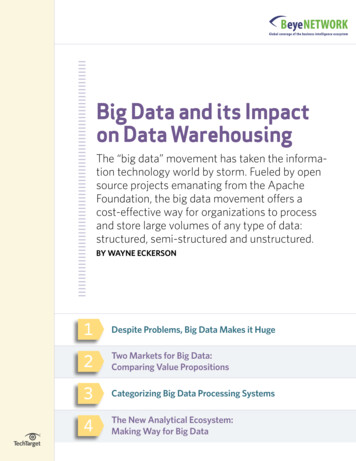
Step 4. Identify the FactsDate DimensionDate Key (PK)Date Attributes TBDStore DimensionStore Key (PK)Store Attributes TBD POS Retail SalesTransaction FactDate Key (FK)Product Key (FK)Store Key (FK)Promotion Key (FK)POS Transaction NumberSales QuantitySales Dollar AmountCost Dollar AmountGross Profit Dollar AmountProduct DimensionProduct Key (PK)Product Attributes TBDPromotion DimensionPromotion Key (PK)Promotion Attributes TBDTBD – To be determinedF. Radulescu - Data warehousing - Dimensional modeling32
Step 4. Identify the Facts The gross profit is obtained by subtracting the costdollar amount from the sales dollar amount.All these facts (sales quantity, sales dollar amount,cost dollar amount and gross profit dollar amount) areadditive across all the dimensions.Percentages and ratios, such as gross margin, arenonadditive (gross margin gross profit / dollarrevenue)The numerator and denominator should be stored inthe fact table.The ratio can be calculated in a data access tool forany slice of the fact table by remembering to calculatethe ratio of the sums, not the sum of the ratios.Unit price is also a nonadditive fact (is a ratio)F. Radulescu - Data warehousing - Dimensional modeling33
Dimension Table Attributes The date dimension is the one dimensionnearly guaranteed to be in every data martbecause virtually every data mart is a timeseries.The time-of-day dimension is different fromthe date dimension.F. Radulescu - Data warehousing - Dimensional modeling34
Date dimension: Partial list of columnsDate Key (PK)DateFull Date DescriptionDay of WeekDay Number in EpochWeek Number in EpochMonth Number in EpochDay Number in Calendar MonthDay Number in Calendar YearDay Number in Fiscal MonthDay Number in Fiscal YearLast Day in Week IndicatorLast Day in Month IndicatorCalendar Week Ending DateCalendar Week Number in YearCalendar Month NameCalendar Month Number in YearCalendar Year-Month (YYYY-MM)F. Radulescu - Data warehousing - Dimensional modelingCalendar QuarterCalendar Year-QuarterCalendar Half YearCalendar YearFiscal WeekFiscal Week Number in YearFiscal MonthFiscal Month Number in YearFiscal Year-MonthFiscal QuarterFiscal Year-QuarterFiscal Half YearFiscal YearHoliday IndicatorWeekday IndicatorSelling SeasonMajor EventSQL Date Stamp35
Date dimension – cont. The holiday indicator takes on the values of Holidayor Non-holiday.Weekday indicator have a value of Weekday orWeekend.The selling season column is set to the name of theretailing season, if any. Examples in the UnitedStates could include Christmas, Thanksgiving,Easter, Valentine’s Day, Fourth of July, or None.The major event column is similar to the seasoncolumn and can be used to mark special outsideevents such as Super Bowl Sunday or Labor Strike.F. Radulescu - Data warehousing - Dimensional modeling36
Date dimension – cont. Data warehouses always need an explicit datedimension table.There are many date attributes not supported by theSQL date function, including fiscal periods, seasons,holidays, and weekends.Rather than attempting to determine thesenonstandard calendar calculations in a query, weshould look them up in a date dimension table.Date and time are almost completely independent.If we combined the two dimensions, the datedimension would grow significantly.F. Radulescu - Data warehousing - Dimensional modeling37
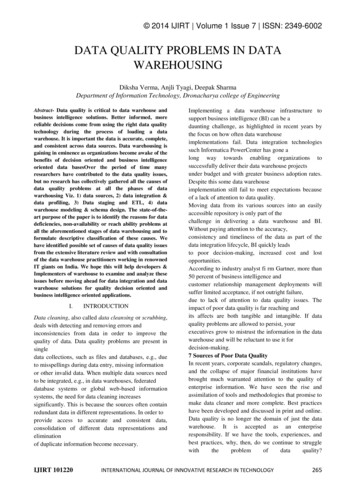
Date dimension - 8.2002Full DateDescriptionJanuary 1, 2002January 2, 2002January 3, 2002January 4, 2002January 5, 2002January 6, 2002January 7, 2002January 8, 2002CalendarDay of WeekMonthTuesdayJanuaryWednesday SundayJanuaryMondayJanuaryTuesdayJanuaryF. Radulescu - Data warehousing - Dimensional modelingFiscal YearCalendar YearMonth2002 F2002-012002 F2002-012002 F2002-012002 F2002-012002 F2002-012002 F2002-012002 F2002-012002 ayWeekendWeekendWeekdayWeekday38
Product Dimension The product dimension describes every SKU in thegrocery store.A typical store in the chain may stock 60,000 SKUs,but when we account for different merchandisingschemes across the chain and historical productsthat are no longer available, the product dimensionwould have at least 150,000 rows and perhaps asmany as a million rows.The product dimension is almost always sourcedfrom the operational product master file.F. Radulescu - Data warehousing - Dimensional modeling39
Product dimension: Partial list of columns Product Key (PK)Product DescriptionSKU Number (Natural Key)Brand DescriptionCategory DescriptionDepartment DescriptionPackage Type DescriptionPackage SizeFat ContentDiet TypeWeightWeight Units of MeasureStorage TypeShelf Life TypeShelf WidthShelf HeightShelf DepthF. Radulescu - Data warehousing - Dimensional modeling40
Product dimension: ExampleProductKey123456789Product DescriptionBaked Well Light Sourdough Fresh BreadFluffy Sliced Whole WheatFluffy Light Sliced Whole WheatFat Free Mini Cinnamon RollsDiet Lovers Vanilla 2 GallonLight and Creamy Butter Pecan 1 PintChocolate Lovers 1/2 GallonStrawberry Ice Creamy 1 PintIcy Ice Cream SandwichesF. Radulescu - Data warehousing - Dimensional modelingBrandDescriptionBaked CategoryDepartmentDescription n Bread BakeryFrozen DessertsFrozen FoodsFrozen DessertsFrozen FoodsFrozen DessertsFrozen FoodsFrozen DessertsFrozen FoodsFrozen DessertsFrozen FoodsFat ContentReduced FatRegular FatReduced FatNon-FatNon-FatReduced FatRegular FatRegular FatRegular Fat41
Product dimension – cont. A reasonable product dimension table wouldhave 50 or more descriptive attributes.Each attribute is a rich source for constrainingand constructing row headers.Viewed in this manner, we see that drilling downis nothing more than asking for a row headerthat provides more information.Drilling down in a data mart is nothing more thanadding row headers from the dimension tables.Drilling up is removing row headers.We can drill down or up on attributes from morethan one explicit hierarchy and with attributesthat are part of no hierarchy.F. Radulescu - Data warehousing - Dimensional modeling42
Store Dimension The store dimension describes every store in our grocerychain.The store dimension is the primary geographic dimensionin our case study.Each store can be thought of as a location. Because of this,we can roll stores up to any geographic attribute, such asZIP code, county, and state in the United States.Stores usually also roll up to store districts and regions.These two different hierarchies are both easily representedin the store dimension because both the geographic andstore regional hierarchies are well defined for a single storerow.It is not uncommon to represent multiple hierarchies in adimension table. Ideally, the attribute names and valuesshould be unique across the multiple hierarchies.F. Radulescu - Data warehousing - Dimensional modeling43
Store Dimension: Partial list of columns Store NameStore Number (Natural Key)Store Street AddressStore CityStore CountyStore StateStore Zip CodeStore ManagerStore DistrictStore RegionFloor Plan TypePhoto Processing TypeFinancial Service TypeSelling Square FootageTotal Square FootageFirst Open DateLast Remodel DateF. Radulescu - Data warehousing - Dimensional modeling44
Promotion Dimension The promotion dimension describes thepromotion conditions under which a productwas sold.Promotion conditions include temporary pricereductions, end-aisle displays, newspaperads, and coupons.This dimension is often called a causaldimension (as opposed to a casualdimension) because it describes factorsthought to cause a change in product sales.F. Radulescu - Data warehousing - Dimensional modeling45
Promotion Dimension - columns Promotion Key (PK)Promotion NamePrice Reduction TypePromotion Media TypeAd TypeDisplay TypeCoupon TypeAd Media NameDisplay ProviderPromotion CostPromotion Begin DatePromotion End Date .F. Radulescu - Data warehousing - Dimensional modeling46
Transaction Number: DegenerateDimension Operational control numbers such as ordernumbers, invoice numbers, and bill-ofladingnumbers usually give rise to emptydimensions and are represented asdegenerate dimensions (that is, dimensionkeys without corresponding dimension tables)in fact tables where the grain of the table isthe document itself or a line item in thedocument.F. Radulescu - Data warehousing - Dimensional modeling47
Bibliography1.2.3.4.5.6.W.H. Inmon - Building The Data Warehouse. ThirdEdition, Wiley & Sons, 2002Ralph Kimball, Margy Ross - The Data WarehouseToolkit, Second Edition, Wiley & Sons, 2002Dimitra Vista, CS 680 Course notesWikipedia – Pages on Data Warehouse, etc.http://searchsqlserver.techtarget.com/Vincent Rainardi, Building a Data Warehouse withExamples in SQL Server, Springer, 2008F. Radulescu - Data warehousing - Dimensional modeling48
F. Radulescu -Data warehousing -Dimensional modeling 11 1. Select the business process -cont. If we establish departmentally bound dimensional models, we'll inevitably duplicate data with different labels and terminology. Multiple data flows into separate dimensional models will make us vulnerable to data inconsistencies.