Transcription
PHYSICAL REVIEW A 82, 052503 (2010)Two-dimensional Fourier-transform spectroscopy of potassium vaporX. Dai, A. D. Bristow, D. Karaiskaj, and S. T. Cundiff*JILA, University of Colorado and National Institute of Standards and Technology,Boulder, Colorado 80309-0440, USA(Received 12 January 2010; published 3 November 2010)Optical two-dimensional Fourier-transform (2DFT) spectroscopy is used to study the coherent optical responseof potassium vapor in a thin transmission cell. Rephasing and nonrephasing spectra of the D1 and D2 transitions areobtained and compared to numerical simulations. Non-perturbative calculations using the optical Bloch equationsgive very good agreement with the experimental peak strengths and line shapes. Nonradiative Raman-likecoherences are isolated using a different 2DFT projection. Comparison between the optical and Raman linewidthsshows that dephasing is due to partially correlated energy fluctuations. Density-dependent measurements showdistortion of 2DFT spectra due to pulse propagation effects.DOI: 10.1103/PhysRevA.82.052503PACS number(s): 32.30.Jc, 32.70.JzI. INTRODUCTIONVapors of alkali-metal atoms have a relatively simple energylevel diagram due to the single outer electron. Consequently,they are ideal systems for the study of light-matter interactions.Examples of this include recent ultracold [1] and electromagnetically induced transparency [2] experiments.The dynamics of alkali metals have been captured byultrafast transient optical measurements, revealing signals thathave been attributed to the tri-level [3] and two-photon [3]photon echoes, propagation effects [4,5], quantum interference[4,6,7], and non-Markovian response [8,9].Coherent continuous-wave and transient measurementsoften suffer from ambiguous interpretation, even in simplesystems such as alkali-metal vapors. In these vapors theoptical response is affected by interatomic interactions, pulsepropagation, and contributions from nonradiative coherences,which have not been cleanly resolved.Optical two-dimensional Fourier-transform (2DFT) spectroscopy has been shown to separate various quantum excitation pathways by spreading the spectrum of a coherent signalon a two-dimensional frequency plane [10]. A sophisticatedtime-domain technique, 2DFT spectroscopy measures thephase of a nonlinear signal, which is generated by themixing of three excitation pulses by the third-order nonlinearresponse of the sample. By measuring the phase as one ofthe delays between the excitation pulse is precisely stepped,it is possible to determine the frequency (or frequencies) ofany coherences that exist during the interval between theexcitation pulses. The two frequency dimensions typicallycorrespond to the spectrum of the emission and the Fouriertransform with respect to the delay that is stepped. Thisdescription ignores many important nuances of the technique,but is given to provide a simplified introduction to themethod.Optical 2DFT spectroscopy has its origins in multidimensional nuclear magnetic resonance spectroscopy [11] usingradio-frequency pulses, and has also been used to exploremolecular vibrations with infrared laser pulses [12–15]. Atoptical frequencies, the principles of 2DFT spectroscopy )/052503(6)052503-1been demonstrated on rubidium vapor [16–18], although thistechnique has been more commonly applied to the studyof coherent dynamics in molecules [19] and semiconductornanostructures [20].Several different 2DFT spectra can be produced, dependingon the time ordering of the pulses and which time delay isscanned. The most common 2DFT spectra provide informationabout the dephasing of optical coherences, even in thepresence of inhomogeneous broadening. Other 2DFT spectracan clearly isolate nonradiative “Raman”-type coherencesbetween two levels that do not have a dipole moment betweenthem, but have radiative transitions to another common state[21]. In 2DFT spectroscopy, these nonradiative coherencesare created because the laser has sufficient bandwidth toexcite both radiative transitions from the common state. Incontrast, coherent anti-Stokes Raman spectroscopy (CARS),which is typically used to access Raman coherences, usuallyuses two lasers producing nanosecond pulses of differentfrequencies.In this paper, we present a detailed study of the coherentoptical response for the two coupled D lines of potassiumvapor in a thin transmission cell. We use an actively stabilizedapparatus to generate the phase locked beams. This apparatusis versatile so that, in addition to acquiring the common“rephasing” and “nonrephasing” 2DFT spectra, we can easilyscan any of the beams to acquire other 2DFT spectra, such asone that isolates Raman coherences [21]. By comparing thewidth of the Raman peaks in this spectrum to those for theoptical coherences in the rephasing spectrum, it is possible todetermine the degree of correlation for the fluctuations of theenergy levels that cause dephasing. Experimental results arecompared to numerical simulations based on the optical Blochequations, to provide complete interpretation of the observedoptical features. Our simulations include finite pulse widtheffects and are not perturbative, thus they can capture effectsdue to higher-order susceptibilities. At higher atomic densities,we observe distortions of the spectra, which do not appear inthe simulations, and which we ascribe to pulse propagationeffects.The prior work on atomic vapors (rubidium) used differentexperimental methods than those presented here. The firstwork used a pulse shaper to produce collinear beams and usedphase cycling to separate out the 2DFT spectra [16]. More 2010 The American Physical Society
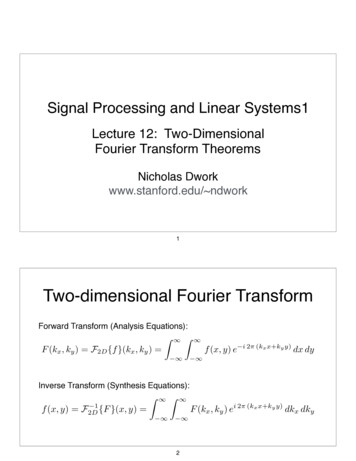
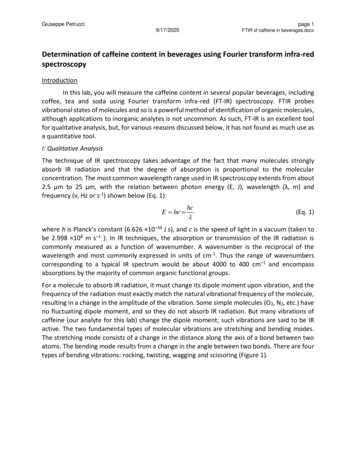
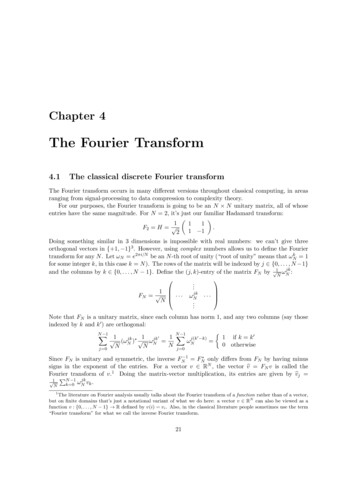
X. DAI, A. D. BRISTOW, D. KARAISKAJ, AND S. T. CUNDIFFFIG. 1. (Color online) Schematic diagram of the experimentalsetup. Notation: L: lens, BS: beam splitter, M: mirror.recent studies used a collinear geometry and acoustic-opticmodulators to modulate the phase [18] or a diffractive pulseshaper to produce noncollinear pulses in a geometry similarto what we use, although the reference pulse went through thesample, rather than around it [17]. Only the second of thesepapers [18] provided a comparison to a perturbation theory thatignores finite pulse width effects, and none of them showedisolation of the nonradiative coherences.II. EXPERIMENTALOptical 2DFT spectroscopy explicitly measures the phaseof a transient four-wave mixing (TFWM) signal during twotime periods of a three-pulse excitation sequence [22]. Theresulting data is Fourier transformed onto a two-dimensionalfrequency plane, thus separating the electronic interactionsbetween photoexcited states.A mode-locked Ti:sapphire laser supplies 200 fs pulses,centered at 768.2 nm to an ultrastable platform of nestedand phase-controlled interferometers to generate four identicalpulses arranged in a box geometry, i.e., the pulses propagateparallel to each other arranged on the four corners of a squarein the plane perpendicular to the propagation direction [22]. Aschematic of the four pulses and their use is shown in Fig. 1:three pulses (A, B, and C) are focused on the same spot ofa home-made alkali-metal vapor cell and generate a TFWMsignal from excitation of both the 42 S1/2 42 P1/2 (D1 ) and42 S1/2 42 P3/2 (D2 ) transitions.Time delays between the pulses are denoted τ , T , and tbetween the first and second, the second and third, and thethird pulse and signal, respectively. Pulse four provides thephase-stabilized tracer (Tr) and reference (Ref) separately:the tracer copropagates with the TFWM signal and is usefulfor alignment, but is blocked during the 2DFT measurements;the reference beam is routed around the vapor cell andrecombined with the signal, producing an interferogram that isrecorded by a spectrometer that uses a cooled charged coupleddevice camera for detection. The phase of the signal fieldis determined by an all-optical method, which is realized bycareful measurement of relative phases between all laser pulsesand the TFWM signal [23]. Further experimental details canbe found elsewhere [22,24].The TFWM signal, Es EA EB EC , is generated in thephase-matched direction ks kA kB kC where EA isthe conjugated pulse. The subscripts, A, B, and C only denotedirection, not time ordering. If EA arrives first the resulting2DFT spectrum, SI (τ,T ,t), is known as “rephasing” becausePHYSICAL REVIEW A 82, 052503 (2010)the dephasing due to inhomogeneous broadening is canceled.In a TFWM experiment, this time ordering produces a photonecho. If EA arrives second, the cancellation of dephasingdue to inhomogeneous broadening does not occur, and theresulting SI I (τ,T ,t) spectra are referred to as “nonrephasing.”SI I I (τ,T ,t) spectra, where EA arrives last, are sensitive totwo-quantum resonances [25–27]. The time-resolved spectraSi (τ,T ,t) are usually Fourier transformed with respect to twotime delays, while the third delay is fixed. The time delays τand T are defined based on time ordering, not direction, andthus are strictly positive.Reflection cells designed for high-temperature vaporexperiments [28] cannot be used in our multidimensionalspectroscopy apparatus, because the signal is detected intransmission [22]. Furthermore, in a reflection geometry thephase of the signal depends on the position of the interfaceproducing the reflection. Therefore, a thin transmission cellfor alkali atomic vapor has been designed and manufacturedfor the current experiment. The cell body is machined fromhigh-grade titanium. Two sapphire windows are separatelydiffusion bonded to the titanium body. The gap between twowindows, L 19 µm, can be adjusted before the transmissioncell is loaded with solid potassium [28]. The vapor temperatureis controlled by a heater attached to the transmission cell,up to a maximum of 800 C. However, for the measurementreported here, the cell temperature is varied from 210 to270 C, ensuring low absorption and number densities inthe range 2.03 1020 to 1.87 1021 m 3 [29]. During themeasurements, the absorption spectrum of the potassium vaporat each temperature is recorded to estimate the gap sizebetween two windows by comparing experimental spectra withcalculated absorption spectra.The measured linear absorption and the energy leveldiagram for atomic potassium are shown in Figs. 2(a) and 2(b),respectively. The laser excites both D1 and D2 transitions, andthere are no resonant two-photon transitions. Figure 2(a) alsoshows the calculated linear absorption spectrum at 250 C. Atthis temperature, the resonance broadened linewidths of theD1 and D2 transitions are below the spectrometer resolution.An argon buffer gas at 1500 Torr pressure is added to thecell to induce collisional broadening. The argon reduces theabsorbance αL below 1 into the weak absorption regime. Inthe calculation, the spectral linewidth is the sum of resonancefrom potassium-potassium interactions [30] and collisionalbroadening with argon [31].III. RESULTS AND DISCUSSIONFigures 2(c) and 2(d) show the amplitude and real partof SI (ωτ ,T ,ωt ) and SI I (ωτ ,T ,ωt ) 2DFT spectra of potassiumvapor at 250 C. The emission frequency ωt is defined to bepositive, thus for SI (ωτ ,T ,ωt ), the signal appears at negativeωτ because the first pulse is conjugated. The SI (ωτ ,T ,ωt ) andSI I (ωτ ,T ,ωt ) spectra can be used to determine homogeneousand inhomogeneous linewidths [32–34]. The horizontal axisof the spectrum is generated directly from the recordedinterferogram between the reference pulse and the TFWMsignal [35] at each delay step between the pulses A and B.The vertical axis of the spectrum is generated by fast Fouriertransform with respect to τ . During the measurements, T was052503-2
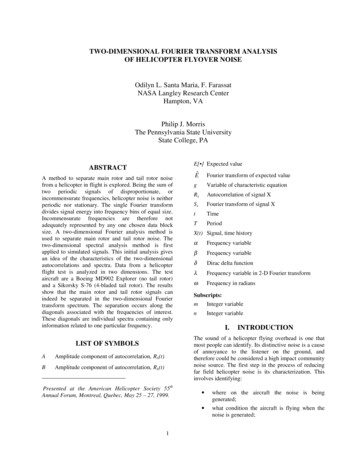
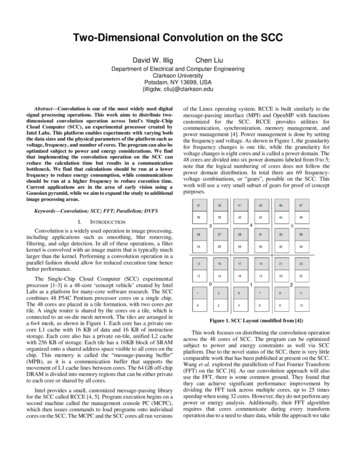
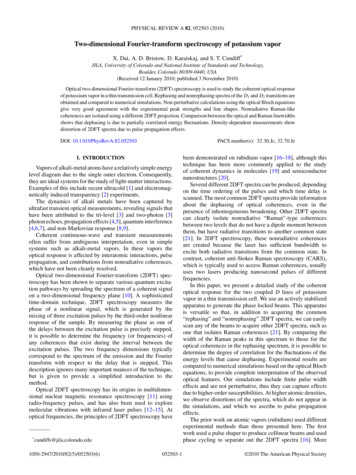
TWO-DIMENSIONAL FOURIER-TRANSFORM . . .(b)0.6(a)D10.2(c)391.5Absorption Frequency ωτ /2 π 89.50.63890.23890.4 -389-389-389.5821.365P390.50.8390389.54D42P3/2 391.0242P1/2 389.290.40391.5PHYSICAL REVIEW A 82, 052503 (2010)RARC-0.2-389.50.2-390-390.5-0.6-390RDRB-3910 -390.5-1-391-391.5-391.5389 389.5 390 390.5 391 391.5389 389.5 390 390.5 391 391.5Emission Frequency ω t /2π (THz)FIG. 2. (Color) (a) Excitation pulse spectrum (red dashed)and experimental (black dotted) and calculated (blue solid) linearabsorption of potassium vapor at 250 C. α is the absorptioncoefficient and L is the gap between the two sapphire windows.(b) Relevant energy levels of atomic potassium, with frequencies inTHz. (c) Experimental amplitude rephasing spectrum SI (ωτ ,T ,ωt )(bottom) and nonrephasing spectrum SI I (ωτ ,T ,ωt ) (top) of potassium vapor. (d) Experimental real-part SI (ωτ ,T ,ωt ) (bottom) andSI I (ωτ ,T ,ωt ) (top) spectra. The spectra are normalized to the mostintense peak.set to 580 fs, which is equal to 1/(fD2 fD1 ) where fD1and fD2 are the transitions frequencies corresponding to thetransitions D1 and D2 , respectively.Each spectrum has two diagonal peaks, which correspond tothe D1 and D2 transitions, and two off-diagonal peaks, whichrepresent coupling between the two resonances. However,the relative peak strengths are different in SI (ωτ ,T ,ωt ) andSI I (ωτ ,T ,ωt ) spectra. This difference can be qualitativelyexplained by the double-sided Feynman diagrams shown inFig. 3. Double-sided Feynman diagrams are useful for illustrating all possible Liouville-space pathways in the systems [10].Two pathways contribute to each peak in the SI (ωτ ,T ,ωt )spectra; whereas for SI I (ωτ ,T ,ωt ) three pathways contributeto each diagonal peak (NA or NB) and only one pathway toeach cross peak (NC or ND). Generally, the peak strengthsare proportional to the sum over participating diagrams,while the strength of an individual diagram is proportional to µi , where index i runs from 1 to 4 and µi is the transitiondipole moment for each excitation step in each double-sidedFeynman diagram. The ratio between the transitiondipole moment for the D2 transition, µD2 , to the dipolemoment for D1 transition, µD1 , is approximately 2 : 1.Assuming each quantum pathway has the same contributionto the peak strength, the peak strength ratio RA:RC:RD:RBis proportional to 2µ4D1 : 2µ2D1 µ2D2 : 2µ2D2 µ2D1 : 2µ4D2 , orFIG. 3. (Color online) Double-sided Feynman diagrams for allpossible Liouville-space pathways contributing to the third-orderoptical response of a V-type system. The pathways for the rephasingspectrum SI (ωτ ,T ,ωt ) and Raman spectrum SI (τ,ωT ,ωt ) are listedin the top two rows; the pathways for the nonrephasing spectrumSI I (ωτ ,T ,ωt ) are listed in bottom two rows. The state numbers,0, 1, and 2, correspond to 42 S1/2 , 42 P1/2 , and 42 P3/2 of potassiumatoms.relative values of 1:2:2:4. Similarly, the peak strength ratioin the SI I (ωτ ,T ,ωt ) measurement NA:NC:ND:NB is equal to2:1:1:5, which agrees well with the experimental result.The interaction between light and a closed two-level systemcan be described by the optical Bloch equations [36]:ρ̇01ρ̇00 ρ̇11 ,iρ̇11 γ sp ρ11 µ01 E(ρ01 ρ10 ),h̄iph γ ρ01 iω01 ρ01 µ01 E(ρ11 ρ00 ),h̄(1)(2)(3)where ρ00 and ρ11 are density matrix elements for the groundand excited-state population, respectively, and ρ01 is the052503-3
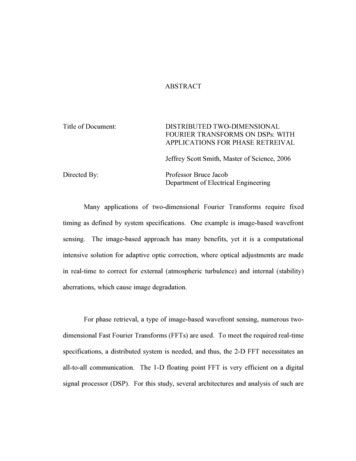
X. DAI, A. D. BRISTOW, D. KARAISKAJ, AND S. T. CUNDIFF2π Liωt P (3) (τ,T ,ωt )E(τ,T ,ωt ) n(ωt )c(4)where L is the sample thickness, n(ωt ) is the index ofrefraction of the sample, and c is the speed of light in vacuum.SI (ωτ ,T ,ωt ) and SI I (ωτ ,T ,ωt ) 2DFT spectra are defined asthe Fourier transform with respect to delay τ : E(τ,T ,ωt ) eiωτ τ dτ.(5)SI,I I (ωτ ,T ,ωt ) The numerical simulations of the SI (ωτ ,T ,ωt ) andSI I (ωτ ,T ,ωt ) spectra shown in Fig. 4 are in very goodagreement with the experiment; correct peak strengths andsymmetric starlike line shapes are reproduced in the amplitudespectra, indicating the dominance of homogeneous broadening[32]. As expected, the line shapes are mainly absorptive,which is in contrast to semiconductors, where many-bodyinteractions result in dispersive line shapes [20,24,38].While the line shapes in the SI (ωτ ,T ,ωt ) and SI I (ωτ ,T ,ωt )spectra are mainly absorptive, there are weak dispersivecontributions. Purely absorptive contributions can be isolatedby adding the SI (ωτ ,T ,ωt ) and SI I (ωτ ,T ,ωt ) signals together[18,39]. The experimental and theoretical purely absorptivespectra are shown in Fig. 5. Compared with the SI (ωτ ,T ,ωt )and SI I (ωτ ,T ,ωt ) spectra, the disappearance of dispersivewings in the purely absorptive spectra results in a higherresolution of spectral features.1391.5ω τ /2π (THz)off-diagonal term of the density matrix. γ sp and γ ph are thepopulation relaxation and dephasing rates, respectively, µ01is the transition dipole moment, ω01 is the resonant transitionfrequency, and E is the electric field amplitude. We extendedthe equations to a multilevel system and numerically solvedthem [37,38]. In the calculation, γ ph is the total linewidthdue to resonance and collision broadening. The inducedpolarization of the system is P Ntr(µρ). Then the electricfield of the emitted signal is determined from the third-orderpolarization [37]:PHYSICAL REVIEW A 82, 052503 (2010)0.63910.2390.5390-0.2389.5-0.6389-1389 389.5 390 390.5 391 391.5 389 389.5 390 390.5 391 391.5ωt /2π (THz)FIG. 5. (Color) Experimental (left) and theoretical (right) purelyabsorptive spectra obtained by the addition of the SI (ωτ ,T ,ωt ) andSI I (ωτ ,T ,ωt ) spectra.Cross peaks in SI (ωτ ,T ,ωt ) have contributions fromground-state bleaching and excited-state emission pathways.These two pathways differ during the delay time T . After thesecond excitation pulse, the ground-state bleaching pathwayleaves the system in the ground state, while the excited-stateemission or Raman-like pathway (labeled TC or TD in Fig. 3)leaves the system in a coherent superposition of 42 P1/2 and42 P3/2 . SI (τ,ωT ,ωt ) spectra can be used to isolate Ramancoherence terms, projecting the 2DFT signal along ωT andωt instead of ωτ and ωt [21]. Technically, the measurementis achieved by scanning the third pulse C while keeping thetime delay τ between first two pulses constant. The spectrumis then obtained by fast Fourier transform of time domainsignal with respect to T . Figure 6 shows an experimentalspectrum of SI (τ,ωT ,ωt ), with τ 0 in the measurement. Inthe spectrum, two strong peaks are observed along the zeromixing energy, and two side peaks show up at the energyposition of TC (ED2 ,ED2 ED1 ) and TD (ED1 ,ED1 ED2 ),where ED1 and ED2 are the photon energies 0-0.6-3900-390.5-391-391.5-391.5389 389.5 390 390.5 391 391.5-1-390.5-391TC1.53911Mixing Frequency ωT /2π (THz)Absorption Frequency ω τ /2π (THz)391390.5389 389.5 390 390.5 391 391.50.410.5TBTA0.30-0.50.2-1TD-1.50.1-2Emission Frequency ωt /2π (THz)FIG. 4. (Color) Calculated amplitude (left) and real-part (right)2DFT spectra of potassium vapor for SI (ωτ ,T ,ωt ) (bottom) andSI I (ωτ ,T ,ωt ) (top) measurements. The spectra are normalized to themost intense peaks.-2.53893903913920Emission Frequency ωt /2π (THz)FIG. 6. (Color) Experimental amplitude SI (τ,ωT ,ωt ) spectrum.052503-4
TWO-DIMENSIONAL FOURIER-TRANSFORM . . .220 CAbsorption Frequency ω τ /2 π (THz)-389PHYSICAL REVIEW A 82, 052503 (2010)220 0.6-391.5-391.5270 C-389270 C0.4 -390.6-389.50.2-3900.2-390.90-390.50.42DFT spectra peaks due to propagation can then be observed.SI (ωτ ,T ,ωt ) spectra of potassium vapor at 220 and 270 C areshown in Fig. 7, where the absorbance αL is 0.2 and 1.3for the D2 transitions at those temperatures, respectively. Atthe lower temperature, the diagonal D2 feature is a symmetricstar shape, while at high temperature it is elongated along theemission photon axis. This change has been predicted [41–43],although the expected change in peak strength ratio is notobserved [41].0IV. 8391.1391.4Emission Frequency ωt /2 π (THz)FIG. 7. (Color) Distortion of the peak shapes due to propagationeffects. Left panels are the SI (ωτ ,T ,ωt ) spectra of the potassium vaporat 220 C (top) and 270 C (bottom). Right panels are the zoomedpictures of the diagonal peaks corresponding to the D2 transition at220 C (top) and 270 C (bottom).to the transitions D1 and D2 separately. The amplitude ofthe spectrum is normalized according to the strength of thestrongest peak; however, the spectrum is displayed with a colorscale of 0 to 0.5 to emphasize two side peaks. It is clear that thetwo quantum pathways for Raman coherences (TC and TD)can be isolated as two side peaks in the SI (τ,ωT ,ωt ) spectrum.Weak asymmetry between TC and TD features is observed,where the stronger peak has the same emission energy as thestronger zero mixing energy feature. This asymmetry is alsoobserved in semiconductors [21].The dephasing rate of the Raman coherence is related tothe dephasing rates of the optical transitions by [40]γD2 D1 γD2 γD1 2Rph (γD1 γD2 )1/2 ,(6)where γD2 D1 , γD2 , and γD1 are the dephasing rates for the Raman coherences, the D2 and D1 transitions, respectively. Thecoefficient Rph describes the degree of correlation betweenfluctuations of the two transitions. The dephasing rates of D2and D1 extracted from the SI (ωτ ,T ,ωt ) measurement are 0.128and 0.118 THz. The dephasing rates for the Raman coherencesat the energy position of TC and TD are 0.127 and 0.140 THz,respectively, so the correlation coefficients Rph are 0.45 and0.43, respectively. The positive correlation coefficients meansthat the energies of the D2 and D1 lines simultaneously shiftin the same direction relative to each other during the collisional scattering, as expected. These results show that 2DFTspectroscopy can make a quantitative determination of thecorrelation between fluctuations of two excited levels in atomicsystems.As in other types of spectroscopy, the line shapes in2DFT spectroscopy can be affected by the propagation of theexcitation laser pulses and signals in the resonant medium.Propagation effects in TFWM experiments of alkali-metalvapors have been discussed [5], as have distortions of 2DFTspectra due to propagation effects [41–44]. When the numberdensity of atomic potassium is increased by raising thetemperature, the absorption also strengthens. Distortion ofSI (ωτ ,T ,ωt ) and SI I (ωτ ,T ,ωt ) 2DFT spectra for potassium vapor have been obtained using a multidimensionalnonlinear spectrometer. Numerical simulation based on theoptical Bloch equations reproduce the experimental spectra,giving excellent agreement. Purely absorptive spectra areobtained by summing SI (ωτ ,T ,ωt ) and SI I (ωτ ,T ,ωt ). Wealso experimentally isolated Raman coherences by projectingthe 2DFT signal along ωT and ωt instead of ωτ and ωtand calculated the correlation between fluctuations of the D1and D2 transitions. Finally, the expected distortion of 2DFTspectra due to propagation effect is observed at higher vaportemperatures.2DFT spectroscopy has been proved to be a powerful tool toshow interactions and couplings in complex systems. However,those spectra are often very complicated and the line shapes canbe severely distorted for various reasons [43] and quantitativeanalysis is generally difficult for those spectra. Simple atomicsystems, such as the potassium vapor system studied in thispaper, can be excellent test beds to study the distortions ofthe line shapes in 2DFT spectroscopy. On the other hand, the2DFT technique can be a new spectroscopic method to studythe interactions in simple atomic and molecular systems. Aswe have demonstrated, the technique can directly show thecouplings and correlations between different energy levels ortransitions and provide quantitative information for those couplings and correlations. When energy level structures are morecomplex, the 2DFT technique will be more promising thantraditional spectroscopic techniques, since all spectroscopicinformation can be extracted from one single spectrum due tothe spectral characteristic of ultrafast laser pulses. In addition,our preliminary experimental results show that another typeof 2DFT spectrum called the SI I I spectrum, which has beenrecently demonstrated in semiconductor quantum wells [27],can also detect the couplings between different atoms. Insummary, we conclude that 2DFT spectroscopy of simplesystems can be useful to validate various techniques andtheories for 2DFT spectroscopy, and the 2DFT technique canbe an equally powerful tool to study the interactions andcouplings in simple quantum systems as well as complexsystems.ACKNOWLEDGMENTSThe authors thank T. Asnicar and H. Green for technicalassistance. The financial support is provided by NIST andthe National Science Foundation’s Physics Frontier CenterProgram.052503-5
X. DAI, A. D. BRISTOW, D. KARAISKAJ, AND S. T. CUNDIFF[1] I. Bloch, J. Dalibard, and W. Zwerger, Rev. Mod. Phys. 80, 885(2008).[2] M. Fleischhauer, A. Imamoglu, and J. Marangos, Rev. Mod.Phys. 77, 633 (2005).[3] A. Flusberg, T. Mossberg, R. Kachru, and S. R. Hartmann, Phys.Rev. Lett. 41, 305 (1978).[4] O. Kinrot and Y. Prior, Phys. Rev. A 50, 1999(R) (1994).[5] O. Kinrot and Y. Prior, Phys. Rev. A 51, 4996 (1995).[6] J. Golub and T. Mossberg, J. Opt. Soc. Am. B 3, 554 (1986).[7] F. Shen, J. Gao, A. A. Senin, C. J. Zhu, J. R. Allen, Z. H. Lu,Y. Xiao, and J. G. Eden, Phys. Rev. Lett. 99, 143201 (2007).[8] V. O. Lorenz and S. T. Cundiff, Phys. Rev. Lett. 95, 163601(2005).[9] V. O. Lorenz, S. Mukamel, W. Zhuang, and S. T. Cundiff, Phys.Rev. Lett. 100, 013603 (2008).[10] S. Mukamel, Annu. Rev. Phys. Chem. 51, 691 (2000).[11] R. R. Ernst, G. Bodenhausen, and A. Wokaun, Principles ofNuclear Magnetic Resonance in One and Two Dimensions(Clarendon, Oxford, 1987).[12] Y. Tanimura and S. Mukamel, J. Chem. Phys. 99, 9496 (1993).[13] M. Cho, Chem. Rev. 108, 1331 (2008).[14] M. D. Fayer, D. E. Moilanen, D. Wong, D. E. Rosenfeld, E. E.Fenn, and S. Park, Acc. Chem. Res. 42, 1210 (2009).[15] T. Elsaesser, Acc. Chem. Res. 42, 1220 (2009).[16] P. Tian, D. Keusters, Y. Suzaki, and W. Warren, Science 300,1553 (2003).[17] J. C. Vaughan, T. Hornung, K. W. Stone, and K. A. Nelson,J. Phys. Chem. A 111, 4873 (2007).[18] P. F. Tekavec, G. A. Lott, and A. H. Marcus, J. Chem. Phys. 127,214307 (2007).[19] N. S. Ginsberg, Y.-C. Cheng, and G. R. Fleming, Acc. Chem.Res. 42, 1352 (2009).[20] S. T. Cundiff, T. Zhang, A. D. Bristow, D. Karaiskaj, andX. Dai, Acc. Chem. Res. 42, 1423 (2009).[21] L. Yang, T. Zhang, A. D. Bristow, S. T. Cundiff, and S. Mukamel,J. Chem. Phys. 129, 234711 (2008).[22] A. D. Bristow, D. Karaiskaj, X. Dai, T. Zhang, C. Carlsson,K. R. Hagen, R. Jimenez, and S. T. Cundiff, Rev. Sci. Instrum.80, 073108 (2009).PHYSICAL REVIEW A 82, 052503 (2010)[23] A. D. Bristow, D. Karaiskaj, X. Dai, and S. T. Cundiff, Opt.Express 16, 18017 (2008).[24] A. D. Bristow, D. Karaiskaj, X. Dai, R. P. Mirin, and S. T.Cundiff, Phys. Rev. B 79, 161305(R) (2009).[25] K. W. Stone, K. Gundogdu, D. B. Turner, X. Li, S. T. Cundiff,and K. A. Nelson, Science 324, 1169 (2009).[26] L. Yang and S. Mukamel, Phys. Rev. Lett. 100, 057402 (2008).[27] D. Karaiskaj, A. D. Bristow, L. Yang, X. Dai, R. P. Mirin,S. Mukamel, and S. T. Cundiff, Phys. Rev. Lett. 104, 117401(2010).[28] V. O. Lorenz, X. Dai, H. Green, T. R. Asnicar, and S. T. Cundiff,Rev. Sci. Instrum. 79, 123104 (2008).[29] E. Fiock and W. Rodebush, J. Am. Chem. Soc. 48, 2522(1926).[30] E. Lewis, M. Rebbeck, and J. Vaughan, J. Phys. B 4, 741 (1971).[31] N. Lwin and D. Mccartan, J. Phys. B 11, 3841 (1978).[32] S. Faeder and D. Jonas, J. Phys. Chem. A 103, 10489 (1999).[33] I. Kuznetsova, T. Meier, S. T. Cundiff, and P. Thomas, Phys.Rev. B 76, 153301 (2007).[34] M. E. Siemens, G. Moody, H. Li, A. D. Bristow, and S. T.Cundiff, Opt. Express 18, 17699 (2010).[35] L. Lepetit, G. Cheriaux, and M. Joffre, J. Opt. Soc. Am. B 12,2467 (1995).[36] L. Allen and J. Eberly, Optical Resonance and Two-Level Atoms(Dover, New York, 1987).[37] J. M. Shacklette and S. T. Cundiff, J. Opt. Soc. Am. B 20, 764(2003).[38] X. Li, T. Zhang, C. N. Borca, and S. T. Cundiff, Phys. Rev. Lett.96, 057406 (2006).[39] M. Khalil, N. Demirdoven, and A. Tokmakoff, Phys. Rev. Lett.90, 047401 (2003).[40] A. G. V. Spivey, C. N. Borca, and S. T. Cundiff, Solid StateCommun. 145, 303 (2008).[41] D. Keusters and W. Warren, J. Chem. Phys. 119, 4478 (2003).[42] D. Keusters and W. Warren, Chem. Phys. Lett. 383, 21 (2004).[43] M. K. Yetzbacher, N. Belabas, K. A. Kitney, and D. M. Jonas,J. Chem. Phys. 126, 044511 (2007).[44] K. Kwak, D. E. Rosenfeld, and M. D. Fayer, J. Chem. Phys. 128,204505 (2008).052503-6
Optical two-dimensional Fourier-transform (2DFT) spec-troscopy has been shown to separate various quantum excita-tion pathways by spreading the spectrum of a coherent signal on a two-dimensional frequency plane [10]. A sophisticated time-domain technique, 2DFT spectroscopy measures t