Transcription
Microfluidic CD4 and CD8 T Lymphocyte Counters for Point-of-CareHIV Diagnostics Using Whole BloodNicholas N. Watkins et al.Sci Transl Med 5, 214ra170 (2013);DOI: 10.1126/scitranslmed.3006870Editor's SummaryTiny T Cell Counter for HIVThe microfluidic differential T cell counter is based on the Coulter counter principle: In the device, cells areflowed through a tiny pore that has a current passing through it; the cell, which doesn't conduct electricity, then blocksthe current and causes a ''spike'' in signal. The number of spikes told Watkins et al. how many cells traveled throughthe pore. The device also integrated sample preparation and cell selection. Red blood cells were lysed and removedfrom the sample, leaving primarily white blood cells (including T cells). Antibodies decorated the microfluidic channels,to capture the population of choice either CD4 or CD8 T cells. Thus, by obtaining a total cell count at the beginningand a final count at the end, the authors were able to quantify the number of T cells in the sample. Blood samplesfrom HIV-infected donors and healthy volunteers were tested and compared to the gold standard, flow cytometry.Watkins and colleagues found that their differential T cell counter worked as well as flow cytometry in counting CD4 and CD8 T cells, thus suggesting that it is a viable platform for tracking HIV infection.Unique to this device is the ability to monitor not only CD4 cells but also CD8 T cells, which can give a morecomplete picture of infection. By integrating all steps of POC detection sample preparation, purification, andanalysis and costing less per test than certain flow cytometers, it is possible that this device will be useful inresource-limited settings. Nevertheless, more testing on patients over time will be necessary to determine the device'sclinical utility.A complete electronic version of this article and other services, including high-resolution figures,can be found 0.full.htmlSupplementary Material can be found in the online version of this article /02/5.214.214ra170.DC1.htmlRelated Resources for this article can be found online nsmed/5/212/212ra163.full.htmlInformation about obtaining reprints of this article or about obtaining permission to reproduce thisarticle in whole or in part can be found Science Translational Medicine (print ISSN 1946-6234; online ISSN 1946-6242) is published weekly, except thelast week in December, by the American Association for the Advancement of Science, 1200 New York AvenueNW, Washington, DC 20005. Copyright 2013 by the American Association for the Advancement of Science; allrights reserved. The title Science Translational Medicine is a registered trademark of AAAS.Downloaded from stm.sciencemag.org on December 4, 2013The amount of CD4 and CD8 T cells in a blood sample can tell a doctor the status of the patient's immunesystem and HIV infection. Current methods of counting aren't always available in resource-poor settings, such asSub-Saharan Africa, so Watkins et al. created a microfluidic chip for these point-of-care (POC) settings, whichincorporates all steps of sample preparation and accurate T cell counting.
RESEARCH ARTICLEHIV DIAGNOSTICSMicrofluidic CD4 and CD8 T Lymphocyte Counters forPoint-of-Care HIV Diagnostics Using Whole BloodRoughly 33 million people worldwide are infected with HIV; disease burden is highest in resource-limited settings.One important diagnostic in HIV disease management is the absolute count of lymphocytes expressing the CD4 and CD8 receptors. The current diagnostic instruments and procedures require expensive equipment and trainedtechnicians. In response, we have developed microfluidic biochips that count CD4 and CD8 lymphocytes inwhole blood samples, without the need for off-chip sample preparation. The device is based on differentialelectrical counting and relies on five on-chip modules that, in sequence, chemically lyses erythrocytes, quencheslysis to preserve leukocytes, enumerates cells electrically, depletes the target cells (CD4 or CD8) with antibodies, andenumerates the remaining cells electrically. We demonstrate application of this chip using blood from healthy andHIV-infected subjects. Erythrocyte lysis and quenching durations were optimized to create pure leukocyte populations in less than 1 min. Target cell depletion was accomplished through shear stress–based immunocapture, usingantibody-coated microposts to increase the contact surface area and enhance depletion efficiency. With the differential electrical counting method, device-based CD4 and CD8 T cell counts closely matched control counts obtained from flow cytometry, over a dynamic range of 40 to 1000 cells/µl. By providing accurate cell counts in lessthan 20 min, from samples obtained from one drop of whole blood, this approach has the potential to be realizedas a handheld, battery-powered instrument that would deliver simple HIV diagnostics to patients anywhere in theworld, regardless of geography or socioeconomic status.INTRODUCTIONThe CD4 T cell count is a critical test in the management of HIV/AIDS and is widely used to determine when to initiate antiretroviraltherapy and to monitor the efficacy of treatment. Of the 33 millionpeople living with HIV globally, 7.5 million are eligible for treatmentbut may not be aware of their CD4 count (1). The CD4 count isusually expressed as the absolute number of CD4 T lymphocytesper microliter of blood. In addition, the ratio of CD4 cells to the totallymphocyte count (the CD4 percentage) and the ratio of CD4 T cellsto CD8 T cells (CD4/CD8) are particularly useful in monitoring thecourse of infection and give an overall assessment of the body’s immune strength. The CD4/CD8 ratio is also especially useful for HIVinfected infants, because there is a marked increase in CD8 T cellswhile the depletion of CD4 T cells due to HIV infection is not apparent in their early life (2–5). Flow cytometry is the standard diagnosticmethod for CD4 counting, but it requires centralized laboratory facilities and trained personnel—neither of which are routinely available inpoverty-stricken regions with limited resources. As a result, much effort has been placed in creating portable and inexpensive CD4 T cellcounters that would bring CD4 counts to the point of care (POC),eliminating socioeconomic or geographic barriers that currently prevent1Department of Electrical and Computer Engineering, University of Illinois at UrbanaChampaign, William L. Everett Laboratory, 1406 West Green Street, Urbana, IL 61801, USA.2Micro and Nanotechnology Laboratory, University of Illinois at Urbana-Champaign, 208North Wright Street, Urbana, IL 61801, USA. 3Department of Bioengineering, University ofIllinois at Urbana-Champaign, 1270 Digital Computer Laboratory, 1304 West SpringfieldAvenue, Urbana, IL 61801, USA. 4Champaign Urbana Public Health District, 201 WestKenyon Road, Champaign, IL 61820, USA. 5Daktari Diagnostics Inc., 85 Bolton Street,Cambridge, MA 02140, USA.*These authors contributed equally to this work.†Present address: Nabsys Inc., 60 Clifford Street, Providence, RI 02903, USA.‡Corresponding author. E-mail: rbashir@illinois.eduaccess to 69% of HIV-infected people in resource-limited settings likeSub-Saharan Africa (1).Many of the first-generation POC CD4 cell counting methods relyon microfluidic adaptations of flow cytometry, such as microfluidic image cytometers, which obtain counts by analyzing images of fluorescentlylabeled CD4 T cells (6–9), or miniaturized flow cytometry platforms(10–12) that may still require manual processing and blood volumeslarger than a finger stick. More portable methods, such as immunochromatographic strips that compare labeled CD4 cells to a reference strip(13), or a recently described sedimentation system that provides CD4counts based on the height of CD4-conjugated beads in a viewing window (13, 14), may not always provide sufficient accuracy to monitor progression of therapy. Novel approaches using scanning fluorescencemicroscopy and quantum dots or fluorescence-labeled antibodies (15) generally require off-chip sample processing and manual handling steps (3).Owing to simplicity and low cost, electrical detection methods holdmuch promise for POC cytometry. Much progress has been made inimpedance microcytometry with alternating current interrogation todetect differences in chemically modified cells (16–18) and cells infected with parasites (17), and to discriminate among cell types (19–22).Nevertheless, impedance microcytometry still has not proven to besensitive enough to distinguish among cells that have similar morphologies, such as lymphocyte subclasses and monocytes. Microparticle impedance labels have been shown to alter the high-frequency signatureof CD4 T cells enough to distinguish them from other lymphocytes,but require off-chip bead labeling steps (23). A technique that can beused at the POC, which provides single-cell counting accuracy formultiple cell subtypes and eliminates any manual steps, has not, toour knowledge, been reported.As one initial approach, we previously described a method forcounting cells based on differential measurements of cell counts usingwww.ScienceTranslationalMedicine.org4 December 2013Vol 5 Issue 214 214ra1701Downloaded from stm.sciencemag.org on December 4, 2013Nicholas N. Watkins,1,2*† Umer Hassan,1,2* Gregory Damhorst,2,3 HengKan Ni,1,2 Awais Vaid,4William Rodriguez,5 Rashid Bashir2,3‡
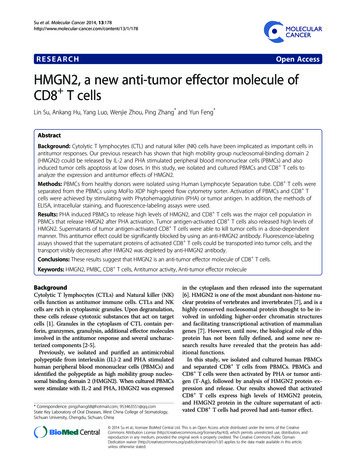
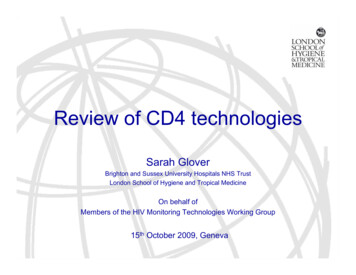
RESEARCH ARTICLEelectrical impedance (24). The cell counting is based on the Coultercounting principle (25). A cell is a nonconducting particle that willblock the electrical current being passed through a microfluidic pore.The cell passage through the pore will create a spike in impedancehaving an amplitude and width proportional to the size of the celland the cell’s translocation velocity through the pore, respectively. Thistechnique is used not only to obtain cell concentration but also to distinguish between different cell types in heterogeneous cell populationson the basis of their size and morphology, using a variety of appliedbias frequencies (26). A microfabricated electrical cytometer basedon the Coulter principle could provide accurate CD4 counts byAcounting cells individually. Such a system would have the advantagesof electrical CD4 cell counting methods, with accuracy that shouldbe higher than bulk electrical impedance methods described by ourgroup and others (27).Here, we report an integrated microfluidic differential counter design that incorporates on-chip sample preparation to provide accurateCD4 or CD8 T cell counts from 10 µl of undiluted, unprocessed human blood samples. From these counts, CD4/CD8 ratios were alsoobtained, which correlated well with control counts from a hospital’sflow cytometry facility for both healthy and HIV-infected blood samples. The lack of optics allows for a streamlined design that can beB(i)Downloaded from stm.sciencemag.org on December 4, 2013(ii)CBlood flow(v)(iii)Blood flow(iv)Exit counterEntrance counterCapture entcircuitSensingregionPreamplifier PBSQuenchingregionLysingregionEXIT ENTERQuenchingsolutionBiochipLC pumpLysingsolution-Fluidic sourcesCamera10.50 0.5 1100Signal amplitude (V)Signal amplitude (V)D204030506010.50 0.5 112.401412.401612.401812.402Time (s)Fig. 1. Principle of counting CD4 /CD8 T cells from whole bloodsamples. (A) Graphical schematic of the microfluidic chip design and sample processing. (i) Infusion of 10 µl of blood in the chip using a liquid chromatography (LC) pump. (ii) On-chip erythrocyte lysis. (iii) The entrancecounter gives the total counts of all leukocytes. (iv) The capture chamberimmobilized with CD4 or CD8 antibodies capture CD4 or CD8 T cells,respectively. (v) Exit counter counts the remaining cells. The difference incounts gives the number of captured T cells. (B) Image of the fabricatedchip with a planar capture chamber and entrance counter. (C) Two devicedesigns explored in this study. The antibody is attached to the surface inthe planar capture chamber (top). Antibody is attached to posts in thecapture chamber (bottom). (D) Graphical layout of the experimental andmeasurement setup. (E) Typical bipolar pulses obtained as the cells passthrough the electrodes. Inset shows the zoomed-in region of the signal.www.ScienceTranslationalMedicine.org4 December 2013Vol 5 Issue 214 214ra1702
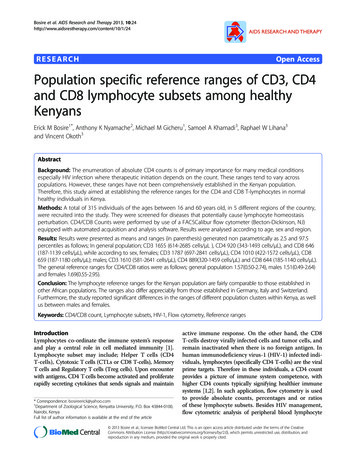
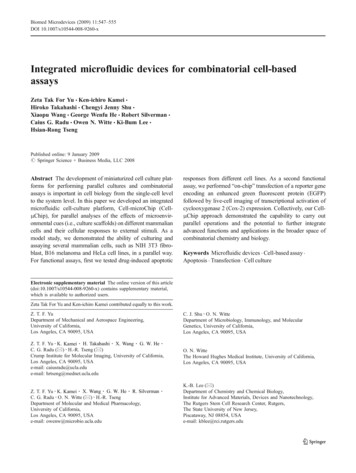
RESULTSErythrocyte lysis andquenching optimizationThe blood sample was focused by lysisbuffer sheaths (Fig. 2A). Erythrocytes wereruptured as they flowed through serpentine mixing channels (Fig. 2, A and B, andmovie S1). After completing the lysing andquenching processes, the recovered leukocytes could be seen flowing through thedevice (Fig. 2C). The recovered cells werecollected and tagged with CD45 fluores-Opacity ( Z @ 1.7 MHz / Z @ 303 kHz)Chip design and fabricationMicrofabrication methods were used to create a multilayer fluidic network in polydimethylsiloxane (PDMS) (fig. S1) to enable accuratespatiotemporal control of the injected blood cells and high-resolutionelectrical impedance sensing, all confined to a small chip footprint of3 cm 4 cm (Fig. 1, A and B). In the differential impedance cytometryapproach, erythrocyte lysis is necessary to ensure accurate CD4 T cellcounts, as the sheer number of erythrocytes ( 2000-fold greater thanleukocyte concentrations) would require large sample dilutions, thusincreasing analysis time and the probability of counting error. Figure1A shows a schematic of integrated electrical differential counting approach. The lysis module selectively ruptures the membranes of erythrocytes over several seconds through diffusive mixing of a lysis solutionof saponin and formic acid with the focused blood stream (22). Thequenching region introduces a buffer to halt lysis, preserving the leukocytes in a debris-free solution that is subsequently processed usingthe differential electrical counting principle (24).The 300-fl sense volume in the counting channel (15 µm tall 15 µmwide) ensured sufficient signal-to-noise event detection and reducedthe possibility of multiple cells being counted simultaneously as compared to the case when the sense volumeis much larger than the cell volume. TheAsense volume was about four orders ofmagnitude less than the average volumeper leukocyte found in patients with abnormally high leukocyte counts ( 12,000cells/µl). We explored both a planar capture chamber design and a design modified to include posts, to increase surfacearea, and to improve the cell capture efficiency (Fig. 1C). Figure 1D shows theexperimental setup for flowing the fluidduring the measurement. The three coplanar electrodes generated bipolar pulsesdue to the passage of each cell (Fig. 1E).0.4 D0.3A dual-frequency (303 kHz and 1.7 MHz)0.2electrical interrogation method was usedGranulocytes &Lymphocytes0.1monocytes 2 sto obtain information about the leukocyte000.511.52population by observing the cell membrane0.4capacitance in addition to their size (26).0.3cent antibody, and the sample was run through a flow cytometer toconfirm the presence of leukocytes. The optimal erythrocyte lysis duration is crucial because it needs to be long enough to rupture all theerythrocyte membranes, but short enough to preserve the remainingleukocytes. This window was found by locking the flow ratio betweenblood and lysis solution at 1:12 (v/v) and varying the total flow rate togive different resident times in the lysing region before lysis was haltedin the quenching region.Figure 2D illustrates how on-chip lysis duration affected the population distribution of the leukocytes. Each scatter plot compares thelow-frequency (303 kHz) impedance magnitude, Z , to the opacity—theratio of the high-frequency impedance at 1.7 MHz to the low-frequencyimpedance—for a particular lysis time. [The low-frequency impedancelevel is proportional to the size of the cell, whereas the electrical opacity gives information about the cell’s membrane, independent of cellsize (26, 28, 29).] As lysis time increased, a portion of the granulocyte/monocyte population transitioned from its original population (at 2 s—the optimal lysis time) to between the lymphocyte and granulocyte/monocyte populations (at 6 s) to its final position, which partiallyoverlaps the smaller-sized portion of the lymphocyte population (at 8to 10 s). Eventually, membranes became fully permeabilized, formingthe third population of cells at 10 s (Fig. 2D). At 303 kHz, the permeabilized cells cannot be represented as nonconducting particles anymore, as electrical conduction takes place through the cell, resulting insmaller impedance at 303 kHz (a 64% decrease between the granulocytes/monocyte population and the permeabilized population at 10 s). The0.2BC60000.4Permeabilized cellsGranulocytes & 6s0.1000.51 Z @ 303 kHz (V)1.510 s0.12000.511.52Chip total leukocyte count/µlrealized as a battery-powered, handheld unit that analyzes finger prickblood samples via one-time-use, disposable biochips.ER ² 0.96500040003000200010001000 Z @ 303 kHz (V)20003000400050006000Optical total leukocyte count /µlFig. 2. Effects of lysis time on erythrocytes and leukocytes. Real-time videos of these processes are inmovie S1. (A) Focusing of the blood sample by lysis buffer sheaths. (B) Rupturing of erythrocytes as theyflow through the serpentine mixing channels. (C) Leukocytes recovered after quenching the lysis process.Four of the eighteen leukocytes seen in this panel are encircled (in red). Scale bars, 400 mm (A to C). (D)Effects of lysis time on leukocytes. Low-frequency impedance (303 kHz) versus opacity ( Z at 1.7 MHz/ Z at 303 kHz) scatter plots showing the effect of lysing duration on the granulocyte/monocyte population. Thearrows illustrate the movement of the permeabilized population as the lysis duration increases from 2 to 10 s.(E) Electrical chip leukocyte counts versus the optical counts obtained from a Guava EasyCyte Plusflow cytometer in our laboratory (n 10 samples), with the solid line representing the best linear fit.www.ScienceTranslationalMedicine.org4 December 2013Vol 5 Issue 214 214ra1703Downloaded from stm.sciencemag.org on December 4, 2013RESEARCH ARTICLE
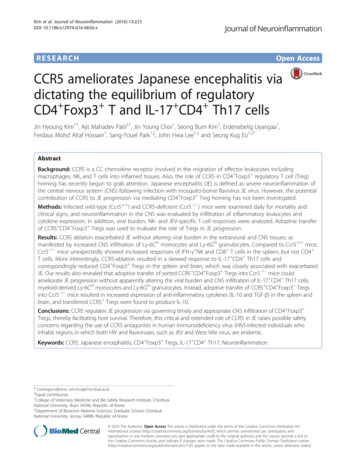
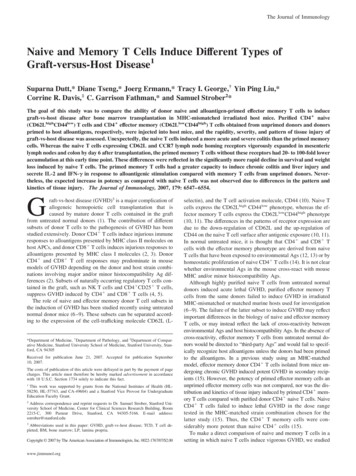
RESEARCH ARTICLEImpedanceAwere created from the exposure to formic acid (Fig. 3A) (27). Thesefragments still create an appreciable change in impedance when theypass through the counter, resulting in a baseline noise level that masksmany leukocytes. The low-frequency impedance pulse histograms inFig. 3A show that the erythrocyte debris dominated all counts at 7.5and 11.3 s. Complete erythrocyte lysis and debris removal occurredbetween 11.3 and 15.4 s, as the pulse signal-to-noise ratio of about21.8 was similar to that found by analyzing leukocyte populations thatwere prepared using off-chip techniques, which includes lysing, quenching, and washing twice via centrifuge. In addition, the baseline rootmean-square (RMS) noise of 28 mV at 15.4 s was similar to that foundfor the 48.3 s quench duration (Fig. 3A). However, the erythrocyte debrispeak at 15.4 s was completely removed at 48.3 s, which was confirmedvisually by micrographs (Fig. 3B); therefore, the minimum quenchingPulse height histogramsBDownloaded from stm.sciencemag.org on December 4, 20131.7-MHz impedance also decreased (42%) for similar reasons, but notto the same extent as at 303 kHz—which explains the 63% increase in thepermeabilized population’s opacity as the high-frequency impedancewould already be electrically interrogating the unpermeabilized cells’interiors. To ensure the accuracy of the electrical counting procedure,we compared the electrical counts with the counts from the flow cytometer (Fig. 2E). We calculated an R2 value of 0.96, validating the electrical counting measurement procedure.An optimal quenching solution composed of concentrated phosphatebuffered saline (PBS) and sodium bicarbonate kept the counting errorat 3% (n 20) (fig. S2). Experiments were also performed to find theminimum quench duration needed to create a debris-free leukocytesolution. Quenching times of 7.5 and 11.3 s did not allow the saponinto completely disassociate the erythrocyte fragments or “ghosts” that1.51.0397840.5Count7.5 s Z @ 303 kHz (V)530450.0–0.52652313261–1.00–1.50Time (ms)02000.30.60.91.21.5@ 303303 kHz(V) (V) Z Z @kHz11P25.FCSErythrocytedebris1.01817Count11.3 s Z @ 303 kHz (V)24221.50.57.5 s12110.0–0.5606–1.00–1.50Time (ms)02000.30.60.91.21.5@303303 kHz(V) (V) Z Z @kHz15P4S.FCS1.032Count0.5220.0–0.51148.3 s–1.00–1.50Time (ms)02000.30.60.91.21.5303 kHz(V) (V) Z Z @@303kHz48P3S.FCS1.540Count48.3 s Z @ 303 kHz (V)531.00.5270.0–0.513–1.00Time (ms)20040Single counterDual counter353025201510500–1.5CCell counting error (%)15.4 s Z @ 303 kHz (V)431.500.30.60.91.21.520303 kHz(V) (V) Z Z @@ 303kHzFig. 3. Effects of quenching time on erythrocyte debris. (A). Impedance signals and resultant pulse height histograms for various quenchingtimes of whole blood samples. Histograms were created by analyzing impedance data using a threshold level of 0.22 V. The impedance plots are200-ms snapshots of the electrical data analyzed to create their respective histograms. Impedance pulse plots were plotted at the same scale forpulse height and baseline noise comparison. (B) Micrographs of the304050Flow rate (µl/min)counting channel at different quenching times of whole blood samples.Erythrocyte debris is noticeable at 7.5 s and is absent at 48.3 s. Flow direction is from left to right in all micrographs. Arrows signify the positionof leukocytes along the channel. Scale bars, 200 µm. (C) Comparison ofcell counting error between the forward/reverse flow technique (singlecounter) with forward flow (dual counter). Data are averages SD (n 3 experiments).www.ScienceTranslationalMedicine.org4 December 2013Vol 5 Issue 214 214ra1704
RESEARCH ARTICLE0.110.15(dyn/cm2 )D0.18100Gran./mono.609080706050403020CD4 T cellsCD8 T cells10Gran./mono.50403020CD4– lymph.CD8– lymph.Downloaded from stm.sciencemag.org on December 4, 2013CD4 /CD8 T lymphocyte captureWe next calculated the efficiency of capture of CD4 (or CD8 T) lymphocytes using a chamber coated withCD4 (or CD8) antibodies (fig. S3). Whole-blood samples (10 µl) from healthy volunteers were analyzed onchip at varying capture chamber shear stresses to findthe optimal shear stress that would provide the highestcapture efficiency, resulting in the most accurate representative CD4 or CD8 T cell count. For a planarcapture chamber, the maximum capture efficiency of44.5% was obtained at 0.088 dyn/cm2 (fig. S4). At thisshear stress, the cells have ample interaction time withthe immobilized antibodies on the chamber floor. By contrast, at 0.333 dyn/cm2, the capture efficiency markedlydecreased.Adding pillars in the capture chamber could resultin a higher capture efficiency by increasing antibody-cellinteractions via larger chamber surface area. Four different designs with varying spacing of 8, 11, 14, and 17 µmbetween posts were explored. We found that the 11-µmpost spacing provided small enough spacing to give the 8-µm-diameter lymphocyte contact with the antibodycoated pillar surfaces, but large enough to prevent largerleukocytes from clogging the pathways (Fig. 4A).With a capture chamber footprint of 2.5 cm 1.4 cmand 40-µm-diameter posts with 11-µm spacing, thetotal number of posts in the capture chamber was about134,000. On-chip lysed and quenched blood sampleswere injected into the capture chamber (Fig. 4C) at flowrates ranging from 15 to 30 µl/min to find the optimalshear stress for maximum capture efficiency. This capture chamber design was simulated in COMSOL to getthe corresponding shear stress values at the surfaceof the pillars for the different flow rates (fig. S5). Twodimensional (2D) simulation for a flow rate of 20 µl/minresulted in a maximum shear stress of 0.11 dyn/cm2 atthe pillar walls (Fig. 4B) with maximum capture efficiencies of 98.3 and 90.1% for CD4 T cells and CD8 T cells, respectively (Fig. 4C) (movies S2 and S3).The capture of different cells in the capture chamber was investigated for both CD4 and CD8 T cell capture experiments (Fig. 4D). Ten percent of lymphocytesother than CD4 T cells and 52% of granulocytes/Shear stress (dyn/cm2 )0.08Capture e ciency (%) C100015EFOpacity ( Z @ 1.7 MHz / Z @ 303 kHz) BACapture efficiency (%)time should be about 48 s to ensure that all erythrocyte debris is removed, ensuring adequate separationfrom the electrical noise and that no debris is falselycounted as leukocytes.We also investigated the effects of lysing and quenching reagents on cell viability. For a single counter case,the flow is reversed for the exit count and cells wereexposed to reagents for varying times depending onflow rate (table S1). We observed a difference of almost 20% cell loss between forward and reverse counts.However, when two counters were used—one at the entrance and another at the exit of the capture chamber—exposure to the reagents was reduced to less than 1 min(table S1), which resulted in 1% cell loss (Fig. 3C).2025130234ell typesFlow rate (µl/min)EntranceLymphocytesGranulocytes & monocytesExit Z @ 303 kHz (V)Fig. 4. Pillars in the capture chamber result in high capture efficiency. (A) Scanning electron microscopy image of the posts with a height of 60 mm and a diameter of 40 mm. Thespacing between the posts is 11 mm. Scale bar, 40 mm. (B) 2D shear stress simulation at 20 ml/min in COMSOL. (C) Capture efficiency at different flow rates (shear stresses) for CD4 and CD8 T cells. Data are means SD (n 4). (D) Capture efficiencies of different cell types. (1)Lymphocytes other than CD4 T cells captured by CD4 antibodies. (2) Lymphocytes otherthan CD8 T cells captured by CD8 antibodies. (3) Granulocytes/monocytes captured by CD4 antibodies. (4) Granulocytes/monocytes captured by CD8 antibodies. Data are means SD (n 3).Within one experiment, the percent capture of different cell types is shown in fig.S6. (E) (Left) Falsecolored fluorescent image of CD4 T cells (green) captured in between posts in an anti-CD4capture chamber. (Right) False-colored fluorescent image of CD8 T cells (green) captured in between posts in an anti-CD8 capture chamber. Scale bars, 40 mm. (F) CD4 /CD8 T cell countingmethod. Opacity versus low-frequency impedance scatter plots of a CD4 T lymphocyte captureexperiment. A gating technique (rectangular boxes selected to include leukocytes) was used todetermine the total leukocyte (sum of lymphocyte and granulocyte/monocyte count) and lymphocyte counts for both entrance and exit counters. Populations outside the boxes are debris.www.ScienceTranslationalMedicine.org4 December 2013Vol 5 Issue 214 214ra1705
30R² 0.89P 0.000110002520800CD4 T cell countHematocrit60015Hematocrit (%)3510540040060080010001200Flow cytometry control CD4 T cell count (cells/µl)01400B4540100030800R² 0.94P 0.00012520600CD8 T cell Flow cytometry control CD8 T cell count (cells/µl)32.5R² 0.93P 0.000121.510.5000.511.52Flow cytometry control CD4/CD82.53Hematocrit (%)Chip CD8 T cell count (cells/µl)1200Chip - flow cytometry control (CD4 T cells/µl)1200Chip-flow cytometry control (CD4/CD8)45Chip- flow cytometry control (CD4 T cells/µl)CD4/CD8 ratio. Both counting methods were also compared byPearson analysis for CD4 and CD8 cells (Table 1). The repeatability ofthe CD4 and CD8 T cell count from the same blood sample was alsoperformed on healthy blood samples (fig. S8). For the same bloodsample, five repeats were performed for both CD4 and CD8, andthe coefficient of variation (CV) values were found to be 4.7 and 4.5%,respectively. Variation analysis for a CD4 count of a second sample(n 4) and a CD8 count for a third sample (n 3) resulted in CV valuesof 2.1 and 1.4%, respectively.Figure 6 shows the CD4 T cell count, CD8 T cell count, and theCD4/CD8 ratio for HIV-infected blood samples. Similar to healthysamples, hematocrit (%) shows no correlation between hematocrit level and any variability in the cell count. A positive bias of 12 cells/µlshows that, on average, the chip gave higher CD4 T cell counts thanthe flow cytometer (Fig. 6A). However, the CD8 counts resulted in a negative bias of 55 cells/ml (Fig. 6B). The chip counting error was found tobe 5.3% for CD4, 7.4% for CD8, and 11.9% for the CD4/CD8 ratio.Both counting methods were also compared by Pearson analysis forboth CD4 and CD8 cells, and the results are shown in Table 1. The40Chip CD4/CD8CD4 /CD8 T cell count comparisonto flow cytometryBlood samples from 18 healthy volunteers and 32 HIV-infected patients undergoing antiretroviral therapy were analyzedfor CD4 and CD8 T cell counts usingour electrical differential counting techniquewith on-chip sample preparation. Electrical differential counting was compared toflow cytometry for CD4 and CD8 T cellsand for the CD4/CD8 ratio from healthyvolunteers (Fig. 5) and HIV-infected subjects (Fig. 6). Hematocrit was also plottedalong with the cell counts, which showedno correlation between hematocrit leveland flow cytometer cell count (fig. S7).Bland-Altman analyses showed good agreement between the two counting methodsover the entire CD4 /CD8 T cell counting range for healthy samples (table S2).A positive bias of almost 24 cells/µl showedthat, on average, the biochip gave slightlyhigher CD4 counts than the hospital’s flowcytometer (Fig. 5A). CD8 count
The microfluidic differential T cell counter is based on the Coulter counter principle: In the device, cells are incorporates all steps of sample preparation and accurate T cell counting. Sub-Saharan Africa, so Watkins et al. created a microfluidic chip for these point-of-care (POC) settings, which