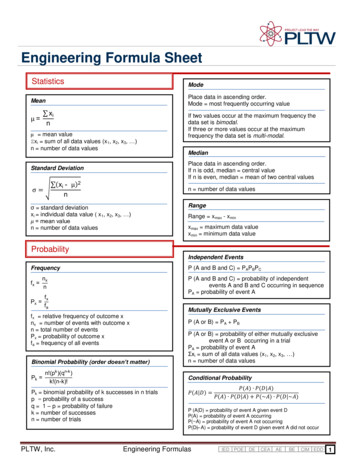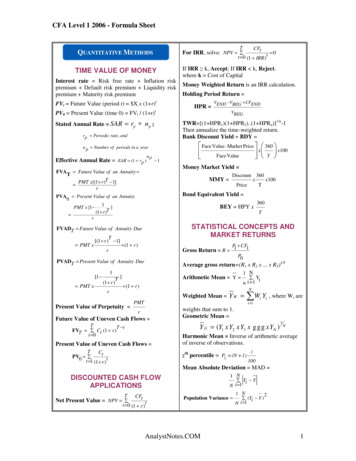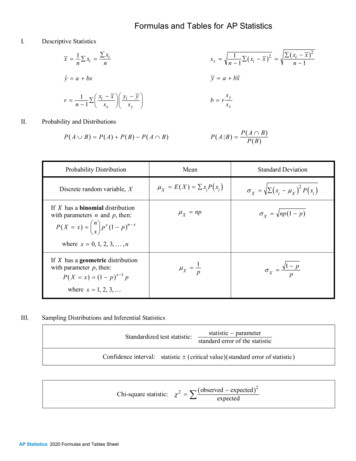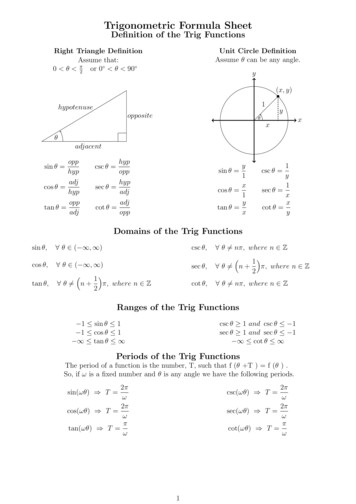
Transcription
Edge FIT - Formula Sheetwww.edgefit.co.zaJune 2019 CFA LI ExamSTUDY SESSION 1 - EthicsThe Code of EthicsMembers and candidates must: Act with integrity, competence, diligence, and respectand in an ethical manner with the public, clients,prospective clients, employers, employees, colleaguesin the investment profession, and other participantsin the global capital markets. Place the integrity of the investment profession andinterests of clients above their own personal interests. Use reasonable care and exercise independentprofessional judgment when conducting investmentanalysis, making investment recommendations,taking investment actions, and engaging in otherprofessional activities. Practice and encourage others to practice in aprofessional and ethical manner that will reflectcredit on themselves and the profession. Promote the integrity and viability of the globalcapital markets for the ultimate benefit of society. Maintain and improve their professional competenceand strive to maintain and improve the competenceof other investment professionals.The Standards of Professional ConductI. ProfessionalismA. Knowledge of the LawB. Independence and ObjectivityC. MisrepresentationD. MisconductII. Integrity of Capital MarketsA. Material Non-public InformationB. Market ManipulationIII. Duties to ClientsA. Loyalty, Prudence, and CareB. Fair DealingC. SuitabilityD. Performance PresentationE. Preservation of ConfidentialityIV. Duties to EmployersA. LoyaltyB. Additional Compensation ArrangementsC. Responsibility of SupervisorsV. Investment Analysis, Recommendations, & ActionsA. Diligence and Reasonable BasisB. Communication with Clients and Prospective ClientsC. Record RetentionVI. Conflicts of InterestA. Disclosure of ConflictsB. Priority of TransactionsC. Referral FeesVII. Responsibilities as a CFA Institute Member orCFA CandidateA. Conduct as Participants in CFA Institute ProgramsB. Reference to CFA Institute, the CFA Designation, andthe CFA Program Global Investment Performance Standards (GIPS )Nine major sections of the GIPS standards:0.1.2.3.4.5.6.7.8.Fundamentals of ComplianceInput DataCalculation MethodologyComposite ConstructionDisclosurePresentation and ReportingReal EstatePrivate EquityWrap/Separately Managed Account (SMA) Portfolio.STUDY SESSIONS 2 & 3 - Quantitative MethodsTime Value of Money1. Effective Annual RateEAR (1 periodic rate)m - 12. Future Value of a Single SumFVN PV(1 r)Where:FVN The future value of the amount investedPV The amount invested todayr The annual interest rate on the investmentN The period of the investmentE d g e F I T Fo r m u l a S h e e t-C FA L I19. MedianThe mid-point of all the observations; ie: The value thatstands in the middle of the data set5. Perpetuity - Present ValueMeasures of Dispersion4. AnnuitiesOrdinary Annuity: Cash flow at end-of-time periodAnnuity Due: Cash flow at the beginning-of-time periodAPV rWhere:A The Annuity; r The annual interest rate on the annuityDiscounted Cash Flow Applications6. Net Present Value (NPV)CF1CF2CFnNPV CF0 (1 k)1(1 k)2(1 k)nThus NPV n t 0CFt(1 k)t7. Internal Rate of Return (IRR)The discount rate that equates the present value of projects’cash inflows to the present value of its cash outflows8. Money-Weighted Rate of ReturnThis involves calculating the internal rate of return ofthe investment.9. Time Weighted ReturnTake the geometric mean of the annual returns to findthe annualized time-weighted rate of return.10. Bank Discount YieldD 360r F x tWhere:r The annualized yield on a bank discount basisD The dollar discount, which is Face value of bill (F) – its purchase priceF The face value of the billt The number of days remaining to maturity (actual).-20. ModeThe most frequent value of all the observations; ie: Thevalue that occurs most frquently in the data set.21. RangeLargest value – Smallest value22. MAD( - ) ( - ) ( n - )12MAD nWhere: Observation; Mean23. Varianceσ2 (population) ( 1 - μ )2 ( 2 - μ )2 ( 3 - μ )2N222( 1 - ) ( 2 - ) ( 3 - )S2 (sample) n -1Where: μ population mean; N population size sample mean; n sample size24. Standard Deviationσ σ2S S2where:σ population standard deviation; S sample standard deviation25. Chebyshev’s Inequality1k2k number of standard deviations from the mean.1-26. Coefficient of VariationCV Standard DeviationMean12. Holding Period YieldSR Portfolio mean return - Risk free ReturnStandard DeviationP1 - P0 D0HPY P0The measure of ‘peakedness’ of a distribution.11. Effective Annual Yield365EAY (1 HPY) t -1where: HPY Holding period yieldWhere:P0 The initial purchase price of the instrumentP1 The price received for the instrument at maturityD0 The cash distribution paid by the instrument(for example, dividends).13. Money Market Yield (also known as CD equivalent yield)rMM 360 x rBDWhere:360 - (t x rBD)rBD Bond discount yieldStatistical Concepts and Market ReturnsMeasures of Central Tendency14. Mean The average of a list of numbers Sum of the Data SetNumber of Observations Sum of the Data SetNumber of Observations n ( 1 1 )( n 1 )15. Arithmetic Mean (A-Mean)16. Geometric Mean (G-Mean)Where:Periodic rate stated annual rate divided by the numberof compounding periodsm number of compounding periods per annumN3. Present Value of a Single SumFVNPV (1 r)N-117. Harmonic Mean (H-Mean) N1 1 1 1 2 318. Weighted Mean (W-Mean) W1 1 W2 2 Wn n(W1 W2 Wn)27. Sharpe RatioMeasures of Kurtosis28. LeptokurticA peaked distribution is referred to as leptokurtic. This type ofdistribution has most of its values clustered closely around the mean.29. PlatykurticA flat or non-peaked distribution. This type of distribution is very flatand has large dispersion statistics.30. MesokurticThe middle-of-the-road distribution. A normal distribution with akurtosis measure of 3.Measures of SkewnessA distribution is skewed if it is not symmetrical.31. Positively Skewed (skewed to the right)A distribution with a long tail on the right hand side, as a result oflarge outliers relative to the rest of the data.32. Negatively Skewed (skewed to the left)A distribution with a long tail on the left hand side, as a result ofsmall outliers relative to the rest of the data.Probability Concepts33. Probability Rule: P(A)# of ways event A can happen# of items in sample space for event A34. Odds RuleOdds Probability1 – Probability35. Multiplication RuleP(AB) P(A B) P(B)ORThe ‘ ’ means given that.36. Addition RuleP(A or B) P(A) P(B) – P(AB)w w w. e d g e f i t . c o . z aP(AB) P(B A) P(A)Page 1
37. Complement Rule55. Confidence Interval(for an event A) P(A) P(Ac ) 1 (where Ac is the eventPoint estimate - Reliability factor * standard error38. Total Probability Rule (Multiplication rule Multiplication rule)Reliability factor comes from a z-tablethat is not A)cP(A) P(A B) P(A B )( means “intersection”)39. Independent RuleP(A and B) P(A) x P(B) Cov(Ri,Rj) E{[Ri - E(Ri)] [Rj – E(Rj)]}41. Correlationρi,j Cov(Ri,Rj)σ (Ri) σ (Rj)Standard error t σ/ s/Total quantity sold Price per unit P x Q72. Producer SurplusTotal revenue received from selling a given amount of agood – Total variable cost of producing that amountnLevel ofSignificance10%95%5%99%1%Two-Tails (Normal Distribution)AdjustedLevel ofSignificance0.102 0.050.052 0.0250.012 -table)1 - 0.025 0.9751.961 - 0.05 0.9501 - 0.005 0.995n!(n-r)!r!Where:45. Permutationn!(n-r)!Common Probability Distributions46. Tracking ErrorThe difference between the total return on a portfolio and thetotal return on a comparable portfolio used as a benchmark.47. Continuous Uniform DistributionA special type of continuous distribution, defined by theprobability density function:1f(x) b-a74. Total Surplus48. Z-Score61. Pooled Variance( 1 - 2) - (u1 - u2 )62. Test Statistic for a Test of Mean Differences(normally distributed populations, unknown population variances) Z (observation – population mean) / populationstandard deviationZ (X - µ) / σ49. Shortfall Risk, Calculate the Safety-First Ratio(E [Rp] - RLσpWhere:E[Rp] Portfolio returnRL Minimum return the investor will be satisfied withσp Standard deviation of the portfolio50. Discretely Compounded Rate of ReturnS1R S0Where:S1 closing price of the asset; S0 beginning price of the asset51. Continuously Compounded Rate of Return( SS )52. Sampling Error - μ53. Standard Error of the Sample Meanσ n54. Students T-Distributionσμ (Z-Score X n ) S2χ2 (n-1)* σ 20Technical Analysis65. Relative-Strength Ratio OR Stock PriceValue of the Series (eg: S&P 500)Price of AssetPrice of Benchmark Asset66. Short Sales by Specialists RatioSpecialist’s Short SalesTotal Short Sales on the NYSE67. Price Target for the:Sampling and EstimationSample mean – population mean S21S2264. Chi Square Test 10where: sample mean difference63. F - TestF Head and Shoulders Neckline – (Head – Neckline)Inverse Head and Shoulders Neckline (Neckline– Head)68. Put/Call Ratio Number of PutsNumber of CallsTotal value – Total variable costConsumer surplus Producer surplus76. Own-Price Elasticity of Demand:% Δ Quantity DemandedE dpx d ΔQ xdQx Δ PxPx( ΔΔ QP ) (dxxΔ PxΔ Q dx77. Income Elasticity of DemandE dPI d%ΔQx% Δ Px % Δ Price)%Δ Quantity Demanded% Δ IncomeQ1 - Q2Q1 Q2 78. Cross-Price Elasticitysp2 sp2n1 n2t (s - n )Consumer surplus Producer surplus75. Society WelfareSample statistic - Population value of the statistic under H0Standard error of the sample statistic( - μ o)02.576 Type I error - Rejecting the null hypothesis when it isin fact true. The probability of this error is denoted α Type II error – Not rejecting the null hypothesiswhen it is false. The probability of this error isdenoted β. The power of the test – The probability of correctlyrejecting the null hypothesis. It is denoted 1-β and isthe converse of the probability of a type II error.t 0**where supply curve intersects y-axis73. Total Surplus60. Type I and a Type II Errorsn total no. of objects r no. of objects selectedArea (for calculating Producer Surplus) ½ (Base Height) ½ {(Q ) (P – intercept point on y-axis**)}1.64559. The Test Statistic Δ in PriceΔ in Quantity Supply71. Total RevenueHypothesis Testing44. Combination Formula (Binomial Formula)Δ in PriceΔ in Quantity Demanded - μ 69. Slope of the Demand Curve70. Slope of the Supply Curven90%x P(prior probability of event)n!n1! n2! .nk!ln(1 r) lnn57. t - Ratio43. Multinomial Formula (General formula forlabeling problem)SFRatio Topics in Demand and Supply Analysis - μConfidenceInterval(new information event)P (new information)Pr σ (known variance) ORns (unknown variance) 56. z - RatioP (event new information) nWhere:58. Using the Z - Table42. Bayes TheoremCr ) z 40. Covariancen (Z-Score X σnSTUDY SESSIONS 4 & 5 - EconomicsP1 - P2P1 P2d%Δ Q x%ΔIdE dPy %Δ Q x%Δ PyMU Δ Total UtilityΔ Quantity Consumed79. Marginal Utility80. Equation of Budget Constraint Line(Px Q x ) (Py Q y)81. Slope of Budget Constraint LineΔQyΔQx PxPy82. Marginal Rate of SubstitutionΔQyΔQxMarginal Utility of Good Y Marginal Utility of Good X83. Economic Profit Total Revenue – Explicit Costs – Implicit CostsOR Accounting Profit – Implicit CostsOR Total Revenue – Total Economic Costs84. Economic CostsExplicit costs Implicit costs85. Normal ProfitAccounting Profit – Economic Profit86. Accounting ProfitEconomic Profit Normal Profit87. Economic Rent(New “Higher” Price after in Demand – Previous Pricebefore in Demand) Qs before in DemandEdge FIT Formula Sheet - CFA LI - www.edgefit.co.za - pg 2
88. Average Revenue106. Gross Domestic ProductTotal RevenueAR OutputExpenditure ApproachTotal Spending C I G (X – M) ε89. Marginal RevenueΔ Total RevenueMR Δ OutputMR AR P Demand (in perfect competition)MR Px (11 - Price Elasticityof Demand)90. Total Cost and Total Variable CostTC Total Fixed Costs Total Variable CostTVC Variable Cost per unit Quantity Produced91. Average Total CostTotal CostOutputATC 92. Marginal CostΔ Output107. Investment93. Marginal Variable Cost(G – T) – (S – I) – (X –M)Investment Y – C – GSavings Y – C – GSavings Private Saving Public Saving (Y – C – T) (T – G)Δ Total Variable CostΔ Output94. Profit-Maximizing RuleWhere:MC P MRG Government spending; T Taxes(G - T) Financing government deficitsS Savings; I Investments; X Exports; M Imports;( X - M) Net Exports95. Average ProductMP Total ProductQuantity of Labor108. National Income96. Marginal ProductMP Δ Total ProductΔ Quanity97. Increasing Profit Profit can be increased by increasing output when MR MC Profit can be increased by decreasing output when MR MC98. Marginal Product of LaborMPL Δ OutputΔ Labor99. Value of Marginal Product (VMP)VMP MP x P100. Break-even PriceP ATC à Output level where Price Average Revenue Marginal Revenue Average Total Cost à where, TotalRevenue Total Cost.101. Concentration RatioCR Sum of Sales of the Largest 10 FirmsTotal Market Sales102. Herfindahl-Hirshman IndexHHI Sum of the squares of the market shares of thetop N companies in an industryAggregate Output, Prices, and Economic Growth103. Nominal GDPtPrices in year t Quantity produced in year t104. Real GDPtPrices in the base year Quantity produced in year t105. Implicit Price Deflator for GDP or GDP Deflatorand Real GDPGDP deflator Nominal GDP 100Real GDPReal GDP current year Nominal GDP current year Real GDP Nominal GDP(GDP Deflator100GNP GNI indirect business taxes depreciationGDP GNP net income of foreignersGDP National income Capital consumption allowance Statistical discrepancyΔ Total CostMVC Where:C Consumer spending on goods and servicesI Investments; G Government spendingX Exports; M Imports; ( X - M) Net Exportsε Statistical DiscrepancyResource Cost -
Edge FIT Formula Sheet - CFA LI - www.edgefit.co.za Page 1. Topics in Demand and Supply Analysis 69. Slope of the Demand Curve 70. Slope of the Supply Curve 71. Total Revenue Total quantity sold Price per unit P x Q 72. Producer Surplus Total revenue received from selling a given amount of a good – Total variable cost of producing that amount Area (for calculating Producer .

