Transcription
micromachinesArticleDesign and Fabrication of a Microfluidic ViscometerBased on Electrofluidic CircuitsBo-Bi Tzeng and Yung-Shin Sun *IDDepartment of Physics, Fu-Jen Catholic University, New Taipei City 24205, Taiwan; 403166019@mail.fju.edu.tw* Correspondence: 089957@mail.fju.edu.tw; Tel.: 886-2-29052585Received: 4 July 2018; Accepted: 26 July 2018; Published: 27 July 2018 Abstract: This paper reports a microfluidic viscometer based on electrofluidic circuits for measuringviscosities of liquid samples. The developed micro-device consists of a polydimethylsiloxane (PDMS)layer for electrofluidic circuits, a thin PDMS membrane, another PDMS layer for sample pretreatment,and a glass substrate. As the sample flows inside the microfluidic channel, its viscosity causesflow resistance and a pressure drop along this channel. This pressure drop, in turn, generates ahydraulic pressure which deforms the PDMS membrane, causing changes in the cross-sectionalarea and the electrical resistance of the electrofluidic resistor. This small resistance change is thenmeasured via the electrofluidic Wheatstone bridge to relate the measured voltage difference tothe fluidic viscosity. The performance of this viscometer was first tested by flowing nitrogen gaswith controllable pressures into the device. The relationship between measured voltage differenceand input gas pressure was analyzed to be linear in the pressure range of 0–15 psi. Another testusing pure water indicated good linearity between measured voltage difference and flow rate in therate range of 20–100 µL/min. Viscosities of glycerol/water solutions with volume/volume (v/v)concentrations ranging from 0 to 30% were measured, and these values were close to those obtainedusing commercially available viscometers. In addition, the sample-pretreatment layer can be used tomix and/or dilute liquid samples to desired concentrations. Therefore, this microfluidic device haspotential for measurements of fluidic viscosity in a fast, accurate, and high-throughput manner.Keywords: viscometer; microfluidics; electrofluidic circuit1. IntroductionViscosity is an important fluidic property that occurs between two surfaces of that fluid moving atdifferent velocities. It is simply the frictional force among the molecules of that fluid. Measurements ofthe viscosity of biological samples such as blood, tissue fluids, and urine can be applied to diseasediagnosis and prognosis. For example, estimates of urine viscosity provide a better characterizationof the biological system and should result in more accurate modeling of bladder hyperthermiatreatments [1]. The viscosity of urine, a Newtonian fluid [1–3], was shown to depend on thetemperature and urinary constituents, and its value increased with the appearance proteinuria [1].Maple syrup urine disease (MSUD), a metabolic disorder affecting the process of certain amino acids,is characterized by low-viscosity urine [4]. Urine viscosity was also used to evaluate homeostasis inheart surgery patients in the early postoperative period [5].Conventional viscometers such as U-tube viscometers, falling ball viscometers, vibrationalviscometers, rotational viscometers, electromagnetically spinning sphere (EMS) viscometers,and Stabinger ViscometersTM are routinely used in laboratories. A vibrational viscometer measures thedamping of an oscillating resonator immersed in a fluid, and this damping increases with increasingfluidic viscosity [6]. The Viscolite from Hydramotion (York, UK) is a commercially available vibrationalviscometer with a detection range of 0–10,000 cP and an accuracy of 0.1 cP. A rotational viscometerMicromachines 2018, 9, 375; hines
Micromachines 2018, 9, 3752 of 12works by measuring the torque needed to turn an object in a fluid, and this torque is a function ofthe fluidic viscosity. The Alpha series rotational viscometers from Fungilab (Barcelona, Spain) havea detection range of 1–2,000,000 cP and an accuracy of 10 cP. In an EMS viscometer, a metal sphererevolves under the influence of an external magnetic field, and its rotational speed depends on theviscosity of the fluid it is immersed in [7,8]. The EMS-1000 from Kyoto Electronics Manufacturing(Kyoto, Japan) measures viscosities from 0.1 to 100,000 cP. The Stabinger ViscometerTM (Anton Paar,Graz, Austria), a modification of the classic Couette-type rotational viscometer, determines kinematicviscosities with a wide measuring range. The Stabinger ViscometeTM SVMTM 3000 measures viscositiesfrom 0.2 to 20,000 cP and is applied to measurements of various samples [9–11].All abovementioned, conventional viscometers have a few drawbacks, including usually largesample consumption, inability for real-time measurements, and expensive instruments. For example,the minimum volumes required in Viscolite and Alpha series are 100 mL and 10 mL, respectively.As a result, a variety of microfluidics-based viscometers were developed to overcome these issues.Micro-fabricated devices composed of micro-channels and fluidic components provide a miniatureplatform where the consumption of samples is significantly reduced and the micro-environment(such as temperature, pH value, and chemical concentration) is well controlled. With advances intechniques of micro-fabrication from glass and silicon substrates to polydimethylsiloxane (PDMS)and polymethylmethacrylate (PMMA) materials, the cost and time for fabricating microfluidic chipsare greatly reduced, leading to more diverse applications of these devices. Early in 2005, Srivastavaand Burns reported a micro-fabricated, glass-made nanoliter capillary viscometer for quick, easy,and inexpensive measurements of fluidic viscosities [12]. Based on capillary pressure-driven flowinside microfluidic channels, viscosities ranging from 1 to 5 cP were measured [12]. In the followingyear, the same group fabricated a self-calibrating, micro-fabricated capillary viscometer for analyzingnon-Newtonian fluids [13]. This glass-made device monitored the capillary pressure-driven movementof the fluid sample whose velocity and shear rate varied with time. Viscosities in the range of 1–600 cPwere measured with shear rates varying from 5 to 1000 s 1 [13]. Zheng et al. developed a PDMSviscometer by utilizing the high solubility and permeability of air in PDMS to generate Poiseuille flow inthe degassed PDMS microfluidic device [14]. The viscosity of the fluid was obtained by measuring thedistance the sample traveled and its flow velocity in the PDMS channel. This microfluidic viscometerwas able to measure viscosities of Newtonian fluids ranging from 1 to 80 cP [14]. Kang and Yangproposed a microfluidic viscometer equipped with a fluid temperature controller for measuring theviscosities of both Newtonian and non-Newtonian fluids [15]. Solomon and Vanapalli demonstratedthe first high-throughput microfluidic viscometer for simultaneously measuring the viscosities ofmultiple samples [16]. Other microfluidic viscometers based on diffusion, surface tension, velocimetry,flow rate sensing, and pressure sensing were also reported [17]. The state-of-the-art techniques indesigning and fabricating microfluidic rheometers and viscometers are detailed in References [18–23].In this study, a microfluidic viscometer based on electrofluidic circuits was developed.This microfluidic device consists of a PDMS layer for electrofluidic circuits, a thin PDMS membrane,another PDMS layer for sample pretreatment, and a glass substrate. The ionic liquid-based electrofluidiccircuit can monitor pressure changes by measuring the corresponding resistance changes in the circuit;the working principles are detailed in References [18,24–26]. The idea of turning this pressure sensorinto a viscometer is as follows: inside a microfluidic channel, the flow resistance increases withincreasing fluidic viscosity, and this increasing flow resistance, in turn, increases the pressure dropalong this channel. This pressure drop generates a hydraulic pressure at the pressure-sensing area,causing changes in the cross-sectional area and the electrical resistance of the electrofluidic circuit.This resistance change is then measured by means of the electrofluidic Wheatstone bridge. The presentmicrofluidic viscometer offers some advantages as compared to that shown in the article publishedearlier this year [18]. Firstly, the sample-pretreatment layer can be used to mix and/or dilute liquidsamples. By redesigning this device to have multiple samples of different concentrations [27–29], witheach corresponding to one electrofluidic sensing region, it can serve as a platform for measurements of
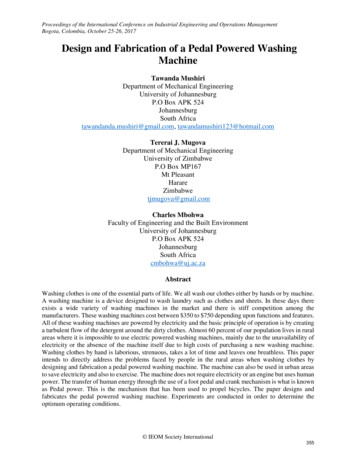
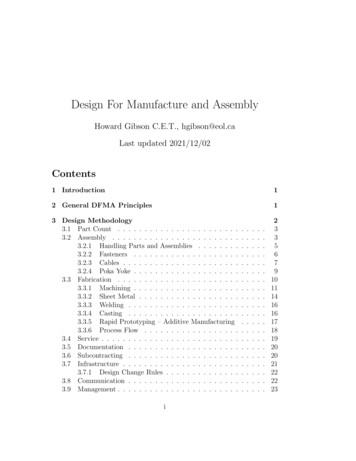
Micromachines 2018, 9, 3753 of 12fluidic viscosity in a fast, accurate, and high-throughput manner. Secondly, cells can be cultured insidethis microfluidic chip for monitoring their responses to fluidic shear stress and viscosity. Thirdly, thismicrofluidic viscometer is capable of measuring low-viscosity liquids: a glycerol solution of 2.5%(v/v in water) was measured to have a viscosity of 0.94 cP (the viscosity of water is around 0.89 cP at25 C).2. Materials and Methods2.1. Design and Fabrication of the Microfluidic ChipThe layer-by-layer scheme of the microfluidic chip is shown in Figure 1a. The topmost layer hadfour electrofluidic resistors which constructed the Wheatstone bridge for pressure sensing (see the redpart in Figure 1b). The third layer had two symmetric parts serving for sample pretreatment (see thegreen part in Figure 1b), with each part consisting of two inlets and a continuous zigzag microchannelfor mixing and diluting liquid samples. This zigzag structure is very commonly used in microfluidicsfor mixing and diluting purposes [27–32]. Compared to a straight microchannel, the total length ofmixing is significantly increased in a zigzag microchannel. Moreover, by hitting the wall frequently,the mixing process is more efficient in a zigzag microchannel. These two layers were fabricated usingthe standard soft-lithography technique including photoresist SU-8 (2025, MicroChem, Westborough,MA, USA) molding and elastomeric material PDMS (Sylgard 184, Dow Corning, Midland, MI, USA)curing. The heights and widths of the fluidic channels (in both the electrofluidic circuit layer and thefluidic layer), verified by α-step (Dektak XT, Bruker, Billerica, MI, USA), were about 50 and 200 µm,respectively. As illustrated in Figure 1b, on the sample pretreatment layer, a pressure transductionhole (diameter 3.5 mm) was punched through and aligned with one of the four resistors on theelectrofluidic circuit layer. The PDMS membrane with a thickness of 100 µm was fabricated by spinninga PDMS precursor (1:10 w/w of curing agent to base) onto a silicon wafer at 750 rpm for 40 s, bakingthe membrane-coated wafer inside a vacuum oven at 60 C for 3 h, and peeling the membrane off thewafer. The electrofluidic circuit layer was punched using a 1.5-mm-diameter biopsy punch for ionicliquid injection and resistance measurement (see the four red circles in Figure 1b). It was permanentlybonded to the PDMS membrane via oxygen plasma surface treatment at 18 W for 40 s under an O2pressure of 600 mTorr (PDC-32G, Harrick Plasma, Ithaca, NY, USA). The sample-pretreatment layer,punched for gas/liquid sample injection (see the five green circles in Figure 1b), was then bonded tothe bottom of the PDMS membrane via the same plasma treatment. Finally, the whole assembly wasoxygen plasma-boned to a 5 cm 5 cm glass substrate. A picture of the integrated microfluidic deviceis shown in Figure 1c.
Micromachines 2018, 9, 375Micromachines 2018, 9, x FOR PEER REVIEW4 of 124 of 12Figure1. (a)1. The(a) layer-by-layerThe layer-by-layerof the chipmicrofluidic(sideview). (b) TheFigurescheme ofschemethe microfluidic(side view).chip(b) Thesample-pretreatmentsample-pretreatmentlayer (green)andthe(red)electrofluidiccircuit layer(red)view).of the(c)microfluidiclayer(green) and the electrofluidiccircuitlayerof the microfluidicchip (topA picture of chipthe(topview ts was studied by flowing pureThe performance of this device in liquid pressure measurements was studied by flowing purewaterintointothe wof waterthe waterwatermicrofluidicchanneltotodeformdeform thethe PDMSTheflowraterateof thewas µL/minwithanincrementof10µL/mincontrolled via syringe pumps and increased from 10 to 50 μL/min with an increment of 10 μL/minand anda iscorrespondedtoflowa total waiting time of 10 min. Since there were two inlets, this corresponded to flow rates ofratesof 20–100withananincrementincrementµL/mininsidethe min withof of20 20μL/mininsidethe microfluidicchannel.The outletthe ofmicrofluidic channelso sothethemeasuredvoltagedifferencewas wasthe tedthe pressuredrop alongthe channelthe hydraulicat the pressurerelatedto thetopressuredrop alongthe channeland theandhydraulicpressurepressureat the thecorrespondingΔVM plotted against time. As indicated, thehole. Figure 5a shows the corresponding VM plotted against time. As indicated, the respondingwas thus,about the3 min;thus,the thedatalastfrom5 minwerefortakenthe purposeoftimerespondingwas abouttime3 min;datafrom5 theminlastweretakenthe forpurposeof statistics.statistics. Ripples in the voltage were
The Stabinger ViscometeTM SVMTM 3000 measures viscosities All abovementioned, conventional viscometers have a few drawbacks, including usually large . viscometer by utilizing the high solubility and permeability of air in PDMS to generate Poiseuille flow in the degassed PDMS microfluidic device [14]. The viscosity of the fluid was obtained .