Transcription
Yu et al. BMC Cancer (2016) 16:397DOI 10.1186/s12885-016-2473-0RESEARCH ARTICLEOpen AccessINFα-2b inhibitory effects on CD4 CD25 FOXP3 regulatory T cells in the tumormicroenvironment of C57BL/6 J mice withmelanoma xenograftsYang Yu1†, Run Huang2†, Xiangyun Zong2* , Xiangming He1 and Wenju Mo1AbstractBackground: Regulatory T cells (Tregs), particularly the CD4 CD25 Foxp3 Tregs, down regulate immunity andpromote tumor cell growth by directly suppressing CD8 and CD4 T cells. Alternatively they can promote tumorgrowth by generating interleukin-10 (IL-10) and transforming growth factor β (TGFβ) in situ, which help tumor cellsto evade the immune system.Methods: In vivo tumor models were prepared via subcutaneous injection with a suspension of B16 melanomacells into the left upper flank of C57BL/6 J mice. The mice were randomized into five groups: radiotherapy (RT),chemotherapy (CT), radiochemotherapy (RCT), Inteferon α (INFα) groups, and a control group. Flow cytometry wasused to determine the Tregs levels in the spleen and peripheral blood, and immunohistochemistry was performedto determine the expression levels of TGFβ and IL-10 in the tumor microenvironment.Results: Tumor weight was significantly reduced in the CT or RCT groups (40.91 % and 41.83 %, respectively), whilethe reduction in tumor weight was relatively lower for the RT and IFNα groups (15.10 % and 13.15 %, respectively).The flow cytometry results showed that the ratios of CD4 CD25 Foxp3 Tregs to lymphocytes and CD4 cells in thespleen and in peripheral blood were significantly decreased after treatment with IFNα (P 0.05). Expression of TGFβand IL-10 in the tumor microenvironment in the CT and RT groups was higher compared with the control group(P 0.01), while the expression of TGFβ and IL-10 in the INFα group was not significantly different (P 0.05).Conclusions: The results show that INFα-2b inhibits cancer cell immune evasion by decreasing the levels ofCD4 CD25 Foxp3 Tregs and suppressing the expression of TGFβ and IL-10 in the tumor microenvironment.Keywords: Melanoma, Tumor microenvironment, CD4 CD25 Foxp3 Tregs, Chemotherapy, ImmunotherapyBackgroundAlthough melanoma is not a common tumor worldwide[1], it is the most lethal form of all skin cancers. In recent years, its morbidity has increased more than anyother solid tumor. In 2012, 232,000 new melanomacases were reported throughout the world, accountingfor 2 % of all tumors. It was reported that there were76,100 new melanoma cases, and 9719 deaths, in the* Correspondence: tigerzong@msn.com†Equal contributors2Department of Breast Surgery, Shanghai Jiao Tong University Affiliated SixthPeople’s Hospital, 600 Yishan Road, Shanghai 200233, ChinaFull list of author information is available at the end of the articleUSA in 2014, accounting for 4.6 % and 1.7 % of all tumors, respectively [2]. Other than classical therapies,such as surgery, radiotherapy and chemotherapy, immunotherapy is playing an important role in the treatment of melanoma. However, melanomas have beenfound to evade the immune system, thus making thema refractory type of cancer.Regulatory T cells (Tregs), particularly CD4 CD25 Foxp3 Tregs, down regulate immunity and promotetumor cell growth [3]. Tregs can be recruited to themicroenvironment of melanoma because of the chemotaxis of chemokine (C-C Motif) Ligand 22 (CCL22) that isproduced by tumor cells [4]. As a result, infiltrated Tregs 2016 The Author(s). Open Access This article is distributed under the terms of the Creative Commons Attribution 4.0International License (http://creativecommons.org/licenses/by/4.0/), which permits unrestricted use, distribution, andreproduction in any medium, provided you give appropriate credit to the original author(s) and the source, provide a link tothe Creative Commons license, and indicate if changes were made. The Creative Commons Public Domain Dedication o/1.0/) applies to the data made available in this article, unless otherwise stated.
Yu et al. BMC Cancer (2016) 16:397can exert suppressive effects on effector CD8 and CD4 T cells either through direct cell-to-cell contact [5, 6] orindirectly by generating interleukin-10 (IL-10) and transforming growth factor β (TGFβ) in situ [7–9], which helpstumor cells to evade the immune system. Moreover, it hasbeen reported that Tregs can be directly induced by melanoma cells, thus further suppressing the immune systemin the tumor microenvironment [10, 11].TGFβ, which is a secreting protein that modulates cellproliferation and differentiation, has dual effects in tumorinitiation and progression. In the early stage of tumorigenesis, TGFβ is a tumor suppressor, whereas in advanced tumors, TGFβ promotes tumor angiogenesis, invasion,metastasis, and immunosuppression [12]. Interleukin-10,also known as human cytokine synthesis inhibitory factor,is an anti-inflammatory cytokine which plays a critical rolein preventing an immune response and autoimmune pathologies [13]. Nevertheless, in tumorgenesis, IL-10 inhibitsthe expression of antigen presenting cells (APCs) and further prevents the dendritic cell (DC)-mediated transformation of T cells into cytotoxic T cells (CTLs). It also affectsCD8 T cells, which further promotes tumor initiationand progression [14]. Both TGFβ and IL-10 in the tumormicroenvironment can be excreted by Tregs and tumorcells, thus mediating the immunosuppressive effect ofTregs [9]. As such, TGFβ and IL-10 can be regarded astwo significant immunosuppressors in the melanomamicroenvironment. However, the role of these two cytokines in the tumor microenvironment still remains elusivewhen challenged to differential clinical therapies.As different treatment strategies have different effects on the tumor microenvironment, it is of interestto investigate their effects and relevant mechanisms.As such, in this study C57BL/6 J mice bearing melanoma were used as tumor models and treated witheither radiotherapy (RT), chemotherapy (CT), radiochemotherapy (RCT), or intravenously administeredInteferon α-2b (IFNα-2b). After treatment, the levelof Tregs in the spleen and in peripheral blood, andthe levels of TGFβ and IL-10 in the tumor microenvironment were determined.MethodsMice model construction and group interventionThirty female C57BL/6 J mice were purchased fromShanghai Slack laboratory Animal Co. Ltd (Shanghai,China). Mice were 6-weeks old at the start of the experiments, weighing 20 2 g. B16 melanoma cells were harvested in their logarithmic growth phase and were madeinto a single cell suspension (2.5 107 cells/mL). Eachmouse was then subcutaneously injected with 0.2 mL ofthe cell suspension (about 5 106 cells) in their leftupper flank.Page 2 of 9Thirty successfully B16 melanoma inoculated C57BL/6 J mice were randomly divided into five groups: RT,CT, RCT, INFα groups, and a control group, with sixmice per group. For each group, treatment was started7 days after inoculation. Mice in the RT group weregiven a single conformal treatment of 500 cGy of radiation (source skin distance (SSD) 100 cm, using a5 cm 5 cm module body filled lead-antimony alloy,and 1.5-cm-thick physical tissue equivalent compensation filmed on the surface of the irradiated skin). Tailvein injection and intraperitoneal injection (i.p.) of normal saline (NS, Zhejiang Shapuaisi PharmaceuticalLimited, Pinghu, China) were used as the control intervention for the IFNα and chemotherapy groups, respectively [15, 16]. For the CT group, each animal wasintraperitoneally injected with 40 mg/kg dacarbazine(DTIC, Nanjing Pharmaceutical Factory Co, Ltd, China)daily from days 9 to 15, and NS was injected into thetail vein as a control for IFNα. Mice in the IFNα groupwere administrated with INFα-2b (10,000 U per mouse,Schering-Plough Corporation, USA) via tail vein injection on days 7, 9, 11, 13 and 15, and NS was injectedi.p. as an alternative control for DTIC [17]. For theRCT group, the mice were given identical treatmentssynchronously with the RT and CT groups, with tail veininjection of NS as a control treatment. For the controlgroup of mice, NS was administered via i.p. and tail veininjection simultaneously with the CT and INFα groups.On day 16, all mice had completed their treatmentsand were sacrificed. Postocular blood (1 mL) was collected before the animals were euthanized and the samples treated with 3.8 % sodium citrate to preventcoagulation. The spleens were also excised and subcutaneous tumor xenografts were excised completely for further examination.Cell suspension preparation, antibody labeling and flowcytometryC57BL/6 J mice were euthanized by the cervical dislocation method. Their spleens were excised on a cleanbench and ground on 200-mesh nylon before the filtrate was collected and centrifuged at 1.5 103 rpm for5 min. The supernatant was discarded and the cellswere resuspended in phosphate buffered saline (PBS)for further experiments.Separating medium (2 mL Percoll, Santa Cruze,Shanghai, China) was added to a centrifuge tube. Previously collected blood (2 mL) was then added to theseparating medium, and the samples centrifuged for15 min at 3 103 rpm. The lymphocytes were then separated and transferred to another centrifuge tube andspun for 5 min at 1.5 103 rpm, before they were resuspended with PBS for further experiments.
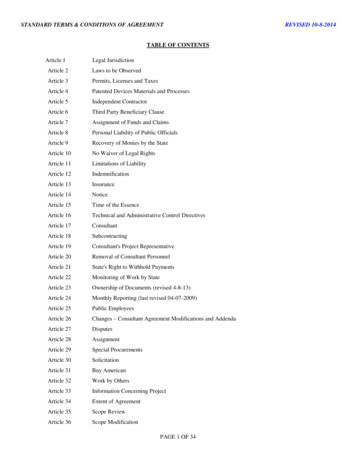
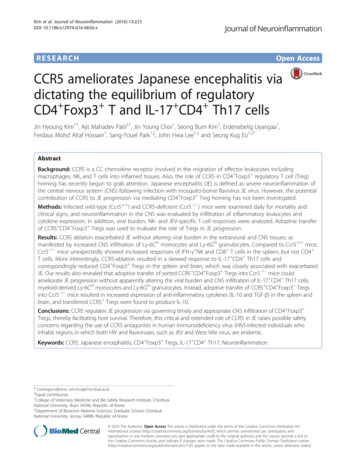
Yu et al. BMC Cancer (2016) 16:397Collected peripheral blood and spleen cell suspensionswere centrifuged at 1.5 103 rpm in order to collectthe cells in a 100 μL flow cytometry staining buffersystem. Mouse Regulatory T cell staining kit #1(eBioscience, San Diego, CA, USA) was used to labelthe cells as per the manufacturer’s instructions. Antimouse CD4 (0.125 μg) and anti-mouse CD25 (0.06 μg)were added to each reacting system and incubated inthe dark for 30 min at 4 C. After surface antibody labeling, the cells were twice washed with flow cytometry staining buffer, before fixation/permeabilizationworking solution (1 mL) was added to resuspend thecells, before they were incubated overnight in the darkat 4 C. The cells were then twice washed withpermeabilization buffer, before 0.5 μg of Fc blocker(CD16/32) was added, and the cells were incubatedagain in the dark for 15 min at 4 C. Finally, antimouse/rat Foxp3 antibody (0.5 μg) was added and thecells incubated in the dark for 30 min at 4 C. The cellswere then twice washed with permeabilization bufferbefore detection, using 500 μL of permeabilization buffer to resuspend the cells. Flow cytometry was undertaken using an Accuri C6 Flow Cytometer (BDBiosciences, San Jose, CA, USA).Lymphocyte clones were first selected from a FSC-A/SSC-A scatterplot, then CD4 T cells clones were selectedthrough a CD4 lymphocyte clone/SSC–A, and finally CD4 CD25 Foxp3 Treg cells were distinguished from CD4 T cells by gating CD25/Foxp3 and homotype contrast withFoxp3. The proportion of CD4 CD25 Foxp3 Tregs toCD4 T cells and lymphocytes was calculated to evaluatethe level of CD4 CD25 Foxp3 Tregs alteration, and theresults analyzed using t-tests.Tumor tissue immunohistochemistryFormalin-fixed paraffin sections were prepared and driedovernight at 37 C. Following dewaxing in xylene and rehydration with alcohols, endogenous peroxidase wasinactivated in 3 % H2O2 at 37 C for 10 min. Microwaveantigen retrieval was completed using a citric acid buffer(0.01 M, pH 6.0, Maixin Biotech, Fuzhou, China) andcooled to room temperature. Immunohistochemistrywas performed with primary IL-10 (Abcam, ab34843,Cambridge, UK) and TGFβ antibodies (Abcam, ab66043).Slides were incubated with both primary antibodies at adilution of 1:100 overnight at 4 C with PBS used as anegative control, and balanced for 30 min at roomtemperature. After washing with PBS, the slides were incubated at a 1:200 dilution of goat anti-rabbit secondaryantibody (Abcam, GR101082-1) for 60 min at roomtemperature. They were then washed with PBS, DAB substrate kit (Zhongshanjinqiao Biotech, Beijing, China) andused to develop the slides which were redyed withhematoxylin (Sigma, St. Louis, MO, USA).Page 3 of 9Three fields were randomly chosen for microscopicstudy ( 200) for each immunohistochemical slide. Eachtissue section was semi-quantitatively scored accordingto the percentage of positive cells and the staining intensity. We assigned the following proportion scores: 0 if0–5 % of the tumor cells showed positive staining, 1 if6–25 % of cells were stained, 2 if 26–50 % were stained,3 if 51–75 % were stained, and 4 if over 75 % of the cellswere stained. We rated the intensity of staining on ascale of 0 to 3: 0, negative; 1, weak; 2, moderate; and 3,strong. We then combined the proportion and intensityscores to obtain a total positive score (range, 0–12):score 0 is negative, a score of 1 to 6 is weakly positive,and a score of 7 to 12 is strongly positive.Statistical analysisAll experimental data is presented as mean standard deviation, and analysis of variance (ANOVA) was performedto compare the data of different groups using the statisticalanalysis system 9.3 (SAS, Cary, NC, USA). A P value 0.05was considered as statistically significant.ResultsRT, CT and IFNα significantly inhibit melanoma growthC57BL/6 J mice were inoculated with B16 cells to produce an in vivo xenograft model of melanoma. The micewere divided into five groups (n 6), and treated with arange of different therapies, including: RT, CT, RCT, andIFNα. As shown in Fig. 1b, the tumor volumes of themice treated with different therapeutic regimens were allsmaller when compared with the tumor volumes of thecontrol group mice. This result indicates that tumorgrowth can be significantly inhibited by conventional RT,CT, RCT, and IFNα. When comparing tumor weights, wecalculated the tumor inhibition based on the mean weightof each group (Fig. 1c, 1d). Tumor growth was better suppressed when mice were given CT and RCT (40.91 % and41.83 %, respectively) when compared with the tumors ofthe RT and IFNα groups (15.10 % and 13.15 %, respectively), as shown in Table 1.IFNα significantly suppresses CD4 CD25 Foxp3 TregslevelsFlow cytometry was used to determine Tregs levels inthe spleen and in peripheral blood of the mice aftercompletion of their treatments. In comparison to thecontrol group, the flow cytometry assay showed that themouse spleen levels of CD4 CD25 Foxp3 Tregs weresignificantly down regulated in INFα group, comparedto the CD4 T cells (P 0.01) and to the lymphocytecells (P 0.01). The decrease in CD4 CD25 Foxp3 Tregs levels of the CT group was significant when compared with the CD4 T cells (P 0.05), but not
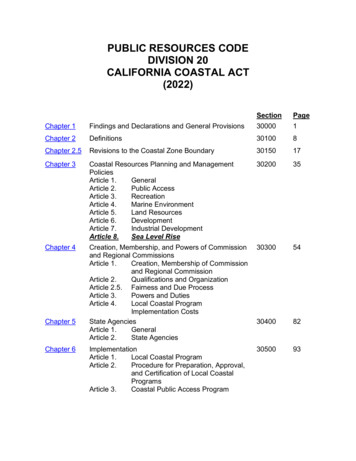
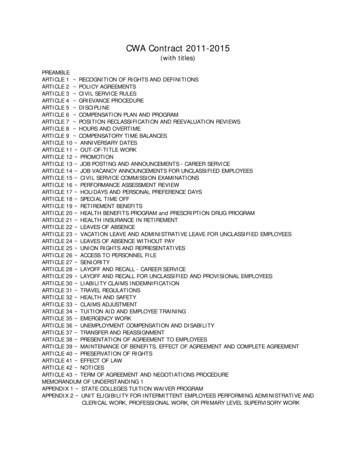
Yu et al. BMC Cancer (2016) 16:397Page 4 of 9Fig. 1 Changes in the tumors after treatment with different therapies. a C57BL/6 J mice and excised tumors from each group. b Volumes of thetumors treated with radiotherapy (RT), chemotherapy (CT), radiochemotherapy (RCT) and IFNα were significantly smaller than those of the controlgroup, p 0.05. V 4/3πabc, a. major radius, b. minor radius, c. radius perpendicular to minor axis, measured by ultrasound. c Excised tumorswere weighed using an analytical balance. Tumor weights were reduced significantly in the CT and RCT groups, while only mildly reduced in theRT and IFNα groups. d. Tumor inhibition rate ((Wcontrol-Wtreatment)/Wcontrol 100 %) after treatment based on the tumor masssignificant when compared with the lymphocytes(P 0.05) (Fig. 2b, 2c).The results for the peripheral blood samples showed asignificant decrease in the IFNα treatment group for bothCD4 CD25 Foxp3 Tregs compared with the CD4 T cellsand compared with the lymphocytes (P 0.05), althoughthere was no significant change in the CD4 CD25 Foxp3 Tregs levels for the RT, CT and RCT groups (Fig. 3). Thedata indicates that IFNα-based immunotherapy can significantly down regulate the level of CD4 CD25 Foxp3 Tregs while RT and CT have little effect.RT and CT upregulate expression of TGFβ and IL-10 intumor microenvironmentTo investigate the changes in TGFβ and IL-10 levels inthe tumor microenvironment, immunohistochemistrywas used to examine TGFβ and IL-10 expression in thexenografts. As shown in Fig. 4a, the expression of TGFβand IL-10 in RT and CT treated mice were much higherwhen compared to the levels in the tumors of the control group. The results showed that the expression levelsin the CT were significantly different to the controlgroup for TGFβ (p 0.01) and IL-10 (p 0.001). InTable 1 Melanoma tumor mass after treatment with different radio-INFαTreatmentNone6 MeV X-ray 500 cGyDTIC 40 mg/kg,D9-15X-ray DTICIFNα-2b 10000U D7,9,11,13,15Number of mice66666Weight of mass (g)3.70 0.943.14 0.902.18 0.772.15 1.033.21 1.860.3660.0240.0390.6174.56 0.942.60 0.682.66 1.182.10 1.122.44 1.370.0050.0230.0060.021N/A15.140.9141.8313.15p valueVolume of mass (cm3)p valueInhibition rate (%)
Yu et al. BMC Cancer (2016) 16:397Page 5 of 9Fig. 2 Flow cytometry assay of mice spleen tissue. a Gating strategies of CD4 T cells and CD25 FOXP3 Tregs for spleen tissue. b and cProportion of Tregs to CD4 T cells and lymphocytes in the spleen. * indicates P 0.05 and ** indicates P 0.01 compared with the control groupaddition, RT was found to increase the expression of IL10 in the surrounding cancer cells (p 0.01) and TGFβexpression was also upregulated, although there was nosignificant difference (p 0.05) when compared with thecontrol group (Fig. 4b, 4c). In contrast to the RT and CTgroups, positive scores arising from the IFNα treatmentindicated no significant alteration in TGFβ and IL-10 expression levels (p 0.05, Fig. 4).DiscussionIn the treatment of melanoma, RT, CT, and interferonare all common adjuvant therapies after surgery. Butwhile many in vitro and in vivo studies have shown thatmelanoma growth can be slowed with RT or CT therapy, little clinical success has been achieved. In addition,there is little known about the benefit of immunotherapeutic regimens either in basic studies or clinical research. This is important to determine as research hasshown that different immune mechanisms appear to playa critical role in the biological behavior of melanoma.The purpose of this study was to examine the effect ofdifferent therapeutic regimens on the immune status andmicroenvironment of the tumors, in particular how the different treatments affected the levels of CD4 CD25 Foxp3 Tregs, TGFβ, and IL-10.The results of this study show that melanoma growthcan be significantly inhibited by many of the examinedtherapies including RT, CT and IFNα. Despite the varyingresults of the tumor inhibition, the most effective was forthe CT and RCT groups when compared with the RT andimmunotherapy groups. From this we hypothesized thatresults are a function of the differing mechanisms underlying the treatments. The drug DTIC exerts its effectthrough indirect inhibition of cell metabolism and directcytotoxicity. While RT has a limited ability to suppressmelanoma growth, it may be used synergistically with CT
Yu et al. BMC Cancer (2016) 16:397Page 6 of 9Fig. 3 Flow cytometry analysis of mice peripheral blood. a Gating strategies of CD4 T cells and CD25 FOXP3 Tregs for peripheral blood. b andc Proportions of Tregs to CD4 T cells and lymphocytes in peripheral blood. * indicates P 0.05 and ** indicates P 0.01 compared with thecontrol groupto kill cancer cells. IFNα therapy is able to modulate theimmune system, and through this, slow the growth ofmelanoma, although its ability to directly affect tumorgrowth is weak. We have observed the clinical efficacy ofdifferent treatments during practice, yet the effect of immunotherapy is relatively mild and it takes time for thetreatment to take effect. We hypothesize that RT and CTgenerally enhance immunosuppression and decrease theimmune response. The results of this work have revealedthat a decrease of CD4 CD25 Foxp3 Tregs in the spleensof the mice after INFα treatment was most prominentcompared with the levels found in mice treated with RTand CT. Also, a significant decrease in the CD4 CD25 Foxp3 Tregs levels in peripheral blood was detected inthe INFα group, as revealed by flow cytometry (p 0.05).These results suggest that immunotherapy with IFNα hasthe ability of down regulate CD4 CD25 Foxp3 Tregs, yetthe influence of RT and CT on CD4 CD25 Foxp3 Tregslevels is negligible.It has recently been reported that IFNα can induce theMAPK/ERK (mitogen-activated protein kinases/extracellular signal-regulated kinases)-mediated phosphodiesterase four activation, and negatively affect cAMP in CD4 CD25 Foxp3 Tregs, thus suppressing the function ofTregs [18]. At the same time, the Jak-Stat1 (Janus Kinase- Signal transducers and activators of transcription 1)pathway can be stimulated by IFNα, which consequentlyactivates effector T cells, natural killer (NK) cells, anddendritic cells, thereby indirectly enhancing the cytotoxic effect on tumor cells [15, 19–21]. Studies by Stergios et al. have suggested an indirect immunoregulatorymechanism of high-dose IFNα-2b which activates hostimmune cells to increase the cytocidal effect on cancercells [21]. In this study, we have demonstrated that INFαis capable of significantly decreasing CD4 CD25 Foxp3 Tregs levels in the spleen and in peripheral blood, suggesting the immunomodulatory ability of INFα is todown regulate CD4 CD25 Foxp3 Tregs. Many other
Yu et al. BMC Cancer (2016) 16:397Page 7 of 9Fig. 4 Immunohistochemistry and positive scores of TGFβ and IL-10 in the tumor microenvironment. a. Immunohistochemistry graphs of tumorxenografts in C57BL/6 J mice, post treatment. Extensive expression of TGFβ and IL-10 could be detected in the area surrounding the melanomacells post radiotherapy and chemotherapy, while IFNα had little effect on the expression of TGFβ and IL-10. b and c Immunohistochemistrypositive scores of TGFβ and IL-10. * indicates P 0.05, ** indicates P 0.01 and *** indicates P 0.001 compared with the control groupstudies have revealed that the ratio of CD4 CD25 Foxp3 Tregs to lymphocytes can be significantly upregulatedin peripheral blood, in the spleen and in the lymphoids,and CD4 CD25 Foxp3 Tregss are resistant to γ-radiation [16, 22]. Our study has also showed the radioresistance of CD4 CD25 Foxp3 Tregs to a certain extent, particularly CD4 CD25 Foxp3 Tregs in peripheralblood. Accordingly, we hypothesize that comprised
Yu et al. BMC Cancer (2016) 16:397lymphocytes exposed to irradiation and radio-resistantCD4 CD25 Foxp3 Tregs that infiltrate into the microenvironment have been implicated in the immunosuppression of those patients given radiotherapy. Severalother studies have suggested that the immune responseof tumor cells can be modulated by fludarabine, paclitaxel and cyclophosphamide, by decreasing or depletingCD4 CD25 Foxp3 Tregs [23–25]. However, Tohyamaet al. [17] have reported that chemotherapeutic agents,such as DTIC, have the ability to impair immunity by increasing CD4 CD25 Foxp3 Tregs and decreasing effector cells, which is consistent with our results. To thisend, further studies are needed to investigate the clinicalefficacy of different drugs on physical immunity.Our study also used immunohistochemistry to detectthe expression levels of TGFβ and IL-10 in the tumormicroenvironment. The results showed that expressionof TGFβ and IL-10 was significantly upregulated aroundtumor cells post RT, CT and RCT, indicating high immunosuppression in the tumor microenvironment. It hasbeen reported that TGFβ and IL-10 are required for CD4 CD25 Foxp3 Tregs mediated immune suppression,which inactivates CD8 T cells and NK cells [9, 14, 26, 27].The combined results of this work and others indicatesthat increased levels of TGFβ and IL-10 post RT and CT,inhibit physical immunity as a result of RT and CT turningCD4 CD25 Foxp3 Tregs as predominant immune cellsamong lymphocyte population. From this, they suppressthe recruitment of other effector cells, such as CTLs andNK cells, which therefore helps cancer cells to evade theimmune system. In contrast to RT and CT, no significantalterations of TGFβ and IL-10 levels in the microenvironment were observed after IFNα-based immunotherapy.ConclusionsThe present study showed that expression of Tregs can bedown regulated by IFNα, which reverses immunosuppression and makes the cancer cells more susceptible to treatment. The reason for why no significant down regulationof TGFβ and IL-10 was detected during IFNα treatmentmay due to short observing time, which also parallels theresponse processes of IFNα in clinical utilization. For differential therapeutic regimens have varying effects onphysical immunity, the immune condition of patients posttherapy should be considered when developing new treatment regimens.AbbreviationsAPCs, antigen presenting cells; CCL22, chemokine (C-C Motif) Ligand 22; CT,chemotherapy; CTL, cytotoxic T cells; DC, dendritic cells; DTIC, dacarbazine;ERK, extracellular signal-regulated kinases; IL-10, interleukin-10; INF, interferon;Jak-Stat1 pathway, Janus Kinase- Signal transducers and activators of transcriptionone pathway; MAPK, mitogen-activated protein kinases; NK cells, natural killer cells;NS, normal saline; RCT, radiochemotherapy; RT, radiotherapy; TGFβ, transforminggrowth factor β; Tregs, regulatory T cellsPage 8 of 9AcknowledgmentsEdanz is thanked for English editing.FundingThis work was supported by the Health & Medicine Commission of ZhejiangProvince (2012KYB037), China.Availability of data and materialsNot applicable. All supporting data for the conclusions are presented in themanuscript.Authors’ contributionsYY and XZ designed the study. RH and XZ wrote the manuscript and carriedout the data analysis. YY, RH, WM and XH participated in the experiments. YYand RH contributed equally to this work. All authors read and approved thefinal manuscript.Competing interestsThe authors declare that they have no competing interests.Consent for publicationNot applicable.Ethics approval and consent to participateThis work was approved by the ethics committee of the Zhejiang CancerHospital and the Experimental Animal Protection and Welfare Committee.Author details1Department of Breast Surgery, Zhejiang Cancer Hospital, 38 Guangji Road,Hangzhou 310022, China. 2Department of Breast Surgery, Shanghai JiaoTong University Affiliated Sixth People’s Hospital, 600 Yishan Road, Shanghai200233, China.Received: 13 December 2015 Accepted: 30 June 2016References1. Owens B. Melanoma. Nature. 2014;515:S109.2. Holmes D. The cancer that rises with the Sun. Nature. 2014;515:S110–1.3. Zou WP. Regulatory T, cells, tumour immunity and immunotherapy. Nat RevImmunol. 2006;6(4):295–307.4. Shevach EM. Fatal attraction: tumors beckon regulatory T cells. Nat Med.2004;10:900–1.5. Takahashi T, Kuniyasu Y, Toda M, Sakaguchi N, Itoh M, Iwata M, et al.Immunologic self-tolerance maintained by CD25 CD4 naturally anergicand suppressive T cells: induction of autoimmune disease by breaking theiranergic/suppressive state. Int Immunol. 1998;10:1969–80.6. Thornton AM, Shevach EM. CD4 CD25 immunoregulatory T cellssuppress polyclonal T cell activation in vitro by inhibiting interleukin 2production. J Exp Med. 1998;188:287–96.7. Tsuji NM, Mizumachi K, Kurisaki J. Antigen-specific, CD4 CD25 regulatoryT cell clones induced in Peyer's patches. Int Immunol. 2003;15:525–34.8. Larmonier N, Marron M, Zeng Y, Cantrell J, Romanoski A, Sepassi M, et al. Tumorderived CD4( )CD25( ) regulatory T cell suppression of dendritic cell functioninvolves TGF-beta and IL-10. Cancer Immunol Immunother. 2007;56:48–59.9. Strauss L, Bergmann C, Szczepanski M, Gooding W, Johnson JT, WhitesideTL. A unique subset of CD4 CD25highFoxp3 T cells secreting interleukin10 and transforming growth factor-beta1 mediates suppression in thetumor microenvironment. Clin Cancer Res. 2007;13:4345–54.10. Baumgartner J, Wilson C, Palmer B, Richter D, Banerjee A, McCarter M.Melanoma induces immunosuppression by up-regulating FOXP3( )regulatory T cells. J Surg Res. 2007;141:72–7.11. McCarter MD, Baumgartner J, Escobar GA, Richter D, Lewis K, Robinson W,et al. Immunosuppressive dendritic and regulatory T cells are upregulatedin melanoma patients. Ann Surg Oncol. 2007;14:2854–60.12. Blobe GC, Schiemann WP, Lodish HF. Role of transforming growth factorbeta in human disease. N Engl J Med. 2000;343:228.13. Saraiva M, O'Garra A. The regulation of IL-10 production by immune cells.Nat Rev Immunol. 2010;10:170–81.14. Kerstin Steinbrink HJ, Gabriele M, Gerold S, Jürgen K, Alexander H. Enk.Interleukin-10-treated human dendritic cells induce a melanoma-antigen-
Yu et al. BMC Cancer (2016) 16:39715.16.17.18.19.20.21.22.23.24.25.26.27.Page 9 of 9specific anergy in CD8 T cells resulting in a failure to lyse tumor cells.Blood. 1999;93:1634–42.Fallarino F, Gajewski TF. Cutting edge: differentiation of antitumor CTL invivo requires host expression of Stat1. J Immunol. 1999;163:4109–13.Qu Y, Jin S, Zhang A, Zhang B, Shi X, Wang J, et al. Gamma-ray resistance ofregulatory CD4 CD25 Foxp3 T cells in mice. Radiat Res. 2010;173:148–57.Tohyama N, Tanaka S, Onda K, Sugiyama K, Hirano T. Influence of anticanceragents on cell survival, proliferation, and CD4 CD25 Foxp3 regulatory Tcell-frequency in human peripheral-blood mononuclear cells activated by Tcell-mitogen. Int Immunopharmacol. 2013;15:160–6.Bacher N, Raker V, Hofmann C, Graulich E, Schwenk M, Baumgrass R, et al.Interferon-alpha suppresses cAMP to disarm human regulatory T cells.Cancer Res. 2013;73:5647–56.Bromberg JF, Horvath CM, Wen Z, Schreiber RD, Darnell Jr JE. Transcriptionallyactive Stat1 is required for the antiproliferative effects of both interferon alphaand interferon gamma. Proc Natl Acad Sci U S A. 1996;93:7673–8.Lesinski GB, Anghelina M, Zimmerer J, Bakalakos T, Badgwell B, Parihar R, etal. The antitumor effects of IFN-alpha are abrogated in a STAT1-deficientmouse
fer to resuspend the cells. Flow cytometry was under-taken using an Accuri C6 Flow Cytometer (BD Biosciences, San Jose, CA, USA). Lymphocyte clones were first selected from a FSC-A/ SSC-A scatterplot, then CD4 Tcells clones were selected through a CD4 lymphocyte clone/SSC-A, and finally CD4 CD25 Foxp3 Treg cells were distinguished from CD4